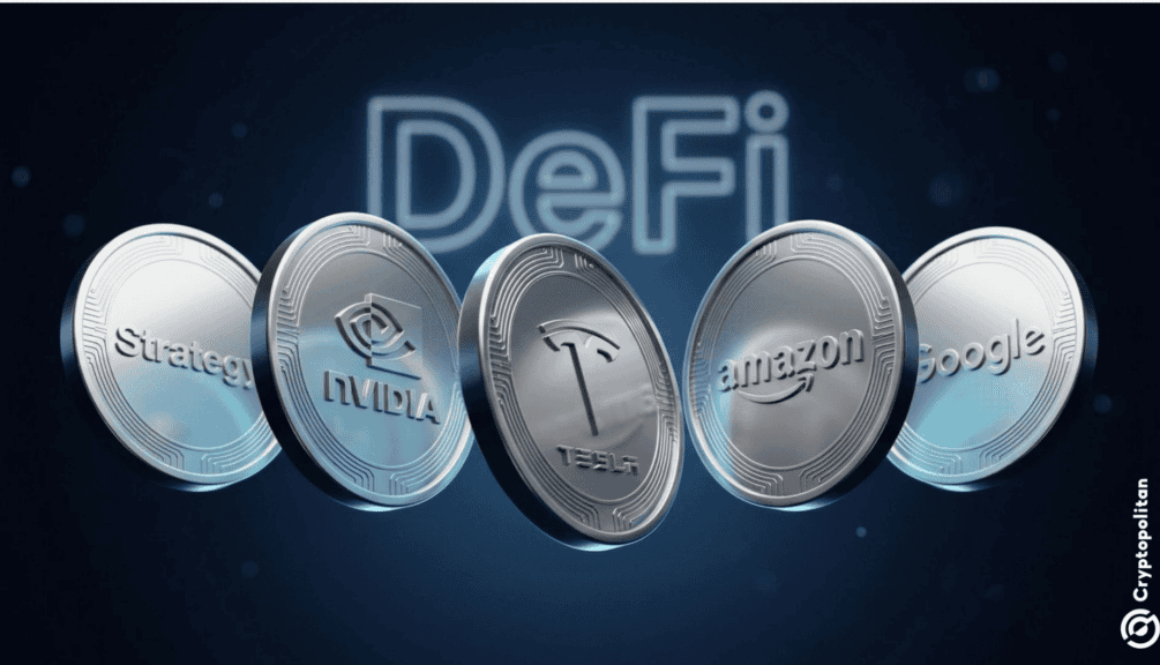
In an August 12 memo, Matt Hougan, chief investment officer at asset manager Bitwise, said most crypto tokens other than Bitcoin are undervalued.
Investors are not aware of how much revenue protocols now pay back to holders. The clearest example is Hyperliquid retiring $1.3 billion of its HYPE token, he said. If the trend continues, the market “could see valuations double or more,” Hougan added.
Hougan says tokens now trade on revenue
For years, the main criticism of crypto was that networks could scale significantly, yet tokens captured little value.
Hougan said, “That era is over,” in the memo titled “Crypto’s Revenue Revolution.” He believes tokens are beginning to trade on the same yardstick as equities and bonds, which is revenue.
Hougan explicitly tied his valuation claim to his belief that the link between protocol revenue and token price is strengthening. Bitwise said the memo represents a snapshot assessment and is not investment advice.
Hyperliquid generated over $800 million in revenue in the last year. The DEX sends about 99% of its fees to buy HYPE on the open market and burn it, according to the Bitwise memo.
Since the token went live in November 2024, those purchases take $1.3 billion of HYPE out of supply permanently.
Hougan said HYPE is up about 800% since launch, at a time when Bitcoin has lost about a third of its value. He credits part of the HYPE’s run to buyers predicting that rising volume would feed straight into the burn.
HYPE changed hands at $57.77, up 2.8% over seven days and 11.1% over the past 30 days, according to CoinGecko data.
Uniswap and Aave copy Hyperliquid’s model
Uniswap’s December 2025 vote on “UNIfication” switched on protocol fees for the first time, instantly burning 100 million UNI, or about $590 million. It now generates about $100 million a year, and it spends all of that on buybacks.
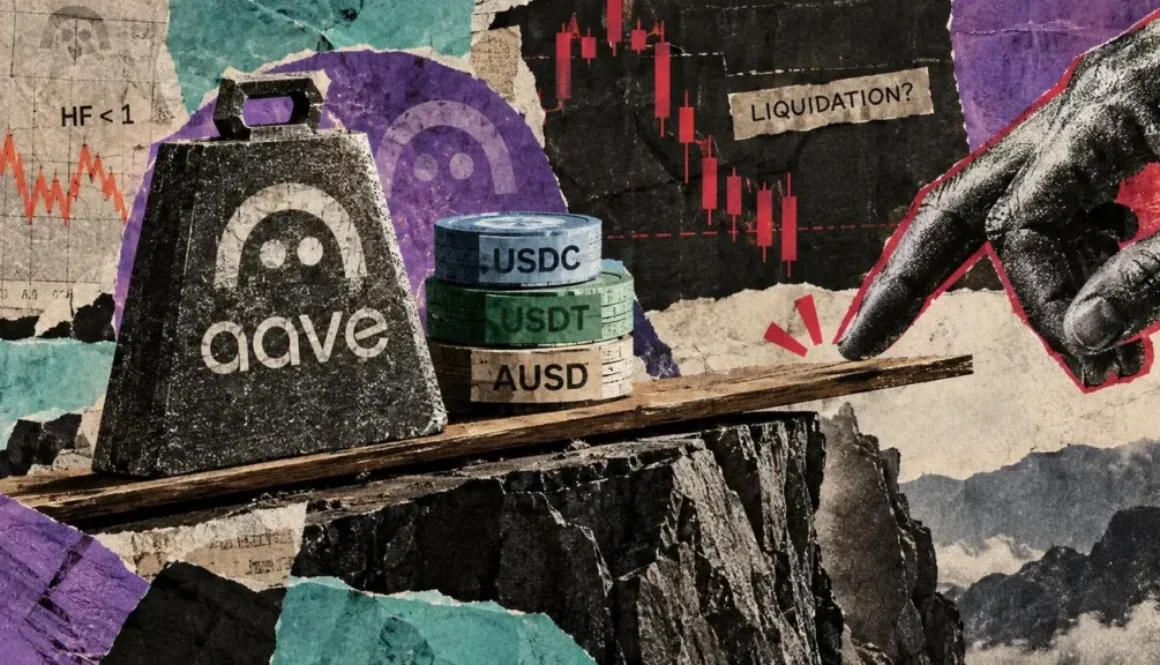
Aave plans to burn about $30 million of AAVE per year, close to a fifth of its revenue. It has implemented an automated program called Aavenomics 3.0.
Pump.fun, doing $328 million in annual revenue, had burned $370 million of PUMP by April 2026. Lighter, a newer perpetuals venue, bought back about 6% of its LIT supply on $67 million of revenue.
“Revenue fever” has reached base-layer chains, Hougan said. Solana’s community has proposed SGP-0003 to increase its fee burn up to 14 times.
Aptos hiked gas fees tenfold this year. Activity on Aptos almost tripled, and annual token burns soared from ~90,000 to about 1.9 million.
A January Cryptopolitan report found that shrinking supply has not reliably lifted prices and that many tokens with regular buybacks still underperformed the market and failed to hold a floor.
Even Hyperliquid broke its initial “up only” pattern. Pump.fun, at one point, had repurchased more than 18% of its supply while the token sat near its lows.
Hougan stated that a token buyback is not like a stock buyback since there’s no contractual right to profits or assets. Governance can always rewrite or change the economics.
Our predictions show that SOL will achieve a high of $238.73 in 2026.
In 2029, it will range between $193.07 and $415.40, with an average price of $304.24.
By 2032, SOL is expected to trade between $348.45 and $800.37, with an average price of $574.41.
Despite occasional challenges for the Solana network ecosystem, including network congestion and competition from other blockchain platforms, the current sentiment shows that Solana demonstrates resilience and adaptability, despite the current price fluctuations, positioning itself as a leading player in the decentralized finance (DeFi) and Web3 landscape.
Overall, the prevailing sentiment regarding the current Solana price within the Solana community reflects the current sentiment of confidence and excitement among investors, driven by the growing interest in Solana with stakeholders eagerly anticipating the platform’s continued evolution and impact on the broader crypto ecosystem.
While uncertainties persist, Solana’s innovative approach, along with its low transaction fees and robust infrastructure instill optimism for its future price action, as indicated by the technical factors and technical analysis. In this article, we’ll explore Solana price prediction and market dominance, particularly when evaluated against momentum indicators. This brings the question “How high can SOL go in 2026 and beyond?” and we’ll try to answer that.
Overview
Cryptocurrency
Solana
Token
SOL
Price
$75.78(-0.15%)
Market Cap
$44.15 Billion
Trading Volume (24-hour)
$1.19 Billion
Circulating Supply
582.61 Million SOL
All-time High
$294.33 Jan 19, 2025
All-time Low
$0.5052, May 11, 2020
24-hour High
$76.50
24-hour Low
$75.36
Solana price prediction: Technical analysis
Market Sentiment
Bullish
50-Day SMA
$75.62
200-Day SMA
$83.20
Price Prediction
$78.31 (+2.80%)
Fear & Greed Index
10.53 (Fear)
Green Days
16/30 (54%)
14-Day RSI
51.98 (Neutral)
Solana price analysis: SOL falls to $75.7
TL;DR Breakdown:
Solana price analysis shows bearish pressure as SOL falls to $75.7
The altcoin lost 0.15% of its value in last 24-hours.
Support for SOL/USD is at $75
Today, on August 13, the Solana price analysis reveals bearish momentum as the price falls to the $75.7 mark.
Solana price analysis 1-day chart: SOL falls to $75.7
The daily price chart shows a slow decline to the $75.7 mark where SOL finds short term support.
The distance between the Bollinger Bands defines the intensity of volatility. This distance between high and low bands is narrow, leading to increased volatility. Moving ahead, the upper limit of the Bollinger Bands indicator, acting as the resistance band, has shifted to $77.14. The indicator’s mean line, which shows a support level, has shifted to $71.82.
The Relative Strength Index (RSI) indicator is trading in the neutral region. The indicator’s value has decreased to 52.47 in the last candle, and its curve suggests bearish market sentiment at the level. If buying activities continue to intensify, further volatility in the market can be expected. However, the short-term indicators suggests a further decline
SOL/USD 4-hour price chart
The four-hour price analysis of the Solana shows the price observes bearish momentum in recent hours as price finds resistance at the $76.5 mark.
The Bollinger Bands are wide and show divergence, hinting at a falling volatility level. This level of volatility signifies decreased market unpredictability. Moving forward, the upper Bollinger Band has shifted to $76.79, securing the resistance point. Conversely, the lower Bollinger Band has moved to $75.15, indicating support.
The RSI indicator is in the overbought region. Currently at 48.27, the RSI’s position is showing bullish sentiment. The level of the index suggests low momentum with room for volatile movement across the short-term. The current slope suggests bullish pressure but we can only expect a rise back to the $79 mark if the bullish momentum is able to hold past $75.
The Solana price analysis suggests a bearish prediction based on ongoing market events for the day. The SOL/USD pair fell to the $73 mark from the highs of $79. SOL then recovered to $76.5 mark where it faced yet another rejection.
Is SOL a good investment?
Solana is a high-performance blockchain platform known for its robust scalability and speed due to various technological advancements, particularly in the crypto space boasting a substantial Total Value Locked (TVL). The network continues to hit key development milestones. Despite a challenging month, price predictions indicate a more positive outlook, suggesting the potential for Solana’s growth and future growth.
Why is SOL down?
Solana failed to establish support at $76.5 and higher levels and the resulting breakdown caused a decline o $75.7 where it finds short-term support. On the other hand, strong bearish pressure weighs on SOL above the $76 mark.
What is Solana going to be worth in 2026?
The Solana (SOL) price prediction for 2026 suggests a minimum value of $83.93 with an average price of $115.48, driven by fundamental factors in the market. The price could reach a maximum of $179.36 during the year.
Will SOL reach $1,000?
The price forecasts indicate that SOL could reach the $1000 mark by mid 2030s, influenced by trends in the broader crypto market. Given the bullish scenario and the projected positive market sentiment and growth trend, SOL might reach $1,000 within the next five years.
Can Solana reach $5,000?
Reaching $5,000 is plausible but would likely take several years beyond the current forecast period. However, a snowball in the asset’s adoption might bring the moment sooner.
Does SOL have a good long-term future?
Yes, Solana has a good long-term future, with a promising market capitalization and exciting potential ROI due to its high scalability, which makes Solana an attractive investment. Its growing adoption, strong developer community, and strategic partnerships further enhance Solana’s forecast of its potential for sustained growth.
Recent news/updates on Solana
Solana recently established a new all-time high of weekly transactions with 1,012,226,009 transactions being recorded between July 27 and August 2.
Weekly transaction count for the week of July 27 – Aug 2 crossed 1B, with a new all-time-high of 1,012,226,009 transactions
The SOL price prediction 2026 for August suggests a range of outcomes based on current market trends, greed index, and analysis. The forecast anticipates SOL to fluctuate between a minimum of $59.32 and an average of $78.46, and potentially attain a maximum of $88.34.
Month
Minimum Price ($)
Average Price ($)
Maximum Price ($)
August
66.35
78.46
88.34
Solana Price Prediction 2026
Solana (SOL) is predicted to reach a minimum of $61.22 in 2026. Experts suggest that future price movements indicate the coin could climb to a maximum of $238.73, with an average price around $153.70.
Year
Min. Price ($)
Average Price ($)
Maximum Price ($)
2026
61.22
153.70
238.73
Solana (SOL) price prediction 2027-2032
Year
Min. Price ($)
Average Price ($)
Maximum Price ($)
2026
61.22
153.70
238.73
2027
129.73
155.19
253.12
2028
146.83
222.79
382.86
2029
193.07
304.24
415.40
2030
227.03
361.48
495.92
2031
228.27
402.66
577.06
2032
348.45
574.41
800.37
Solana Price Prediction 2027
In 2027, Solana’s price is forecast to trade at a minimum of $129.73, reflecting the continued growth of the Solana blockchain. The coin could reach a maximum value of $253.12, with an average trading price of $155.19.
Solana Price Prediction 2028
If bullish momentum continues into 2028, SOL may record a minimum price of $146.83, a maximum of $382.86, and an expected average of $222.79.
Solana Price Prediction 2029
Analysis indicates that Solana could maintain its upward trajectory in 2029, with the price potentially hitting a minimum of $193.07, a maximum of $415.40, and an average of $304.24.
Solana Price Prediction 2030
Based on projections for 2030, Solana may trade at a minimum of $227.03, with an average price of around $361.48 and a possible peak of $495.92.
Solana Price Prediction 2031
Solana’s price is expected to reach a minimum of $228.27 in 2031. Analysts forecast a maximum value of $577.06 and an average trading price of $402.66.
Solana Price Prediction 2032
In 2032, Solana is projected to trade at a minimum of $348.45, with an average price of $574.41, while the maximum price could reach $800.37 if favorable market conditions persist.
Solana price prediction 2026-2032
Solana market price prediction: Analysts’ SOL price forecast
FirmName
2026
2027
Changelly
$167
$248.
DigitalCoinPrice
$132.89
$162.57
Cryptopolitan’s Solana (SOL) price prediction
Our predictions show that SOL will achieve a high of $238.73 in 2026. In 2029, it will range between $193.07 and $415.40, with an average price of $304.24. By 2032, SOL is expected to trade between $348.45 and $800.37, with an average price of $574.41.
However, it is advised to do your own research and conduct expert opinion before investing in the volatile crypto market.
Solana was launched in April 2020 and has gained popularity over the last 18 months. Its price surged from $0.75 to a high of $214.96 in early September.
Following NFT hype and growing demand in the DeFi community, the cryptocurrency Solana (SOL) price more than tripled during the summer of 2021. Solana (SOL) token became the fastest-growing cryptocurrency and is currently ranked fifth with a live market cap of nearly $66 billion.
2022 saw Solana leap to its all-time high of $260, but SOL failed to close the year anywhere near that high, as the price came crashing down to below $40 by June. The bearish markets were marked by high skepticism as trading volumes declined throughout the crypto markets.
The price continued to trade below the $40 level until November 2023, when Solana gained momentum and started a bullish rally again to close the year at $101.84.
In 2024, Solana (SOL) saw significant growth, with its price rising from $83.62 in January to a high of $202.87, fueled by its dominance in DeFi, NFTs, and decentralized exchanges. However, the price fluctuated through the year, retracing to $131 in September after struggling to maintain key levels.
October brought a positive rebound as SOL rose from $152 to close at $167, but early November started bearish, with the price dipping to $160.
However, Solana bounced back sharply and closed the month above the $230 mark. December, on the other hand, has observed a slow start as price volatility remains low.
Solana’s (SOL) price rose significantly in January 2025 from below the $190 level to close the month above $210. However, the latter half of the month saw the price decline from the $230 mark, a trend that continued through February ending the month below $150.
In March the price continued falling as the bears continued dominating the short to mid term markets ending the month below $125. In April the bearish rally has only continued as the price falls towards $100. However, the bulls bounced back in the middle of the month and ended the month around $150.
In May the price continued to rise and ended the month above the $165 price level, a trend that could not extend through June as the month saw a decline falling below the $150 price level to end the month.
July saw a sharp rise to the asset’s volatility with SOL crossing the $200 mark. However, the price could not be maintained and SOL ended the month below the $180 level. In August, on the other hand, SOL made strides and managed to close the month above the $205 mark.
In September, the volatility rose sharply as the price rose to the $250 price level but failed to maintain the level and ended the month at $230. In October, the decline increased sharply as SOL ended the month below $170. In November, and December the decline continued with SOL ending the year at the $125 mark.
In January, the trend continued with Solana crashing towards the $100 mark during the period. In February the decline continued as SOL declined below the $80 mark near the end of the month. In March, the trend continued for the first half but later made some recovery ending the month around the $78 mark.
In April, SOL saw volatility as price spiked to the $90 mark but ended up closing the month around the $83 mark. In May, the price recovered initially but declined again to end the month around the $80 mark.
In June, the trend continued with SOL ending the month around the $73 mark. Early July saw bullish movement a trend that reversed by the latter half resulting in low net volatility for SOL across the month.
Our Pi network price prediction anticipates the Pi price reaching a maximum of $0.3695 by 2026.
In 2032, the Pi price prediction projects a maximum of $1.71.
Pi Network price analysis points to a volatile but potentially higher long-term trajectory, with Pi Network’s maximum price predicted at $0.3695 by 2026 and $1.71 by 2032. That outlook is most applicable to current Pi holders, investors who may be thinking about investing in it, or crypto enthusiasts who just want to know if the recent downturn in Pi has affected its future potential.
It was originally launched as a mobile-first cryptocurrency to provide easy access to digital assets for the average user. Since its launch, PI has surged to its all-time high of $2.98 in February 2025. Later, PI experienced volatility due to market sentiment and has recently dropped to a new all-time low of $0.0805 in July 2026 amid increased selling pressure.
Pi Network has recently been shifting its focus to ecosystem growth and the enhancement of infrastructure. The project introduced improvements to the Pi ecosystem by implementing upgrades to Protocol v24, Pi Nodes update expansion, and new Pi2Day products such as PiVerify, Pi Sign-in, and SoloHost to improve real-world utility across the ecosystem.
With PI trading in a volatile manner and the project still evolving, understanding its historical trend, technical outlook, 2026-2032 forecasts, project development, and key risks and opportunities can help readers make more informed decisions about this highly speculative token.
As Pi Network continues growing its ecosystem and user activity, questions are growing around its long-term value. Will PI bounce back from its recent lows, and where will the token go in the next few years? Let’s explore our Pi Network price prediction and technical analysis from 2026 to 2032.
Overview
Cryptocurrency
Pi Network
Ticker Symbol
Pi
Price
$0.0813
Price Change 24h
-1.98% (24h)
Market Cap
$984.62M
Circulating Supply
10.94B P
Trading Volume 24h
$9.01 million
All-Time High
$2.98, Feb 26, 2025
All-Time Low
Jul 13, 2026: $0.08025
Pi Network Price Prediction: Technical Analysis
Metric
Value
Current Price
$0.0813
Price Prediction
$0.08553 (-25.06%)
Fear & Greed Index
11 (Extreme Fear)
Market Sentiment
Bearish
Volatility
4.87% (Medium)
Green Days
10/30 (33%)
50-Day SMA
$ 0.1394
200-Day SMA
$ 0.1728
14-Day RSI
28.03 (Oversold)
Pi price analysis
TL;DR Breakdown:
Today’s Pi price analysis shows the token under bearish pressure, trading around $0.0813
The token value has declined by around 2% over the past 24hours
Pi’s immediate support is at $0.080, while resistance is around $0.090
As of July 25th, 2026, Pi Network is under bearish pressure as buyers have failed to maintain the recovery achieved recently. At the time of writing, the Pi price is at $0.0813, down by 1.98% over the past 24 hours. Currently, sellers are in control of the broader price action.
PI price analysis on the daily timeframe
Analyzing the daily chart, it shows PI has drained part of last week’s recovery after it failed to sustain the price above $0.090 resistance. Sellers have pushed the price back toward the $0.080 support zone, keeping the trend bearish.
The immediate support is at $0.080, while resistance stands around $0.090. If Pi loses this support, it might test the recent lows again, but if it moves above $0.090, it could allow buyers to challenge the $0.100 psychological level.
Trading activity has slowed down with 24-hour volume dropping to $9.01 million, reflecting weak buying interest. The PI price also remains below both the 50-day SMA at $0.1394 and the 200-day SMA at $0.1728, confirming that the longer-term trend continues to favor sellers.
The RSI has fallen to 31.80, moving just above the oversold region. This shows selling pressure remains strong, although the market is approaching levels where buyers could begin looking for a short-term recovery.
The MACD remains bearish despite showing early signs of stabilization. Although the histogram has started to flatten, the MACD line is still below the signal line, indicating that bearish momentum continues to dominate.
Pi Price Analysis 4-Hour Chart
The 4-hour chart shows Pi continuing to trade under short-term bearish pressure. The price is now near $0.082, with buyers trying to defend the current support zone while sellers attempt to limit all recovery attempts. Although the recent decline has slowed, PI is still trading below its recent swing highs, leaving the short-term trend tilted to the downside.
The first resistance is around $0.085, and immediate support is around $0.080. If the price moves up above $0.085, then the PI token has the potential to test the $0.090 level again, and if it falls below $0.080, it could reach its lows once more.
The Relative Strength Index (RSI) has recovered to 35.09, climbing from oversold conditions but remaining below the neutral 50 level. This indicates that the selling pressure has slightly eased, but it hasn’t been enough to shift the momentum toward buyers.
The MACD is still bearish, as the MACD line stays below the signal line. The gap between the two lines, however, is decreasing and the histogram is flattening, suggesting that bearish momentum is easing and the market may stabilize if buying interest continues to strengthen.
Pi Network Price Prediction: Levels and Action
Daily Simple Moving Average (SMA)
Period
Value
Action
SMA 3
$0.1190
SELL
SMA 5
$0.1229
SELL
SMA 10
$0.1265
SELL
SMA 21
$0.1292
SELL
SMA 50
$0.1394
SELL
SMA 100
$0.1575
SELL
SMA 200
$0.1728
SELL
Daily Exponential Moving Average (EMA)
Period
Value
Action
EMA 3
$0.1186
SELL
EMA 5
$0.1211
SELL
EMA 10
$0.1247
SELL
EMA 21
$0.1289
SELL
EMA 50
$0.1394
SELL
EMA 100
$0.1538
SELL
EMA 200
$0.1924
SELL
Traders also use Fibonacci retracement and other technical indicators with EMAs to assess support, resistance, and possible pullbacks in the coming days or over the next week.
What to expect from the next Pi price analysis?
Pi is likely to remain under pressure while trading below the $0.085 resistance, with $0.080 remaining the key support level. A break above resistance could trigger a recovery toward $0.090, while a loss of support may see PI retest its recent lows.
Why is PI’s price down today?
Pi is down 1.65% over the past 24 hours as weakness across the altcoin market continues to weigh on sentiment, despite the broader crypto market posting modest gains. If PI fails to hold the $0.08 support level, it could retest recent lows, while holding above it may allow the token to consolidate in the near term.
Is Pi a Good Investment?
Pi is not a good buy for cautious investors, and those considering whether to buy Pi Network should treat it as a high-risk, speculative investment that could offer upside if its ecosystem grows and adoption increases. However, its price volatility remains high and dependent on overall market conditions, so investors should be prepared for uncertainty.
The project’s long-term success will largely depend on factors such as Mainnet adoption, developer activity, ecosystem utility, exchange accessibility, and the network’s ability to attract and retain active users. Recent developments, including Pi App Studio enhancements, protocol upgrades, and expanding exchange support, have strengthened the project’s fundamentals, but current trading for Pi remains limited because of the project’s enclosed mainnet, while supply expansion is a major risk because token inflation runs at approximately 20% monthly, or about 174 million PI, which pressures the price, alongside market sentiment challenges.
As with any cryptocurrency investment, investors should conduct their own research, assess their risk tolerance, and avoid investing more than they can afford to lose. While Pi has growth potential if adoption continues to expand, it remains a speculative asset with significant upside and downside risks.
Will Pi Price Reach $5?
At the current pace of development and given its total PI supply and circulating supply of over 8 billion PI, Pi Network’s long-term value will largely depend on user base growth and broader acceptance of cryptocurrencies in mainstream finance, making $5 unlikely in the near term. In that context, Pi Network compares unfavorably with more established blockchain networks on current adoption and practical utility, even as its mobile-first model has attracted broad early interest. The maximum supply of Pi tokens is 100 billion, and ongoing unlocks create significant selling pressure that must be absorbed by demand, while ecosystem growth remains high risk unless developers and users create real utility through DApps or merchant integrations.
Multiple technical quantitative indicators and fundamental factors, such as delayed mainnet launch and maximum supply constraints, suggest that Pi’s price may fluctuate within lower ranges before any major uptrend. Real-world utility will be crucial for supporting demand and helping determine whether Pi can reach higher price targets. A $5 target would require sustained adoption, significant on-chain activity, and strong market demand that is not yet present.
Will Pi Reach $10?
Reaching $10 would represent a massive increase in Pi’s market cap, something that is not expected soon under current crypto market conditions. The $10 mark is considered an upper price target or the high end of speculative forecasts. One forecast model puts the predicted price for Pi Network between $0.14 and $0.56 by the end of 2026, calculated from current market conditions and technical analysis.
Analysts suggest that even optimistic forecasts place this milestone more than a decade away, if at all. Investors should treat such projections as speculative investment advice and conduct their own research before making investment decisions, as Pi remains a high-risk asset with uncertain long-term value.
Does Pi Network Have a Good Long-Term Future?
Pi Network’s long-term prospects depend on its ability to convert its claimed base of over 60 million total users into active ecosystem participants, alongside a KYC-verified community the project puts at 11 million pioneers, though some reports cite 18.1 million KYC-verified users. If developer adoption, merchant integration, and real-world use cases continue to expand, the project could strengthen its position within the cryptocurrency market, but engagement and retention still matter because sentiment can influence long-term adoption.
However, investors should also consider risks related to token supply growth, market competition, regulatory developments, and overall crypto market conditions. As with any digital asset, future performance will
Recent Pi News/Opinions
Kraken listed PI for trading on March 13, 2026, marking one of the clearest exchange efforts to list PI.
On June 28, Pi Network celebrated its annual Pi2Day by launching three products aimed at extending its services to external developers and businesses. The releases are SoloHost (a framework for locally run AI apps), Pi Sign-in (a decentralized login system), and PiVerify (a KYC verification service for external clients). The Core Team’s theme was “Extending Pi Resources outside the Pi Ecosystem.”
Recent on-chain analysisfrom PIScan highlights a stark concentration of PI tokens. Only 21 wallets hold over 10 million PI each, with the Pi Foundation’s largest wallet reportedly controlling over 52 billion PI. In contrast, over 80% of the 16.7 million migrated users hold fewer than 10 tokens. This disparity challenges the project’s narrative of accessibility and decentralization
Pi Network announced that Pi App Studio has introduced a new App Planning Phase feature that uses AI to help creators refine their app ideas before generation. The feature guides users by requesting more details about the app’s main idea, goals, design, and user experience, making the app creation process more interactive and structured.
The new App Planning Phase feature in Pi App Studio allows creators to develop their ideas with the help of AI before App Studio generates the app.
For example, App Studio may ask for more detail about the app’s: – Main idea – Goal – Design – User experience
Pi Network has confirmed that Protocol v25 will launch on July 22, introducing improvements focused on network stability, reliability, and support for privacy-preserving smart contracts through BN254 cryptography and Poseidon hashing. The upgrade will first roll out on the testnet and is designed to support future node enhancements, open-source development, and the network’s planned decentralized exchange (DEX) ecosystem.
On July 22, Pi is scheduled to upgrade to Protocol v25, which primarily focuses on improving network stability and reliability, and supports new capabilities for more efficient, privacy-preserving smart contracts.
Pi Network has completed the distribution of its second testnet token, SLICE, via the Pi Launchpad. The testing phase ran from 12 to 28 June 2026, following an initial launch on PiDay (14 March). Nearly 480,000 users participated, leading to a simplified process. The new Launchpad app now provides allocation details, token pricing, and access to a liquidity pool for testing.
Pi Launchpad has completed the distribution of its second Testnet token, SLICE!
Explore the post-launch experience and see how liquidity pools work through the new price tracking feature!
The Launchpad app in Pi Browser shows individual allocation details, the launch and… pic.twitter.com/9N0RmQz6UG
In July 2026, Pi’s price may average around $0.0906 as bearish market sentiment and weak demand continue to pressure the token following its recent all-time low. A short-term recovery toward $0.1201 could occur if buying activity improves, while continued selling pressure may push PI toward a monthly low near $0.0797. Based on current short-term data, Pi Network’s price is predicted to decrease to $0.08754 by July 29, 2026.
Pi Price Prediction
Potential Low
Potential Average
Potential High
Pi Price Prediction July 2026
$0.0797
$0.0906
$0.1201
Pi Price Prediction 2026
In 2026, Pi Network (PI) is anticipated to trade between $0.07845 and $0.3695, leading to an average annualized price of around $ 0.2239. Based on pi today, that range implies both downside risk toward the low end and upside potential toward the high end from current levels if market sentiment and ecosystem growth improve during the year.
Pi Price Prediction
Potential Low ($)
Potential Average ($)
Potential High ($)
Pi Price Prediction 2026
$0.07845
$0.2239
$0.3695
Pi Price Predictions 2027-2032
Year
Minimum Price ($)
Average Price ($)
Maximum Price ($)
2027
$0.08973
$0.1814
$0.3127
2028
$0.1078
$0.1462
$0.2074
2029
$0.2124
$0.1296
$0.2656
2030
$ 0.1490
$0.4216
$0.5547
2031
$0.5825
$1.07
$1.16
2032
$1.34
$1.52
$1.71
Pi Price Prediction 2027
In 2027, the price of Pi is expected to reach a minimum level of $0.0897. The PI price could climb to a maximum of $0.3127, with an average trading price of $0.1814 throughout the year.
Pi Price Prediction 2028
In 2028, Pi is forecast to trade at a minimum value of $0.1078. The PI price may reach a maximum of $0.2074, while the average trading price could settle around $0.1462.
Pi Price Prediction 2029
In 2029, Pi’s price is projected to reach a minimum of $0.1296. The PI price could rise to a maximum of $0.2656, with an average trading price of $0.2124 during the year.
Pi Price Prediction 2030
In 2030, Pi is expected to trade at a minimum price of $0.1490. The PI price may reach a maximum of $0.5547, with an average forecast price of $0.4216.
Pi Price Prediction 2031
In 2031, Pi’s price is forecast to hold a minimum value of $0.5825. The PI price could climb to a maximum of $1.16, with an average trading value of $1.07.
Pi Price Prediction 2032
In 2032, Pi is expected to reach a minimum price of $1.34. The PI price could rise to a maximum of $1.71, with an average value of $1.52.
Pi price predictions 2027-2032
Pi Network Price Prediction: Analysts’ Pi Price Forecast
Firm Name
2026
2027
Coincodex
$0.1468
$0.1468
DigitalCoinPrice
$ 0.2310
$ 0.2420
Cryptopolitan’s Pi Price Prediction
At Cryptopolitan, we remain cautiously bullish on the long-term outlook for Pi Network despite recent volatility in the cryptocurrency market. Based on our Pi Network price prediction, the current price could gradually recover as ecosystem adoption, trading volume, market capitalization, and utility continue to grow. Earlier pre-launch Pi values reflected derivatives-style trading rather than true price discovery.
Our forecast suggests PI could trade between $ 0.07845 and $ 0.3695, with an average price of $0.2239. However, future price movements will depend on market sentiment, circulating supply growth, technical analysis indicators, and how Pi Network work in live market trading rather than enclosed-network conditions, as well as the network’s ability to attract users, developers, and real-world applications.
Pi Historic Price Sentiment
Pi price history: Coingecko
Pi Network launched in 2019 with mobile mining and operated in a closed ecosystem with no official market price, as tokens couldn’t be traded externally.
Between 2023 and 2024, Pi remained unlisted, with speculative prices ranging between $0.60 and $1.00 in unofficial markets.
In 2025, Pi Network surged to its all-time high of $2.98 in February before entering a prolonged decline that pushed the price to $0.1585 by October. The token later stabilized between $0.20 and $0.26 toward the end of the year..
From January to March 2026, Pi Network fell to a new all-time low of $0.1312 before recovering gradually toward the $0.17–$0.19 range as market stability improved.
By May 2026, Pi Network declined from the $0.17–$0.18 range to around $0.1439, as weak market momentum and continued selling pressure weighed on the token throughout the month.
By June 30, 2026, Pi Network hit a new all-time low of $0.1127.
By July 2026, Pi Network plunged to a fresh all-time low of $0.1025, extending its prolonged downtrend as persistent selling pressure and weak market sentiment pushed the token below the key $0.11 support level.
How Arch Lending Is Turning Bitcoin Into a Private Banking Tool for Everyone
Blockchain Interviews · Crypto-Backed Loans
Crypto-Backed Loans Are Changing How Bitcoin Holders Access Capital. Arch Lending Is Leading the Way.
The ultra-wealthy have borrowed against their assets for decades without selling a single share. Arch Lending is bringing that same strategy to Bitcoin holders, and the results are changing how people think about liquidity, lifestyle, and long-term wealth.
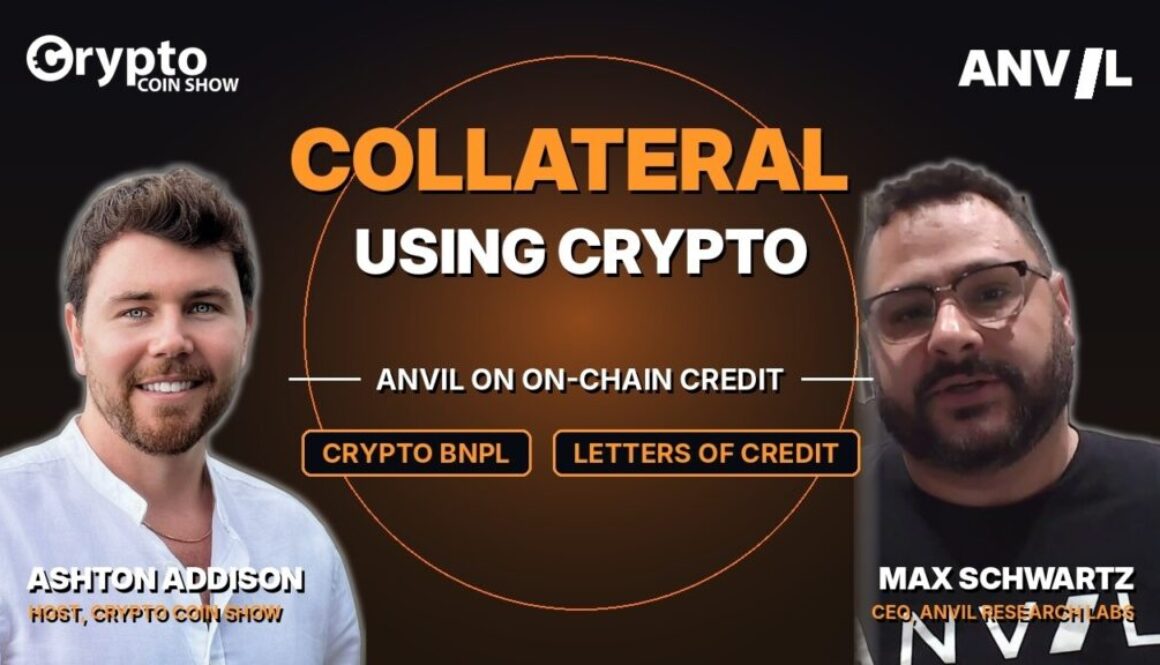
By Ashton Addison · Crypto Coin Show · July 15, 2026
Every crypto holder knows the feeling. Bitcoin is down. Rent is due. The obvious move is to sell, and immediately regret it when the price recovers two weeks later. Worse, every sale triggers a taxable event, chips away at a long-term position, and removes capital from an asset that has historically outperformed nearly every alternative over any five-year window.
For years, the only option was to sell or hold and suffer. Crypto-backed loans change that equation entirely. And no one in the space has built the infrastructure around this idea more deliberately than Arch Lending.
Himanshu Sahay, CTO of Arch Lending, joined me on Blockchain Interviews to break down how Bitcoin-backed loans actually work, who is using them, and what the company is building next. What emerged was a clear picture of a lending platform that has quietly matured into one of the most sophisticated financial tools available to Bitcoin holders today.
$5KMinimum Loan
60%Max LTV
5 minEnd-to-End
4+ yrsLongest Clients
The Problem With Selling
With Arch Lending, a borrower pledges their Bitcoin or other digital assets as collateral and receives up to 60% of the collateral’s value in cash, directly into their bank account, without selling a single coin. The loan rolls on 12-month terms, interest rates are locked at signing, and the collateral sits untouched at Anchorage Digital, a federally chartered US bank and qualified custodian, in a bankruptcy-remote structure.
The process takes about five minutes from sign-up to funded loan. KYC is fully automated. For loans exceeding $100,000, borrowers can request their collateral be held in a segregated wallet, with the address shared directly so they know exactly where their assets are at all times.
Bitcoin is pristine collateral. It is the reserve asset of our time and it is liquid. We do not need to gate keep this at the private banking level. We can bring it down to an everyday level.
Bitcoin-Backed Loans as a Lifetime Strategy
What makes Arch Lending structurally different from most lending platforms is the long-term architecture behind the product. This is not a short-term bridge loan with a hard payback date at the end of the year. The rolling 12-month structure is designed to run indefinitely. Arch has clients who have been borrowing continuously for four-plus years, with no intention of stopping.
Sahay frames it explicitly in private banking terms. When high-net-worth individuals hit a certain asset threshold, they go to JP Morgan or UBS, hand over their portfolio, and draw a line of credit against it for life. They fund their lifestyle, their investments, their children’s education, without ever touching the underlying assets. The asset base keeps growing. The borrowing keeps running.
Bitcoin-backed loans are the same concept, democratized. You do not need $20 million in stocks to access this kind of structure anymore. You need Bitcoin, a few minutes to sign up, and a clear understanding of how LTV works.
How It Works
Pledge Bitcoin as collateral. Borrow up to 60% of its value in cash or stablecoins. Collateral is held at Anchorage Digital, a federally chartered US bank, in a bankruptcy-remote, segregated structure. Loans roll on 12-month terms indefinitely. Interest payments can be deferred. Refinance for free if rates drop.
Understanding the Risk and Why the Numbers Are Designed to Protect You
The most common concern with crypto-backed loans is volatility. Bitcoin can drop sharply in a bear market. What happens to the loan?
Arch Lending’s risk model is built around a sliding LTV scale. Borrowers start at 60% LTV. A margin call triggers at 70%, giving borrowers time to add collateral or partially repay. A liquidation event, which Arch does partially and never fully, occurs at 80% LTV and only after direct contact with the borrower.
The outcome at worst case: a small partial liquidation that brings the LTV back to 65%, and the loan continues. The borrower keeps the majority of their Bitcoin and keeps going. A margin call is a feature, not a punishment. It is the mechanism that keeps the loan healthy so borrowers never become forced sellers at the worst possible moment.
Sahay’s practical advice for retail borrowers: never pledge your entire stack. Use 60 to 70% of what you hold. Keep reserves available so a market downturn becomes a manageable event rather than a crisis.
How Crypto-Backed Loans Compare to a Bank Loan or Credit Card
The question newcomers ask most often is straightforward: why not just go to my bank? The answer comes down to three things: speed, collateral, and what you have to give up to get the money.
A traditional bank loan requires a credit check, proof of income, and often weeks of processing. A credit card charges 20% or more in annual interest with no ceiling on the rate and no underlying asset working in your favor. A home equity loan takes months, ties up your property, and if you default, you lose your house. Not a portion of it. The whole thing.
A crypto-backed loan through Arch requires none of the above. There is no credit check. There is no income verification. The collateral is Bitcoin: liquid, globally priced, and held safely at a federally chartered US bank. The process takes five minutes. The interest rate, currently ranging from around 10.49% down depending on loan size, is locked at signing and does not compound. And if the worst happens and a margin call cannot be met, Arch does a partial liquidation to bring the loan back to a healthy LTV. No foreclosure. No full wipeout. The loan continues.
The other meaningful difference is that a crypto-backed loan does not force you to time the market. With a credit card or personal loan, you spend borrowed money and pay it back from income. With a Bitcoin-backed loan, you borrow against an asset that is historically appreciating at 20 to 30% annually over five-year windows, while paying simple interest at sub-10%. The math works in the borrower’s favor in a way that no credit card or personal loan ever could.
The Sailboat Story and What It Actually Represents
One of Arch Lending’s most striking client stories involves a business owner and former sailing captain who used a Bitcoin-backed loan to purchase a blue-water yacht. He and his wife now live aboard full-time in St. Vincent in the Grenadines, sailing the Caribbean while he runs his business remotely. The loan covered the yacht purchase, insurance, maintenance, and repairs. He kept every Bitcoin he had accumulated. His interest rate is lower than a traditional marine loan would have offered, and because the loan is interest-only and non-amortizing, his monthly outgoings are a fraction of what conventional financing would require.
We are not here to be a short-term lender. We are here to be a partner for life, a private bank as you grow into your assets.
It sounds like an extraordinary edge case. Sahay makes the point that it is not. Arch has processed several thousand loans. The use cases include data center operators funding infrastructure, film producers financing productions, families buying homes, and everyday investors refinancing high-interest debt. The sailboat is memorable. The pattern it represents is not unusual: people with accumulated Bitcoin who need real-world capital and do not want to give up their position to get it.
Beyond Bitcoin: Ethereum, Solana, and XRP
While approximately 80% of Arch Lending’s business is Bitcoin, the platform supports Ethereum, Solana, and XRP, with additional assets available on request for any high-liquidity, high-market-cap digital asset. Arch has a significant XRP borrower base including businesses, and has participated in XRP-focused conferences alongside major ecosystem events.
The approach reflects a broader principle: Arch’s business is providing liquidity against digital assets, not taking a position on which asset is superior. The risk management infrastructure runs fully automated across supported assets, and the same protections apply across the board. Partial liquidation only, transparent LTV thresholds, no full wipeouts.
What Is Coming Next
Arch Lending has been credit-first since launch, and that remains the core product. But Sahay outlined a clear expansion roadmap during the interview.
Yield products are in development and expected later in 2026. For holders who do not have an immediate borrowing need, the ability to put idle assets to work through Arch’s infrastructure is the logical next step. A card product is also in progress. Details are limited for now, but a card tied to crypto-backed credit would give borrowers a direct spending mechanism without additional conversion steps.
Most immediately, Arch Lending is rolling out qualified custody for individual users, offering fully bankruptcy-remote US bank-grade custody at no cost, with trading and staking access at 25 basis points, significantly below the rates charged by major consumer platforms.
On the regulatory and geographic front, a California license is expected imminently, which would make Arch the first crypto lender with that certification in the state. Global expansion is underway through partnerships with regulated entities in major markets not yet accessible for individual retail borrowers.
The Bigger Picture
The crypto lending industry collapsed publicly in 2021 and 2022. Celsius, BlockFi, and others went under after mismanaging their books, lending out customer assets, taking on leverage, and operating without the discipline that any serious lender requires. The damage was real and the skepticism that followed was earned.
What has rebuilt since then is structurally different. At Arch, assets are held at a federally chartered US bank, bankruptcy-remote and untouched during the loan. That is the direct answer to how those earlier platforms failed. Collateral is not rehypothecated. It does not fund Arch’s operations. It sits in place until the loan is closed.
The industry is now larger than it was at its 2021 peak, and the terms, rates, and protections available to borrowers are materially better. Interest rates that once ran well above 15% are now sub-11% and falling as Arch’s cost of capital drops with scale and as broader rates ease.
For Bitcoin holders who have accumulated over years and need capital for a business, a home, or any life decision, crypto-backed loans are no longer a niche product. They are a mature financial tool with a clear structure, transparent terms, and a track record that is growing loan by loan.
Watch the Interview
Himanshu Sahay, CTO of Arch Lending · Blockchain Interviews with Ashton Addison
Learn more and explore your borrowing options at archlending.com
World Liberty Financial price prediction for 2026 expects the price of WLFI to surge toward $0.41.
By 2032, we expect the World Liberty Financial price to record a maximum price of $1.4.
Donald Trump has embraced the title of the “crypto president”, a label that has fueled massive speculation across the crypto industry.
After Trump’s 2024 election victory, the price of Bitcoin surged, a move many analysts and traders called a bullish signal for the cryptocurrency market. Building on this momentum, Trump introduced his own branded tokens, most notably the $TRUMP token and $MELANIA memecoin, solidifying his direct involvement in the crypto market.
Whether Trump’s push into crypto is driven by policy goals or personal profit, one message is clear: he intends to make cryptocurrency part of both his political strategy and financial portfolio.
However, Trump’s personal involvement in crypto tokens raises critical ethical questions. If a sitting or future U.S. president profits directly from token sales, DeFi projects, or blockchain ventures, it risks blurring the line between public duty and private gain.
One project drawing major attention is World Liberty Financial after major listings, a Trump-backed decentralized finance (DeFi) platform. This article explores what World Liberty Financial is, and what Trump’s embrace of crypto could mean for the future of Bitcoin, memecoins, and U.S. crypto policy.
Consequently, numerous analysts eagerly anticipate the future valuation of its native cryptocurrency, WLFI. This raises the question: Can WLFI price reach $1?
This forecast for World Liberty Financial’s price examines factors such as ecosystem trends, adoption rates, underlying technology, and technical analysis to project the WLFI price prediction from 2026 to 2032.
Overview
Cryptocurrency
World Liberty Financial
Ticker Symbol
WLFI
Rank
27
Current Price
$0.06
Price change 24H
+4%
Market cap
$1.8 Billion
Circulating supply
24.66 Billion WLFI
Trading volume 24h
$116M (-18%)
All-time high
$0.46, September 1, 2025
All-time low
$0.051, May 2, 2026
WLFI price prediction: Technical analysis
Metric
Value
Current Price
$0.06
Price Prediction
$ 0.04452 (-25.19%)
Fear & Greed Index
23 (Extreme Fear)
Sentiment
Bearish
Volatility
7.18% (High)
Green Days
15/30 (50%)
50-Day SMA
$ 0.06807
200-Day SMA
$ 0.1151
14-Day RSI
40.32 (Neutral)
World Liberty Financial technical analysis: WLFI price faces bullish pressure toward $0.06
WLFI price analysis shows a bullish pattern toward $0.06
Resistance for WLFI is present at $0.0633
Support for WLFI/USD is present at $0.06
The WLFI price analysis for 25 June confirms that WLFI faces increasing volatility as it surges toward $0.06. Currently, the bulls are aiming for further surges.
WLFI price chart prediction: World Liberty Financial faces buying pressure toward $0.06
WLFI price is facing a decline as buyers push the price toward $0.06. WLFI price is aiming for a hold above the immediate Fib channels. The 24-hour volume surged toward $8.3 million, showing increased interest in trading activity. The price is trading at $0.06, surging over 4% in the last 24 hours.
The RSI-14 trend line has surged from its previous level and trades around the neutral region at level 48, suggesting upcoming buying pressure.
WLFI/USD 4-hour price chart: Bears aim for a hold below EMA trend lines
The 4-hour WLFI price chart suggests WLFI continues to experience bullish activity around EMA lines, creating a positive sentiment on the price chart. As the price hovers around EMA trend lines, bears prepare for a domination by sending the price below the EMA20 trend line.
The BoP indicator trades in a negative region at 0.62, hinting that sellers are trying to build immediate pressure near resistance levels and boost upward correction. However, the MACD trend line has formed green candles above the signal line, hinting at a bullish pressure.
WLFI technical indicators: Levels and action
Daily Simple Moving Average (SMA)
Period
Value
Action
SMA 3
$ 0.05885
BUY
SMA 5
$ 0.05881
BUY
SMA 10
$ 0.05951
SELL
SMA 21
$ 0.06187
SELL
SMA 50
$ 0.06807
SELL
SMA 100
$ 0.08474
SELL
SMA 200
$ 0.1151
SELL
Daily Exponential Moving Average (EMA)
Period
Value
Action
EMA 3
$ 0.05894
SELL
EMA 5
$ 0.05901
SELL
EMA 10
$ 0.05970
SELL
EMA 21
$ 0.06188
SELL
EMA 50
$ 0.06971
SELL
EMA 100
$ 0.08462
SELL
EMA 200
$ 0.1108
SELL
What to expect from WLFI price analysis next?
The hourly price chart confirms that bears are making efforts to prevent the WLFI price from an immediate surge. However, if WLFI’s price successfully breaks above $0.0633, it may surge higher and touch the resistance at $0.0653.
If bulls cannot initiate a surge, WLFI’s price may drop below the immediate support line at $0.06, resulting in a correction to $0.0566.
Why is the WLFI price up today?
Sellers are losing confidence to maintain their dominance, resulting in an upward push toward $0.06.
WLFI crypto news
As reported by Cryptopolitan, WLFI co-founder arrest video resurfaces as legal dispute with Justin Sun intensifies. Charges from the 2022 arrest were dismissed but footage gains public attention.
Is WLFI a good investment?
Trading $WLFI will be very risky. Since it’s a new and highly hyped token with only a small amount available at launch, the price could change quickly and unpredictably. Liquidity will be thin, so even one big trade might move the market. It’s normal for tokens like this to surge at launch and then drop as early buyers cash out.
However, considering its background and ongoing trading volume, WLFI can turn out to be a good investment option in the long-term.
What is the WLFI price prediction for 2026?
By 2026, analysts predict that World Liberty Financial (WLFI) will start the year at $0.1, with an average trading price of $0.37, and could climb as high as $0.41.
Will WLFI price touch $1?
Yes, WLFI price might touch the $1 milestone by the end of 2031. However, the token might attain this level much earlier, depending on the future market sentiment and buying demand.
Will WLFI Price Reach $10?
If everything remains good and WLFI gains recognition, its price might surpass $10 by 2040.
Is WLFI a good long-term investment?
As World Liberty Financial aims to expand its offerings, it might gain a significant position in the altcoin market. Hence, WLFI can be a good long-term investment option. The WLFI long term price outlook is looking strong due to its strong political support.
WLFI price prediction June 2026
Analysts expect a steady surge in crypto market prices in June. We expect WLFI to record a minimum price of $0.045 and a maximum price of $0.08, with an average of $0.06 in June.
WLFI Price Prediction
Potential low
Potential average
Potential high
WLFI Price Prediction June 2026
0.045
0.06
0.08
WLFI price prediction 2026
By the end of 2026, analysts predict that World Liberty Financial (WLFI) will record a minimum price of $0.04, with an average trading price of $0.37, and could climb as high as $0.41.
WLFI Price Prediction
Potential low
Potential average
Potential high
WLFI Price Prediction 2026
$0.04
$0.37
$0.41
WLFI Price Predictions 2027-2032
Year
Minimum Price
Average Price
Maximum Price
2027
0.4
0.44
0.47
2028
0.55
0.65
0.68
2029
0.7
0.8
0.81
2030
0.72
0.83
0.86
2031
0.89
0.96
1.02
2032
1.26
1.3
1.4
WLFI Price Prediction for 2027
By 2027, experts forecast WLFI to begin at $0.40, maintain an average price of $0.44, and potentially reach $0.47. This represents a healthy climb from 2025, showing that WLFI is gaining traction in the crypto space.
World Liberty Financial Price Prediction 2028
By 2028, market analysts and experts predict that WLFI will start the year at $0.55, with an average price of $0.65, and trade around $0.68.
WLFI Prediction for 2029
By 2029, forecasts suggest WLFI will open at $0.7, trade at an average of $0.8, and could move up to $0.81.
World Liberty Financial Price Prediction 2030
By 2030, analysts expect WLFI to begin at $0.72, maintain an average price of $0.83, and rise toward $0.86.
WLFI Crypto Price Forecast for 2031
By 2031, experts predict WLFI will start at $0.89, trade at an average of $0.96, and potentially reach $1.02. Crossing the one-dollar mark would be a significant psychological milestone for investors and a strong indicator of growth.
World Liberty Financial Price Prediction 2032
By 2032, WLFI is expected to open at $1.26, average around $1.3, and peak at $1.40.
WLFI Price Predictions 2026-2032
WLFI coin price forecast by experts
Firm Name
2026
2027
Coinpedia
$0.539
$0.359
CoinDCX
$0.35
$0.46
Cryptopolitan’s WLFI price prediction
Cryptopolitan is bullish on WLFI price prediction as the token is backed by a strong community. As a result, we are bullish on WLFI future price forecast. By 2027, experts forecast WLFI to begin at $0.40, maintain an average price of $0.44, and potentially reach $0.47. This represents a healthy climb from 2026, showing that WLFI is gaining traction in the crypto space.
WLFI historic price sentiment
WLFI Price History
The $WLFI governance token for World Liberty Financial, the Trump family–backed DeFi platform, launched for public trading and token claims on September 1, 2025, at 12:00 UTC. This token generation event (TGE) kicked off spot trading on Ethereum’s mainnet, following a presale that raised over $550 million from 85,000+ investors since October 2024.
The WLFI token price initially surged toward $0.478 but it later declined toward $0.1611.
On 6 September, the WLFI price again attempted a surge toward $0.2. By the end of September, WLFI declined below $0.2.
By the end of October, the price of WLFI further declined and touched $0.1 in early November.
In early December, WLFI price started trading below $0.15.
However, the price surged in January 2026 as it touched a high around $0.19.
However, WLFI later dropped toward $0.12 in February. WLFI ended that month by trading below $0.1.
By March’s end, WLFI dropped below $0.09. In April, WLFI dropped below $0.06.
In May, the price of WLFI dropped toward $0.056 before recovering slightly.
Satori Finance, a decentralized derivatives platform backed by names including Coinbase Ventures and Polychain Capital, has said it will wind down operations by July 16, putting another spotlight on how difficult crypto perps infrastructure has become outside the largest venues.
TL;DR
Satori Finance said it will shut down operations and terminate services by July 16, 2026.
The team cited prolonged unfavorable market conditions and unsustainable revenues.
The stronger angle is not venture backing, but the pressure smaller perps venues face in a crowded market.
In an announcement on X, Satori said it would begin winding down all operations and services, giving users a defined period to withdraw funds. The team attributed the decision to a combination of market pressure and revenue conditions that no longer supported the platform’s continued operation.
The shutdown is notable because Satori was not a fringe experiment. It had backing from major crypto investors and operated in one of the industry’s most active categories: perpetual futures. Yet the announcement shows that even well-funded teams can struggle when liquidity, user activity and fee capture concentrate around a small number of dominant venues.
A Harder Market For Perps Platforms
Perpetual futures remain one of crypto’s most important trading products, but that does not make every perps platform durable. Traders tend to gravitate toward venues with deep liquidity, reliable execution, broad collateral options and strong incentive programs. For newer or smaller platforms, the cost of competing can become heavy quickly.
Satori’s decision also lands at a time when derivatives venues are facing tighter scrutiny, more product competition and a market where users are less willing to experiment with marginal liquidity. In that environment, venture backing can help a protocol launch, but it cannot guarantee long-term trading volume or recurring revenues.
What Users Need To Watch
The immediate practical point is the withdrawal deadline. Users with funds on Satori should review the platform’s official announcement and follow the instructions from the project directly. Shutdown periods can create confusion around access, support queues and final settlement processes, so relying on copied summaries or third-party posts is risky.
For the wider DeFi market, the Satori closure is another reminder that protocol survival increasingly depends on real fee generation. Token incentives and early investor backing may draw attention, but derivatives platforms need persistent liquidity and a reason for traders to return every day.
The Bigger Signal
The Satori wind-down should not be read as a failure of decentralized derivatives as a category. Instead, it underlines a harsher reality: perps trading is a scale business. The winners can be very valuable, but the middle of the market is difficult. For DeFi builders, the lesson is that clever infrastructure still needs distribution, liquidity and sustainable economics.
Why This Is Not Just A Small Protocol Story
When a derivatives venue shuts down, it also tells the market something about where liquidity is concentrating. Traders may still want decentralized perps, but they increasingly expect the kind of depth, incentives and interface quality that only a small group of platforms can consistently provide. That leaves smaller teams with a difficult choice: spend more to compete, narrow the product, or wind down before user funds and support obligations become harder to manage.
Bitcoin holders appear unwilling to support dedicated Bitcoin-native DeFi at the scale needed to keep projects in the space alive.
That is the tension behind Botanix Labs’ decision to wind down Botanix, a Bitcoin Layer 2 built to bring EVM-style applications, lending, borrowing and yield to BTC holders.
The wind-down is harder to dismiss than a routine token-cycle collapse. Botanix says it deliberately avoided a token, airdrops, points programs and the usual machinery used to manufacture early chain activity.
Demand still fell short.
Botanix said its first target wind-down date is July 1, followed by a two-week grace period through July 15 and, if needed, a final extension to Aug. 1 before the remaining Bitcoin is swept and the company begins to dissolve.
Its homepage notice tells users to withdraw assets before the July 1 deadline.
The shutdown lands at an awkward moment for BTCFi. Bitcoin yield, collateral, structured credit and treasury products are becoming more visible across mainstream finance.
Yet one of the cleaner attempts to build Bitcoin-native DeFi rails is leaving the market after concluding that demand was too weak on its own.
What Botanix actually proved
Botanix did not leave behind an empty testnet or a white paper. The team says Spiderchain went live and stayed live for more than a year with 100% uptime and zero security incidents.
It says the network processed 25 million transactions, reached about 200,000 wallets, moved tens of millions of dollars in assets, and secured integrations with Chainlink, Morpho, GMX, Dolomite, Fireblocks, Alchemy, Galaxy, and OKX Wallet.
The current homepage shows the same shape in live-facing terms: more than 26.1 million total transactions, 176,056 unique addresses and 8,387 total contracts.
Those numbers make the failure harder to dismiss. Botanix was building on shipped infrastructure, live usage, and recognized partners, rather than asking the market to imagine a future Bitcoin DeFi layer.
It says it operated one and gave users an organic path into Bitcoin-backed applications without adding a new token as the main economic primitive.
That is why the postmortem is more useful than a normal shutdown notice. It asks whether a working Bitcoin DeFi layer can attract enough users when the product competes with a much easier path: keep BTC where it already is, or use a representation of it elsewhere.
Botanix’s own answer is blunt. The team said it mistimed the Bitcoin community’s center of gravity.
In its view, Bitcoin holders are still working through questions about BTC as a reserve asset, its political and monetary role, and the conservative culture around the base layer. Programmable utility sits downstream of those concerns.
Some Bitcoin holders clearly want yield, leverage, or access to collateral. Botanix’s conclusion is that a dedicated Bitcoin Layer 2 must overcome more than just technical risks.
It has to persuade users that the extra security story, wallet flow, and application set are worth the switch in behavior.
Botanix removed the easy excuse that demand disappeared only after rewards ended.
Its own record raises a harder distribution question: when users can already access BTC products elsewhere, how much extra value does a native rail need to deliver?
The market chose easier rails
The clearest line in Botanix’s post is about WBTC. For lending, basic yield and leveraged exposure, the team said WBTC on a mature Layer 2 such as Arbitrum is sufficient for most users who want Bitcoin-denominated DeFi.
That statement cuts through a lot of BTCFi marketing. The practical test is whether enough users care about native Bitcoin rails when they can already borrow, lend or trade against wrapped Bitcoin on venues with deeper liquidity, familiar interfaces and more established applications.
Recent market context points in the same direction. Circle’s launch of cirBTC on Ethereum shows the wrapped-BTC fight moving toward custody, reserve visibility, redemption controls and institutional trust.
CryptoSlate’s coverage framed the same launch as an attempt to make wrapped Bitcoin look bank-grade before institutions use it as collateral.
That is wrapped Bitcoin finance: BTC exposure converted into a form that risk desks, market makers, lending venues and settlement systems can route through existing workflows.
The same pattern is visible outside DeFi. BlackRock’s iShares Bitcoin Premium Income ETF seeks Bitcoin performance while generating premium income through an options strategy.
CryptoSlate reported that Bitcoin is being packaged for income investors through products such as BITA, Metaplanet’s Siiibo acquisition, and other yield structures that generate income from options, credit, or collateralized exposure rather than from Bitcoin’s protocol.
Metaplanet’s Siiibo deal adds another version of the same idea. The Japanese Bitcoin treasury company is trying to turn a BTC balance sheet into a regulated securities channel for bonds, funds and yield-style products.
Terms, approvals, collateral rules, and investor protections remain undisclosed, so the risk profile remains unresolved. The direction is clearer than the product design: Bitcoin is being turned into something brokerages and income investors can buy.
These products also translate Bitcoin into familiar paperwork, accounts and risk frameworks. That translation reduces the behavioral change required from the buyer.
The user may be seeking income, liquidity, or access to collateral, rather than making a statement about Bitcoin’s technical roadmap.
Native rails face a distribution problem
Botanix also pointed to a second force: distribution. It named Hyperliquid, Robinhood, major centralized exchanges, and emerging TradFi participants as venues that are absorbing more attention, flow, and revenue because they own the user relationship.
That diagnosis fits the broader Bitcoin finance buildout. CryptoSlate’s structured-credit reporting showed that Bitcoin is already being used in insurance reserves, loans, and securitizations, including Ledn’s $188 million Bitcoin-backed loan securitization in February 2026, with $160 million of senior notes rated BBB- and $28 million of junior notes rated B-.
CryptoSlate also reported on Morgan Stanley and Galaxy’s work around Bitcoin and Ethereum collateral, describing a market where institutions are competing to control the wrapper, custodian, collateral agent or servicing infrastructure through which crypto assets flow.
For a user, those paths often feel less ideologically pure but more legible. A brokerage account, ETF, lending desk or wrapped asset has a known interface.
It may also have clearer disclosures, deeper liquidity, tax reporting, customer support or institutional approval.
A Bitcoin-native DeFi rail must offer sufficient additional value to overcome that convenience gap.
Question
Bitcoin-native BTCFi rails
Wrapper-led Bitcoin finance
Custody story
Attempts to keep the product closer to Bitcoin-native assumptions
Uses custodians, ETFs, wrapped tokens or brokerage platforms
User path
Requires new wallets, bridges, apps and risk decisions
Runs through venues and accounts users already know
Yield source
Needs real application revenue or protocol-level demand
Often comes from options premiums, credit structures or collateral use
Distribution
Must build its own audience
Leans on exchanges, asset managers, banks and brokers
Main risk
Insufficient repeat usage to sustain the network
Complexity, counterparty risk, capped upside or forced-selling loops
That split helps explain why Botanix could be technically credible and commercially exposed at the same time. The network had activity, integrations, and uptime, but the competing channels offered an easier customer path.
The Bitcoin finance boom is splitting into two tracks: productive BTC through wrappers and native BTCFi, which is still fighting for habitual users.
The real BTCFi test
Botanix’s shutdown shows that technical credibility and organic metrics are still insufficient if the product fails to align with where users are willing to take risks.
The more precise reading is that Bitcoin DeFi remains caught between two markets. One market wants Bitcoin to stay simple: reserve asset, collateral, treasury holding, long-term store of value.
The other wants Bitcoin to become productive: borrowed against, wrapped, routed into income products, posted as collateral and used inside trading systems.
Botanix tried to connect those markets through Bitcoin-native infrastructure. The growth elsewhere suggests many users and institutions are choosing the second market, but through wrappers that hide the complexity or hand it to a regulated intermediary.
That makes the next BTCFi cycle easier to judge. The test is whether a Bitcoin-native network can produce repeat users, durable liquidity, and sufficient revenue without leaning on a token campaign or relying on users to care about native rails more than convenience.
If the next wave of Bitcoin finance happens on Bitcoin-native infrastructure, Botanix will look early. If it keeps moving through ETFs, wrapped BTC, lending desks, treasury products, and exchange-owned applications, Botanix will look like an honest experiment that discovered where demand actually lives.
MetaMask has opened early access to Agent Wallet, a self-custodial wallet built so AI agents can transact across DeFi while the person funding them keeps control of the rules.
The product, launched on June 8, 2026, is aimed at traders, automators, and builders who want software agents to execute onchain workflows.
MetaMask says those workflows can include swaps, perpetuals, prediction markets, liquidity provision, EVM chains, and Hyperliquid.
The launch marks an early attempt to answer a problem that autonomous finance creates as soon as a model can move from suggestion to execution. A human wallet protects a person at the moment of signing.
An agent wallet has to govern software behavior before the human is present, during a chain of possible actions, and after a transaction has been routed through contracts the user may never inspect directly.
MetaMask’s answer is a wallet with a leash. The agent can act, but the user defines the leash in advance through spend limits, allowlists, operating modes, transaction simulation, threat scanning, MEV protection, and two-factor approval when a transaction is flagged or falls outside policy.
The question is whether that leash makes agentic DeFi materially safer or turns wallet security into a more programmable attack surface.
The Agent Wallet explainer describes a self-custodial wallet for AI agents that connects through a command-line interface and lets users set operating rules before an agent starts transacting.
The user keeps control of the keys, while the agent receives an agent-specific wallet and operates within the policy boundaries the user selects.
Within the server-wallet mode described in MetaMask’s technical docs, the security model has two public operating modes. Guard Mode is the default.
It enforces daily spend or rolling outflow limits, allowlisted protocols and addresses, and human approval through 2FA when a transaction is malicious, outside policy, or requires a limit increase.
Beast Mode is opt-in and gives power users fewer policy interruptions, but MetaMask’s developer documentation says malicious transactions and risky contracts still require 2FA approval.
MetaMask says every Agent Wallet transaction passes through simulation, Blockaid-powered threat scanning, and Smart Transactions MEV protection where supported.
Transactions deemed safe may also be backed by Transaction Protection coverage, although that protection is conditional and subject to eligibility terms.
Control
What it contains
What remains exposed
Spend and outflow limits
Caps how much an agent can move before approval is required.
A badly chosen limit can still be too high for the task.
Protocol and address allowlists
Constrains where the agent can route transactions.
Approved venues can still contain risky contracts, bad routes, or changed conditions.
Simulation and Blockaid scanning
Checks transactions before execution and flags malicious behavior.
Detection quality becomes part of the security boundary.
2FA escalation
Stops flagged or out-of-policy actions until a human approves.
Approval fatigue can turn the human back into the weak link.
Beast Mode
Allows more autonomous execution for advanced users.
Less friction also means more trust is placed in the rule layer.
The structure is useful because it treats autonomy as a permission problem, rather than a binary yes-or-no decision. An agent can be useful when wallet access is limited.
It needs enough authority to complete a defined task while avoiding a signature requirement for every minor step.
The Approval Layer Becomes The Security Boundary
A March analysis of autonomous agents framed the broader issue plainly: as software starts researching, buying, coordinating, and completing tasks with limited supervision, it needs wallets, credentials, budgets, payment systems, and operating rules.
Crypto rails are attractive because they are programmable and always on, but those same traits make the approval boundary critical.
That boundary is already visible in agentic payments. A May analysis of x402 payments showed how low-value machine payments push against manual wallet confirmation.
For sub-dollar API, data, or compute payments, user approval can take more time than the payment itself. For larger DeFi actions, the same approval gate is a safety feature.
Agent Wallet sits directly on that line. It lets an agent spend while defining when the user has already approved enough in advance and when the transaction must come back for review.
The failure mode for an AI wallet can also involve instructions being converted into spend authority.
The Grok-linked Bankrbot incident showed a different path: another system treated public model output as an executable instruction, turning language into spend authority via that instruction path rather than through a private-key compromise.
In that kind of setup, the parser, social trigger, permission layer, and execution policy all become security surfaces.
MetaMask’s model is designed to interrupt some of those paths. If a transaction routes to a non-allowlisted contract, exceeds a limit, touches a flagged address, or is classified as malicious, the agent must pause for approval.
But the strength of that model depends on how specific the user’s rules are and how meaningful the approval moment remains as the agent moves quickly.
The leash can still fail when attackers target the constraints themselves. Prompt or content injection can push an agent toward an unintended action before the wallet sees a transaction.
A malicious contract can appear inside a route that looked acceptable at the instruction layer. A broad allowlist can turn a limited agent into a flexible one.
A high daily outflow limit can make the leash symbolic. A stream of routine approval prompts can train users to tap through the one prompt that counts.
These pressure points can appear before any specific product exploit because the financial authority delegated to software gives attackers more targets than a seed phrase or private key.
Agentic systems need controls matched to their level of autonomy, with governance that evolves as access expands, according to a May Gartner governance warning.
At the highest level of autonomy, the firm said that agents need continuous monitoring, enforced guardrails, rollback mechanisms, circuit breakers, and clear behavioral ownership.
In DeFi, those requirements translate into practical questions about wallets. Can an agent’s rules be scoped tightly enough for a task while keeping the product usable?
Does the 2FA screen show enough transaction detail for a person to reject a dangerous route? Do policy templates keep permissions aligned with intent as routes, markets, or contracts change?
How quickly can a user halt an agent that is behaving inside the letter of the policy but outside the user’s intent?
The risk rises because agents operate at software speed. MetaMask’s explainer says a trading agent can watch markets, respond to prompts, generate routes, and attempt transactions faster than a person at a keyboard.
That speed is the product’s appeal. It is also why the rules must be right before execution begins.
The Next Test Is Defaults
MetaMask is launching Agent Wallet in limited early access. That gives the company a controlled window to learn how real traders and builder-traders set policies when actual funds are on the line.
The sharper signal is how users configure their agents. If early users keep Guard Mode tight, use specific allowlists, set low limits, and reserve Beast Mode for cases they truly understand, Agent Wallet could become a template for safer autonomous DeFi execution.
If users relax rules to avoid friction, the same infrastructure could make wallet risk easier to automate.
The broader agent economy makes that question harder to postpone. Agentic commerce is also becoming an identity and accountability problem.
The World Economic Forum framed it that way in January and cited forecasts for the AI agents market to grow from $5.4 billion in 2024 to $236 billion by 2034.
Those numbers are outside estimates, but the direction is clear enough: more software will be allowed to act on behalf of humans and organizations.
For crypto, the control layer is now moving into the wallet. MetaMask’s early access product leaves the safety question open.
It sets up the decisive test before agent activity scales: whether wallet rules can become strong enough, specific enough, and easy enough to use before attackers learn to program around them.
Solana (SOL) price fell about 17% over the past week, but the real damage sits beneath the chart. Capital left the ecosystem, long-term holders capitulated, and trading activity faded together.
The price drop was the surface. On-chain, three measures show the selloff ran deeper than a routine pullback, and they explain why the bounce off $60, the latest low, still looks fragile.
Capital Actually Left the Solana Ecosystem
The first crack is in total value locked, or TVL. It is the dollar value of assets deposited in a network’s DeFi protocols. Solana’s DeFi-only TVL sits near $4.87 billion (excluding liquid staking), down about 9.55% over the past week and roughly 15% over 30 days.
A falling TVL means users pulled liquidity out of Solana’s apps rather than simply marking existing deposits lower. That points to capital leaving the network, not just prices dropping.
Want more token insights like this? Sign up for Editor Harsh Notariya’s Daily Crypto Newsletter here.
The exit raises a sharper question about who was selling, and the holder data provides the answer.
Even Long-Term Solana Holders Left
The deepest damage shows in the holder’s behavior. Hodler net position change, a metric that tracks whether long-term holders of 155 days or more are adding or reducing supply, fell sharply amid the TVL and price decline.
The figure dropped from about 3.27 million SOL on May 31 to roughly 2.36 million SOL by June 6, as the price slid toward its low. When the most patient holders sell into weakness, it shows conviction broken, not just speculative interest.
That loss of long-term confidence is the clearest sign the selloff was structural, and the trading data confirms it.
Trading Activity and DEX Dominance Both Slid
The cooling shows in volume. Centralized exchange volume for SOL peaked at $7.03 billion on June 6, the height of the selloff, then dropped back as the panic eased, leaving turnover at its lowest since that spike.
Do note that the 7-day rising trend is due to the high volume days on June 5 and June 6.
Solana’s DEX dominance, its share of total decentralized exchange volume across crypto, is also slipping. It sits near 22.6%, below its 60-day average of 23.3% and down from a near-term high of about 30.4% on June 4.
Falling dominance shows the weakness is structural, not just a SOL price move, as capital rotates away from Solana’s on-chain trading.
Together, the three measures explain what really broke during the crash.
The Rebound Looks Fragile Until One On-Chain Level Clears
There is one tentative positive. As Solana price bounced about 13% off its June 6 low near $60, hodler net position change turned higher again. This hints that long-term holders started buying once the price stabilized.
This is not a price prediction, but the on-chain cost basis shows the hurdle ahead. The cost basis distribution heatmap, which maps the prices at which holders actually acquired their SOL, shows a dense cluster of supply near $74 to $75.
Holders who bought there tend to sell when the price returns to their entry, creating resistance.
Until DeFi TVL stabilizes and that supply zone clears, the rebound stays fragile. Whether long-term holders keep buying or fading activity wins out will decide whether Solana’s price builds on its bounce or slips back toward its low.
Solana co-founder Anatoly Yakovenko publicly rejected Senator Bernie Sanders’ AI jobs warning. The senator argues artificial intelligence (AI) and robotics could wipe out millions of American jobs.
Sanders paired the warning with a renewed call to ban super PACs. Yakovenko answered with a string of posts defending markets, profit, and decentralized finance (DeFi).
Sanders’ AI Jobs Warning Meets a Free Market Rebuttal
The Vermont senator said Congress has abandoned workers threatened by automation because of industry money.
Is Congress doing anything to help the millions of workers who could lose their jobs to AI and robotics? No.
They’re intimidated by the hundreds of millions the AI industry is pouring into super PACs.
The spending claim tracks with disclosures. Leading the Future, an AI super PAC network backed by OpenAI president Greg Brockman and Andreessen Horowitz, raised $125 million in late 2025.
The group has pledged at least $100 million for the midterms.
“Senders [Sanders] is focusing on hypothetical sci fi problems because he is completely f’ing useless at solving any real problems,” the Solana co-founder posted in the thread.
Capital, Trillionaires, and the DeFi Defense
Yakovenko widened the argument across more than a dozen replies. Billionaires hold capital rather than hoarded wealth, he argued, and surplus production is what raises living standards.
He also claimed 500 more trillionaires would roughly double the global standard of living, all else equal. Reportedly, his family left the USSR with $50 per person, he shared, casting central planning rather than AI as the real threat to workers.
The thread looped back to crypto. Any profitable market will be rebuilt endlessly as a smart contract, he wrote, months after he gave away code for a perpetuals exchange.
There is no last train. Anything that is generating a profit that can be built as a smart contract will be built, over and over. That’s the whole point of DeFi. Reduce the cost of finance to the cost of software.
Solana (SOL) traded at $65.36 at press time, up nearly 6% in 24 hours. The coming primaries will test whose framing carries more weight with lawmakers.