Ripple’s XRP has delivered a strong recovery from its recent lows, validating the bullish divergence that developed near support. While the broader market structure remains corrective, the latest rally has pushed the price back toward a critical technical inflection point where the next directional move could be determined.
Ripple Price Analysis: The Daily Chart
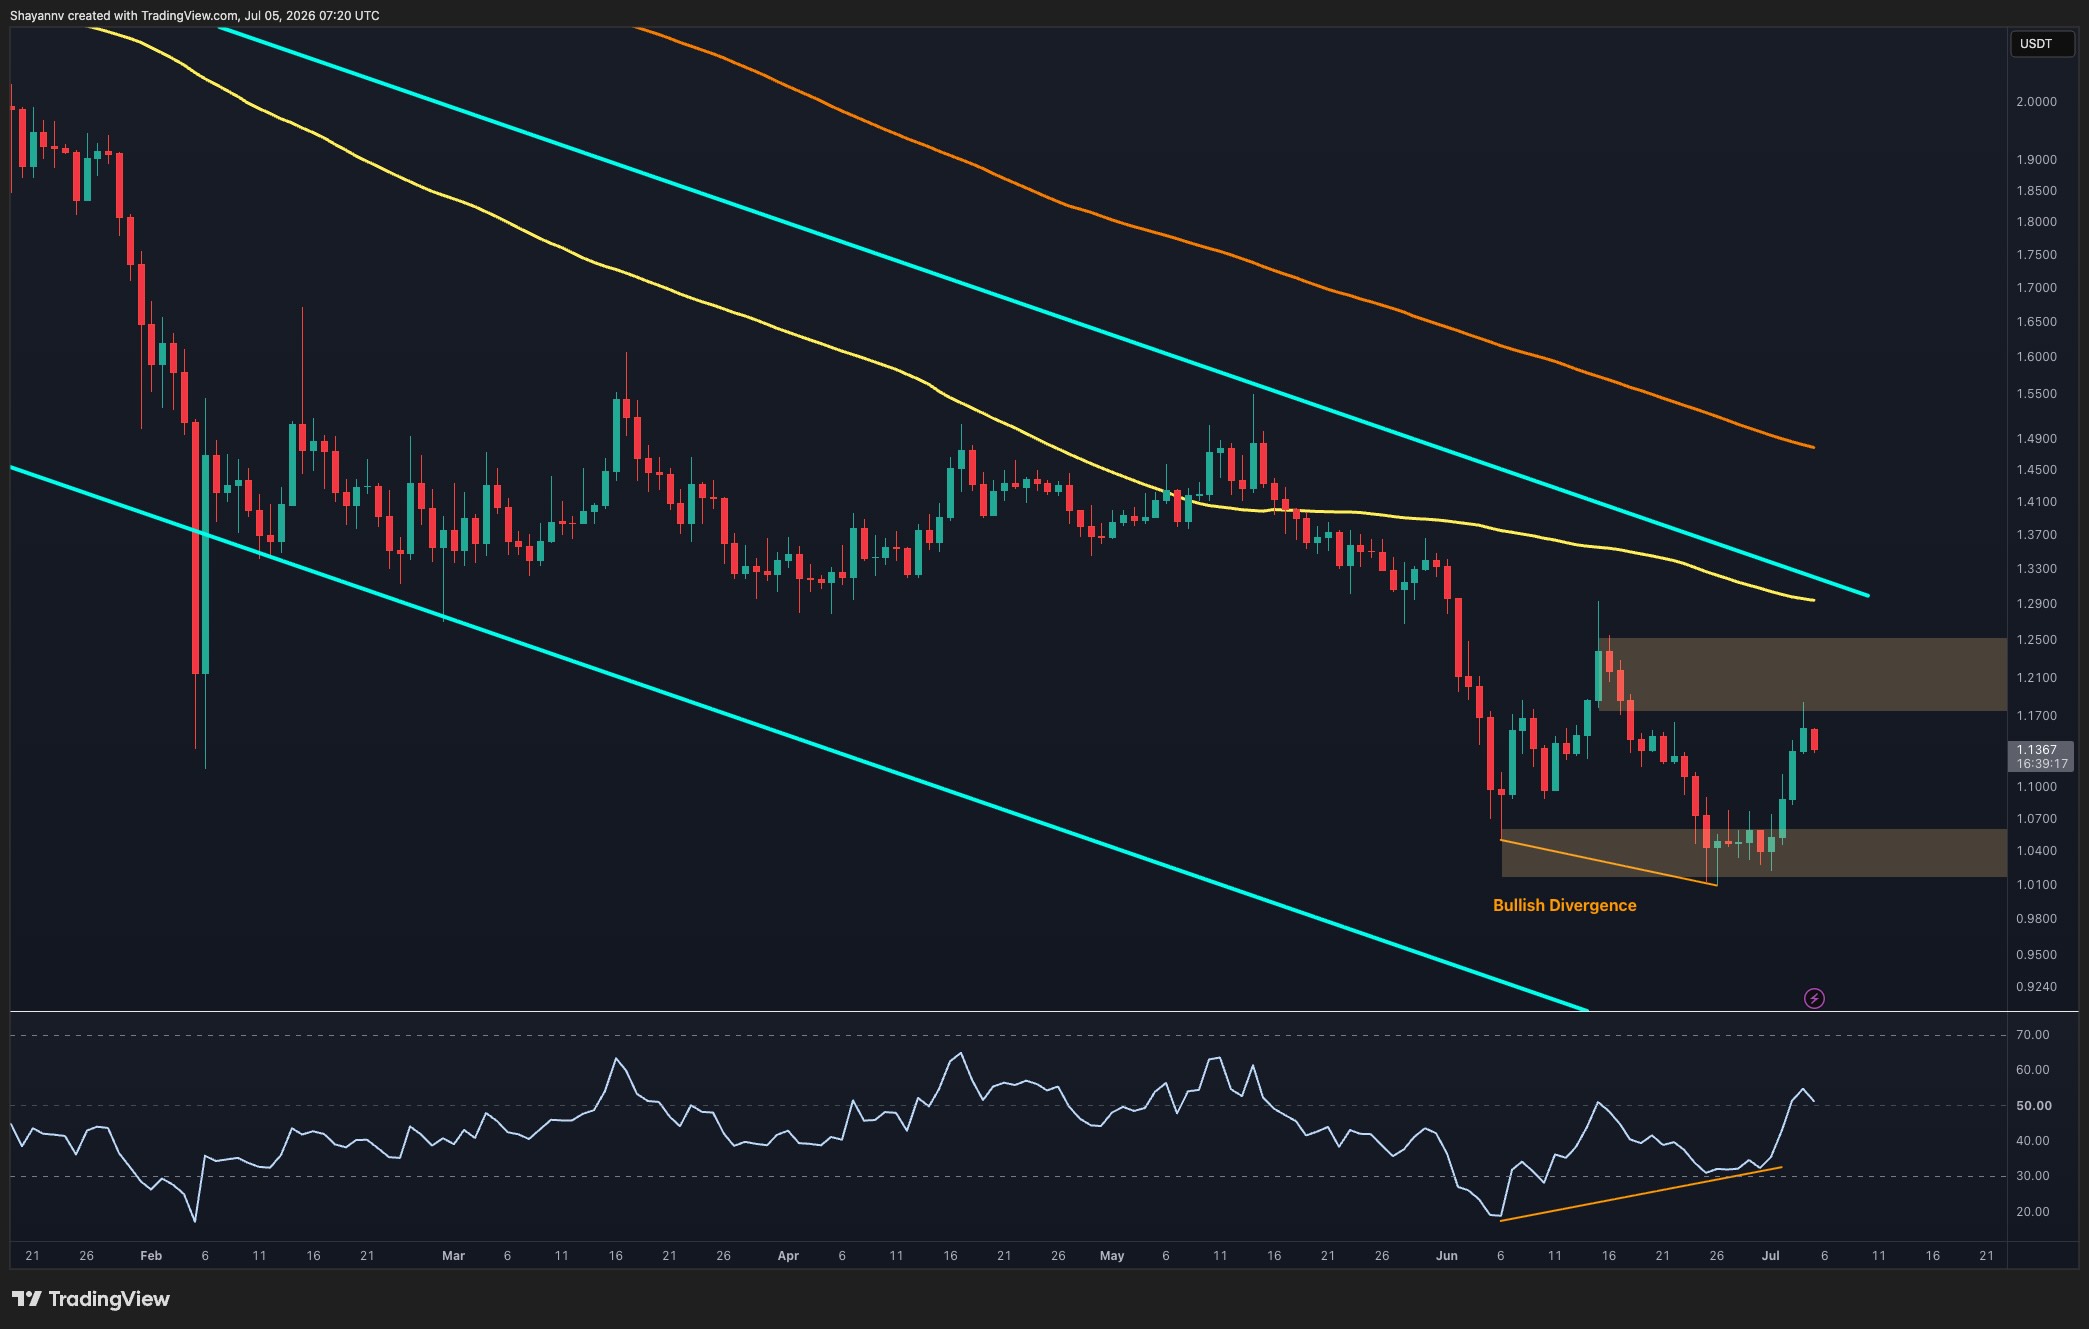
The daily timeframe continues to show XRP trading inside a long-term descending channel, remaining below the major moving averages and the channel’s upper boundary. Despite the broader bearish structure, the recent price action has improved considerably.
The bullish RSI divergence that formed around the $1.02-$1.05 support zone has played out as expected. While the asset was making lower lows, momentum was printing higher lows, signaling weakening selling pressure. Since then, XRP has rebounded sharply and reclaimed the lower support region around $1.02-$1.06.
The recovery has now carried the price toward the first major resistance zone between $1.17 and $1.24. This area previously acted as support before the latest breakdown and is now functioning as supply. The RSI has also pushed back above the midline, confirming improving momentum and strengthening the case for a continued recovery attempt.
However, the broader trend remains bearish as long as the token trades beneath the descending channel resistance and the major moving averages overhead. A successful reclaim of the $1.17-$1.24 region would be the first sign that the market is attempting to build a larger reversal structure.
XRP/USDT 4-Hour Chart
The 4-hour chart provides a clearer view of the recent breakout. XRP spent several days consolidating inside the $1.02-$1.06 demand zone before buyers aggressively stepped in and triggered a sharp rally toward the descending trendline resistance.
The move has already reclaimed the local support area and pushed price directly into the trendline that has capped lower highs since mid-June. XRP is now testing this dynamic resistance as it approaches the lower boundary of the broader $1.21-$1.29 supply zone.
This creates a pivotal setup. A confirmed breakout above the descending trendline would likely open the door for a move into the upper resistance region, where sellers may attempt to regain control. Such a breakout would also confirm a short-term structural shift after weeks of lower highs and lower lows.
On the other hand, failure to break through the trendline could trigger a temporary pullback toward the recently reclaimed support zone. As long as the asset remains above the $1.02-$1.06 area, the current recovery structure remains intact.
For now, momentum favors the bulls in the short term, but the market is approaching a major resistance cluster where a decisive breakout is needed to confirm that the recovery is evolving into something more significant than a relief rally.
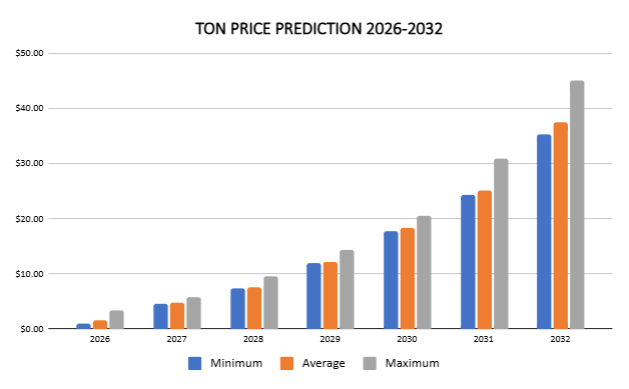
Our GRAM (prev. TON) price prediction anticipates a high of $3.35 in 2026.
In 2028, it will range between $7.26 and $9.49, with an average price of $7.60.
In 2030, it will range between $17.71 and $20.42, with an average price of $18.27.
In June the TON community voted in favor of renaming Gram to Gram, with the ticker changing from GRAM (prev. TON) to GRAM. The change took effect at 12:00 UTC on June 15, 2026. The blockchain itself stays The Open Network. Only the token’s name, ticker, and logo change.
Our GRAM (prev. TON) price prediction expects Gram to reach a high of $3.35 in 2026, move above $10 in 2029, and climb to an average price of $37.37 by 2032. For traders, investors, and crypto enthusiasts tracking Gram, this forecast breaks down what GRAM (prev. TON) is, where its price stands now, how it has performed historically, and what technical analysis and market sentiment suggest for 2026 through 2032.
GRAM (prev. TON) (The Open Network) is a decentralized protocol developed by Telegram for the community. The protocol is a distributed supercomputer, or “super server,” comprising GRAM (prev. TON) Blockchain, GRAM (prev. TON) DNS, GRAM (prev. TON) Storage, and GRAM (prev. TON) Sites. The native token for the GRAM (prev. TON) ecosystem is called Gram (TON).
Gram is the native cryptocurrency of The Open Network and is used for transactions, digital payments, and network-level services, including Telegram Premium and ad purchases.
That Telegram integration gives GRAM (prev. TON) access to more than 900 million monthly active users and supports broader ecosystem growth, which is one reason GRAM (prev. TON) price predictions matter when evaluating future demand. In a volatile crypto market, where market capitalization and sentiment can shift quickly, understanding the factors that influence TON’s value can help readers make more informed investment decisions.
Gram price movements are shaped by supply and demand, and by fundamental factors such as hacks or other market events, which can quickly shift sentiment.
Large holders, or whales, can influence short-term price movements and volatility in the GRAM (formerly TON) market.
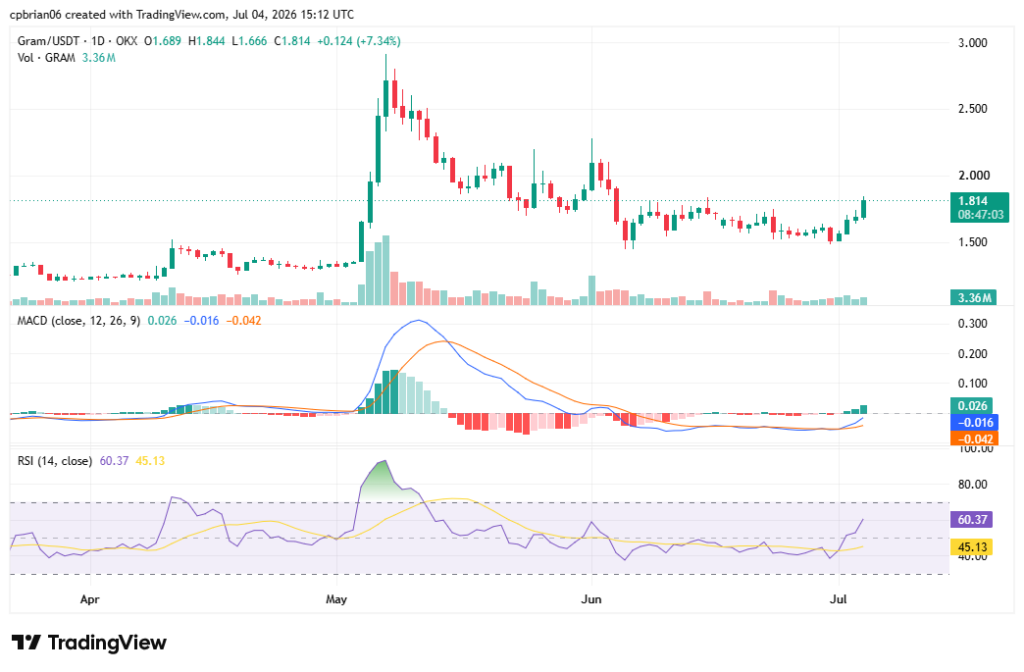
GRAM on July 4, was up 7.87% in 24h and 3.01% in 30 days. Its short-term current forecast is based on technical factors and broader market conditions.
GRAM (prev. TON) turned bullish this week after hitting support levels at $1.50. The correction was accompanied by rising trading volumes.
Each candle shows the opening, closing, highest, and lowest prices for the session. The latest candlestick pattern on candlestick charts suggests an undecided market – short candles.
Traders use this price action view and indicators such as the RSI to gauge momentum. The Relative Strength Index (RSI) is a momentum oscillator: readings above 70 can signal overbought conditions, and below 30 can signal oversold conditions, while the current RSI of 60.37 points to a neutral market.
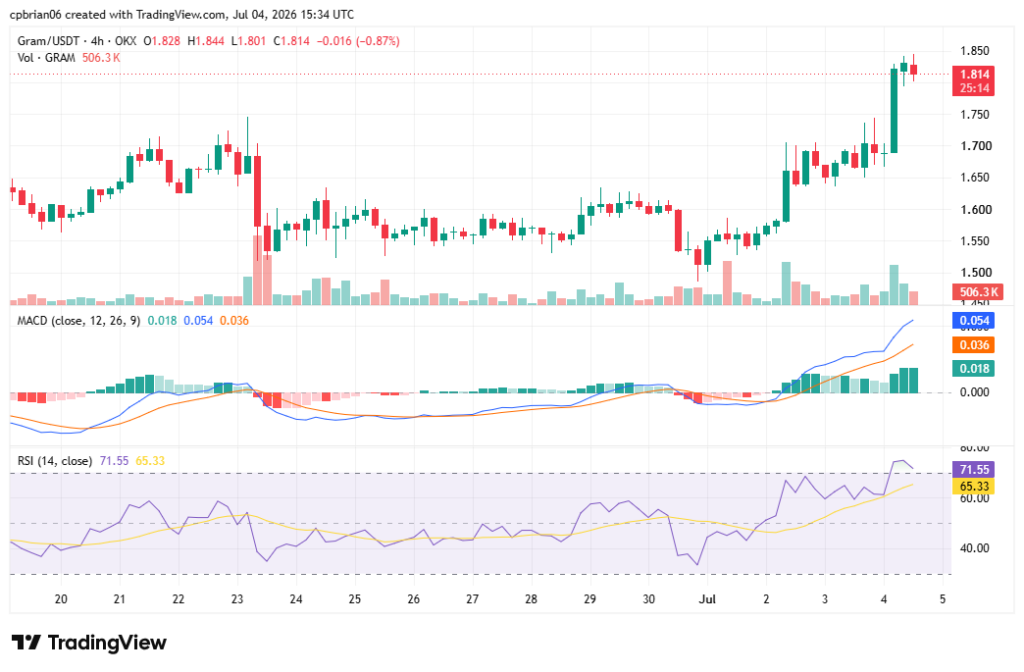
The 4-hour chart shows GRAM (prev. TON) consistently producing long candles this week, with positive market momentum. Many traders watch this timeframe for short-term moves and near-term market trends. Traders are now watching to see whether GRAM (prev. TON) holds above the $1.80 psychological support level, as a drop below $1.70 could restore downward momentum. In the coming days and into next week, direction will likely depend on whether GRAM (prev. TON) can defend that level and reverse from overbought territory. Its RSI is at 71.55.
GRAM (prev. TON) technical indicators: Levels and action
In technical analysis, moving averages use the average closing price over selected periods to help spot support levels and resistance levels.
Daily simple moving average (SMA)
Period
Value ($)
Action
SMA 3
1.63
BUY
SMA 5
1.61
BUY
SMA 10
1.59
BUY
SMA 21
1.62
BUY
SMA 50
1.73
BUY
SMA 100
1.62
BUY
SMA 200
1.54
BUY
Daily exponential moving average (EMA)
Period
Value ($)
Action
EMA 3
1.64
BUY
EMA 5
1.62
BUY
EMA 10
1.61
BUY
EMA 21
1.63
BUY
EMA 50
1.67
BUY
EMA 100
1.65
BUY
EMA 200
1.73
BUY
What to expect from the GRAM (prev. TON) price analysis next?
If GRAM (prev. TON) fails to hold above $1.80, it could retest lower support at $1.70, setting near-term price targets around that zone. The relative strength index remains neutral, and a correction is likely before another run, though the current technical setup does not yet confirm renewed downward momentum. Multiple technical quantitative indicators and moving averages support a neutral GRAM (prev. TON) forecast over the short term.
Is GRAM (prev. TON) a good buy?
According to Cryptopolitan price predictions, GRAM (prev. TON) will trade higher in the years to come. However, both technical analysis and fundamental factors can support or invalidate this bullish case for investors deciding whether to buy Gram. Even so, GRAM (prev. TON) remains highly risky, so readers should conduct thorough research before making any investment decision.
Will GRAM (prev. TON) reach $10?
Yes, GRAM (prev. TON) should rise above $10 in 2029. The move will come as the market recovers to previous highs.
Will GRAM (prev. TON) reach $100?
Per the Cryptopolitan price prediction, GRAM (prev. TON) is unlikely to reach $100 before 2031.
Will GRAM (prev. TON) reach $1,000?
According to the Cryptopolitan price prediction, GRAM (prev. TON) is unlikely to reach $ 1,000 before 2031.
Does Gram have a future?
GRAM (prev. TON) has been on a bullish run since its inception, despite seasonal market corrections. Future growth will depend in part on the development of more decentralized applications, decentralized storage, and mini apps on the GRAM (prev. TON) network within the Telegram ecosystem, where Gram enables smart contracts for various applications and supports real-world utility. Gram also serves as a fee for cross-chain transactions. The GRAM (prev. TON) blockchain has a vibrant community of users and developers, with access to a broad base of Telegram users. Looking ahead, Gram has the potential to trade higher in the coming years.
Recent news
Recent developments include Pavel Durov’s Telegram post alleging that Reliance, an Indian telecom Company, is sabotaging access to Telegram for millions of users outside India, including in the UAE, through a rogue method called BGP hijacking. The sabotage, according to the post, is intentional, as Reliance ignored multiple reports.
GRAM (prev. TON) price prediction July 2026
The GRAM (prev. TON) July price prediction is an expected range of $1.67 to $2.30. It will average at $1.32.
Period
Potential low ($)
Potential average ($)
Potential high ($)
July
1.67
1.32
2.30
GRAM (prev. TON) price prediction 2026
As 2026 unfolds, GRAM (prev. TON) remains bullish, as evidenced by higher price highs. The price will range between $0.97 and $4.35. The average price for the month will be $2.23.
Year
Potential low ($)
Potential average ($)
Potential high ($)
2026
0.97
1.63
3.35
GRAM (prev. TON) price prediction 2027-2032
Year
Potential low ($)
Potential average ($)
Potential high ($)
2027
4.48
4.80
5.71
2028
7.26
7.60
9.49
2029
11.84
12.22
14.29
2030
17.71
18.27
20.42
2031
24.31
25.16
30.81
2032
35.21
37.37
45.12
GRAM (prev. TON) price prediction 2027
The GRAM (prev. TON) token prediction climbs even higher into 2027. According to the prediction, Gram’s price will range from $4.48 to $5.71, with an average of $4.80.
Gram (TON) price prediction 2028
The analysis suggests a further acceleration in TON’s price. GRAM (prev. TON) will trade between $7.26 and $9.49. It will average at $7.60.
GRAM (prev. TON) price prediction 2029
According to the Gram forecast for 2029, the price of GRAM (prev. TON) will range from $11.84 to $14.29, with an average of $12.22.
GRAM (prev. TON) price prediction 2030
The GRAM (prev. TON) price prediction for 2030 is $17.71 to $20.42. The average price of Gram will be $18.27.
GRAM (prev. TON) price prediction 2031
The Gram price forecast for 2031 has a high of $30.81. However, when the market corrects, GRAM (prev. TON) will reach a minimum price of $24.31 and an average of $25.16.
GRAM (prev. TON) price prediction 2032
The year 2032 will experience more bullish momentum. According to the GRAM (prev. TON) price prediction, it will range between $35.21 and $45.12, with an average trading price of $37.37.
Our predictions indicate that GRAM (prev. TON) will reach a high of $3.35 in 2026. In 2028, it will range between $7.26 and $9.49, with an average of $7.60. In 2030, it will range between $17.71 and $20.42, with an average of $18.27. Note that the predictions are not investment advice. Seek independent professional consultation or do your research before making any investment decision. Crypto assets are highly risky, and there may be limited regulatory recourse for losses from such transactions.
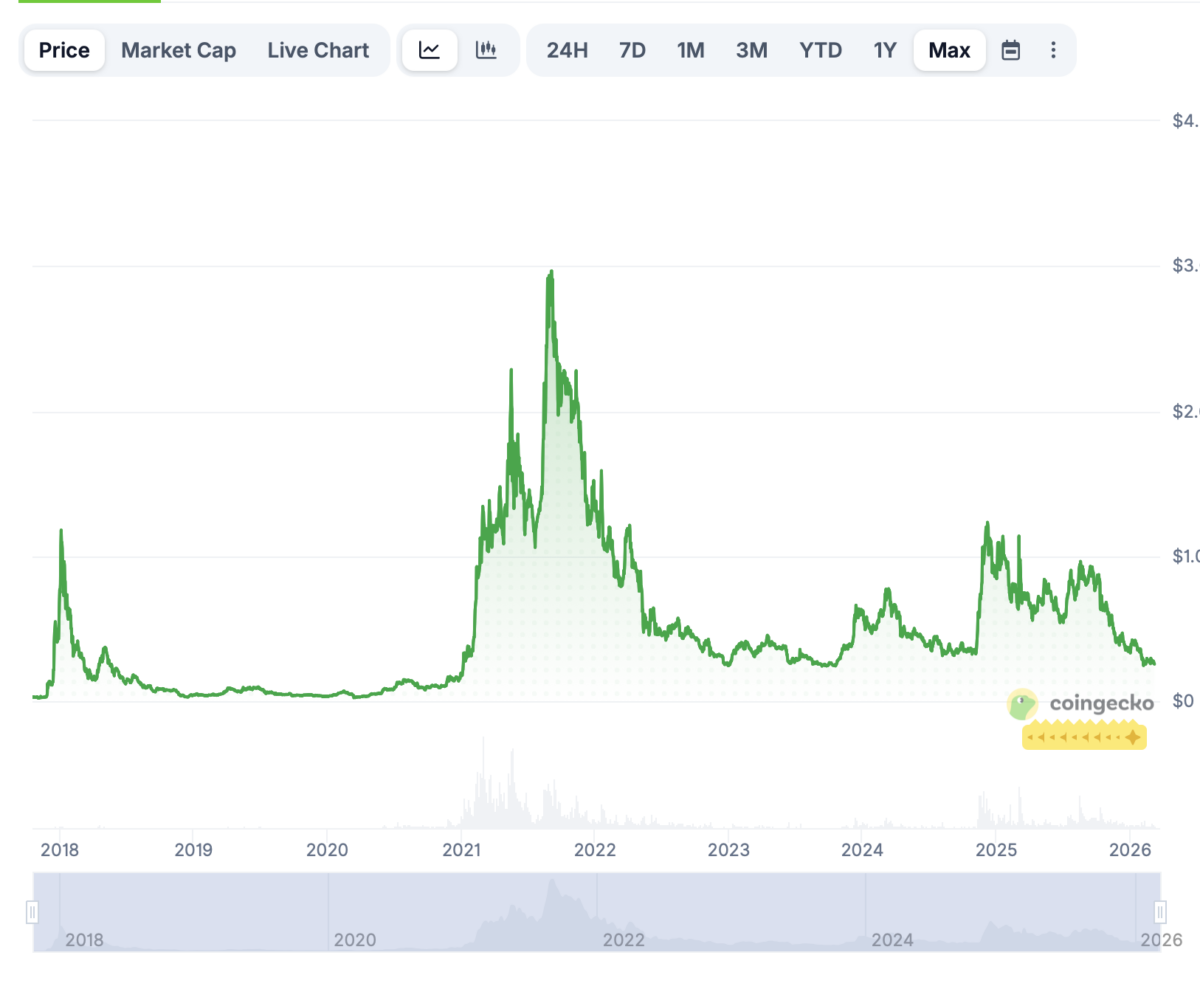
GRAM (prev. TON) is the native cryptocurrency of the GRAM (prev. TON) network, which launched in 2018 as the Telegram Open Network before being renamed and taken over by the GRAM (prev. TON) Foundation. Its ties to the Telegram ecosystem provide access to a large user base.
In June 2020, all Gram tokens (98.55% of the total supply) became available for mining, further widening access to that user base.
The tokens were placed in special Giver smart contracts, enabling anyone to mine until 28 June 2022. Users mined around 200,000 GRAM (prev. TON) daily.
All the tokens were mined in two years, marking the completion of the distribution event.
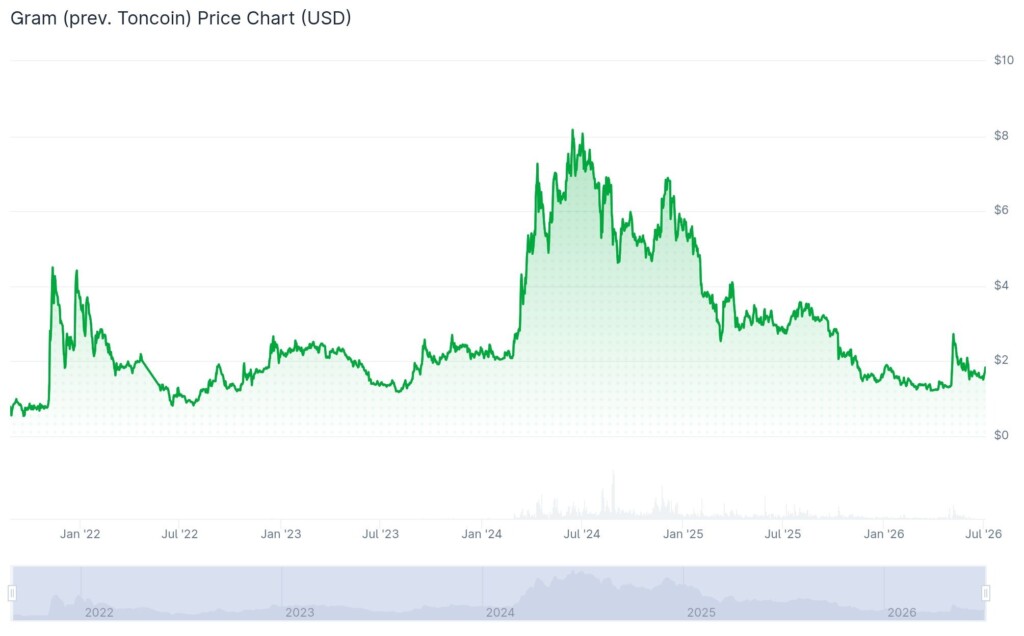
On September 20, 2021, GRAM (prev. TON) reached its all-time low of $0.3906.
Its first significant break came in November 2021. Over the past few days, the coin has slid from $0.8 to $4.5.
It corrected in 2022, reaching a low of $0.9.
In 2023, it ranged between $1.1 and $2.5.
In 2024, it registered another bull run, rising from $2.11 to its all-time high of $8.24 on Jun 15, 2024.
It corrected later, trading at $ 5.20 in October and $4.98 in November, when it began to recover.
The recovery saw the coin rise above $6.5 in December.
It then crossed into 2025, trading at $5.5. From there, it entered a bear market, falling below $3.8 in February and $3.0 in May. It crossed into June at $3.20 and maintained that level into August. In October, it fell to $3.00, and in November to $2.50.
In December, it traded at $1.60 and rose above $1.80 in January 2026. The trend reversed in February, falling below $1.40. In May, at $1.35. In June, it crossed above $1.50, and in July, it crossed above $1.80.
Solana memecoin trading platform Pump.fun has removed agent mode for new token launches, following community requests.
Pump.fun announced the decision on Tuesday, saying the Tokenized Agent launch option is deprecated, effective immediately. Co-founder Alon Cohen said it’s the first step to “removing launch options that don’t add enough value to users.”
Last month I promised that we would start removing launch options that don’t add enough value to users.
Today, we began this process, and are continuing to take big steps towards a healthier ecosystem. 🧵 https://t.co/OnKOH3LRU9
Cohen said the Tokenized Agents feature was introduced with the intention of bootstrapping on-chain agents with automated buyback and burn mechanics. However, it resulted in excessive griefing, confusion among traders, and “needless PVP.”
“Coins PVPing each other because of launch modes benefits no one. It slows down momentum for narratives and pushes people away from our ecosystem,” Cohen wrote on X.
The change applies to new token launches, according to Pump.fun. Existing coins that already enabled the agent mode feature will remain unaffected.
Cohen did say Pump.fun is still “super bullish” on the Tokenized Agents sector, adding there is a possibility the feature returns, but not as a launch option.
Community cites rare “W”
The Pump.fun community seems well receptive of the decision. Most of the reactions agree that removing the agent mode was a much-needed move.
Meanwhile, the news comes as Pump.fun activity heats up again, with the launch of a new token dubbed $ANSEM. The memecoin made the rounds on X after surging by 8500% over the last two days, reaching a $172M market cap.
The token is named after the popular Solana memecoin influencer Ansem, who reportedly holds 604M $ANSEM, representing more than 60% of the supply.
On Monday, Ansem had airdropped $6.7M in $ANSEM to 700+ wallets, with most of the recipients still holding their tokens.
UPDATE: 60% are STILL holding their $ANSEM airdrop
Some traders argue that Pump.fun’s decision to deprecate the agent mode is only coming due to Ansem’s influence.
Another Pump.fun feature goes badly
Pump.fun has had to deal with extreme cases where its features are used for unintended reasons.
Cryptopolitan once reported that live streamers on Pump.fun staged a fake private jet crash to lure viewers and pique their interest in their memecoin. Following a series of similar stunts, Pump.fun eventually removed the live-streaming feature.
Earlier in June, Pump.fun launched a “Pay ANYONE to do ANYTHING” bounty marketplace called Pump Fun GO. Just a few hours after launch, a user posted a bounty worth 10,000 SOL (roughly $690,000) referencing suicide, Cryptopolitan reported.
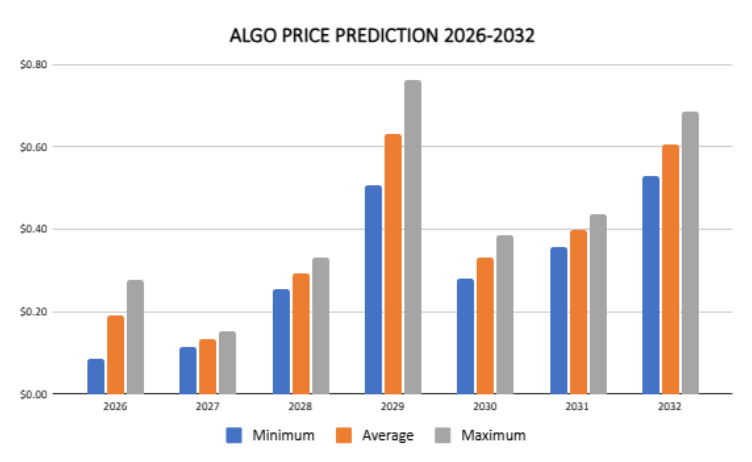
Our Algorand price prediction indicates a high of $0.24 in 2026.
In 2028, ALGO will range between $0.2559 and $0.3324, with an average price of $0.2942.
In 2030, it will range between $0.2792 and $0.3856, with an average price of $0.3324.
Algorand’s capabilities make it an attractive prospect for investors and developers focused on smart contracts and blockchain interoperability.
Will ALGO go up? Can it reach $10? Where will ALGO be in 5 years? We explore these and more in our Cryptopolitan price prediction.
Overview
Cryptocurrency
Algorand
Symbol
ALGO
Current price
$0.08944
Market cap
$798.45M
Trading volume
$31.16M
Circulating supply
8.92B
All-time high
$3.28 on Jun 21, 2019
All-time low
$0.08 on Mar 30, 2026
24-hour high
$0.09307
24-hour low
$0.08907
Algorand price prediction: Technical analysis
Indicator
Value
Volatility (30-day variation)
11.86% (Very High)
50-day SMA
$0.1073
200-day SMA
$0.1062
RSI
38.63 (Neutral)
Sentiment
Bearish
Green days
12/30 (40%)
Fear and Greed Index
20 (Extreme Fear)
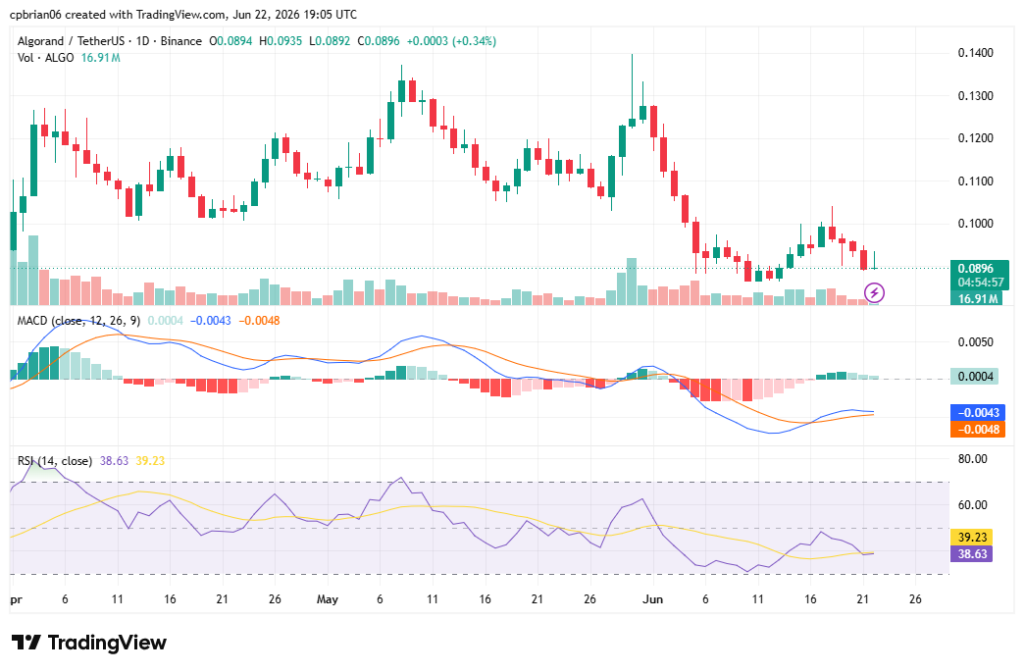
Algorand price analysis
Recent price movements remain tied to broader crypto correlations, so moves in major altcoins can influence ALGO’s direction. On June 22, ALGO was red, down 1.82% in 24 hours and 21.12% in 30 days. Its trading volume rose by 58.40% to $31 million, signaling high conviction in the market trend.
Current models also diverge from market expectations, with technical analysis leaning bearish to neutral while some broader market forecasts remain more optimistic.
ALGO started recovering this year but later turned bearish after failing to break through the $0.1420 resistance level. In the first week of April, it made a big break, with an over 40% rise in value. The recovery was quickly followed by a reversal as it was heavily overbought. It is now trading at sub-$0.10 levels, with support at $0.08.
The MACD histogram shows waning positive momentum. Traders watch RSI and Fibonacci retracement levels on the daily chart to assess price action. The RSI is neutral at 38.63, with the Fibonacci Trendlines putting the next resistance at $0.1014.
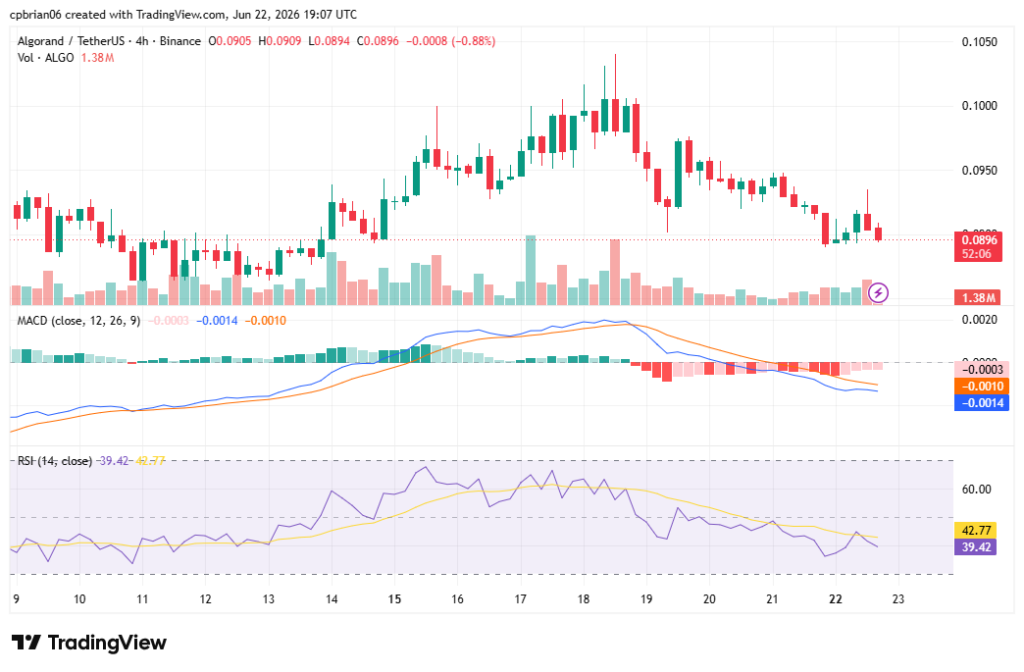
On the 4‑hour chart, ALGO’s decline stands out. The reversal is pushing ALGO below most moving averages on the selected time frame. The red MACD histogram signals negative momentum, while the RSI is neutral at 39.42. Direction in the coming days will depend on whether bulls reclaim short-term momentum.
Algorand technical indicators: Levels and action
Daily simple moving average (SMA)
Period
Value ($)
Action
SMA 3
0.09170
SELL
SMA 5
0.09366
SELL
SMA 10
0.09230
SELL
SMA 21
0.09471
SELL
SMA 50
0.1073
SELL
SMA 100
0.1040
SELL
SMA 200
0.1062
SELL
Daily exponential moving average (EMA)
Period
Value ($)
Action
EMA 3
0.09105
SELL
EMA 5
0.09197
SELL
EMA 10
0.09282
SELL
EMA 21
0.09604
SELL
EMA 50
0.1017
SELL
EMA 100
0.1049
SELL
EMA 200
0.1177
SELL
What to expect from the ALGO price prediction next?
ALGO is falling and in neutral territory on the shorter timeframes. Rising trading volumes are a sign of strong conviction in the market trend. Some models see ALGO at about $0.1018 by the end of 2026 and, in a weaker scenario, a further decrease to $0.06947 by 2027 before stronger momentum is anticipated to build later.
Why is ALGO down?
Algorand’s ~2% gain closely mirrored moves in Bitcoin (-1.94%) and the total crypto market cap (-1.96%), indicating a strong beta component to its performance.
Will ALGO reach $1?
Per our Algorand price forecast, ALGO will break above $1 by the end of 2032.
Can Algorand reach $10?
Per our Cryptopolitan price prediction, ALGO will not break above $10 by the end of 2032.
Can Algorand reach $20?
According to our Cryptopolitan price prediction, it remains improbable for ALGO to break above $20 by the end of 2032.
Can ALGO reach 100 dollars?
At $100, Algorand’s market capitalization must rise above $700 billion from its current $1.2 billion. In comparison, Ethereum’s market capitalization is at $380 billion. Per our price prediction, Algorand is highly unlikely to reach $100.
Is there a future for Algorand?
Like most mega-altcoins, Algorand is trading at its lowest level this year. The Algorand blockchain uses pure proof-of-stake, which helps deliver security, scalability, and decentralization without forking. Its long-term outlook also depends on upgrades that improve smart-contract execution and expand support for institutional finance and real-world assets. A break below 30 on the RSI will be crucial to sending it back to previous highs. Looking ahead, ALGO will register new all-time highs in the coming years.
Is ALGO a good investment?
Analysis by Intotheblock shows that over 80% of holders are in the red at the current price. The figure will likely drop lower in the short term. However, as our Cryptopolitan price prediction shows, this can still change over the long term, though Algorand’s DeFi liquidity remains thinner than on larger Layer-1 rivals and may weigh on valuation. It still has institutional utility through real-world asset tokenization and CBDC research, which matters when weighing long-term investment decisions. The Algorand Foundation’s renewed focus on attracting US-based institutional liquidity and regulatory-compliant RWA initiatives also supports the longer-term case.
Recent news
Algorand is among the Agent Payments Protocols supported by Google. Despite price weakness, the ecosystem showed resilience amid broader market volatility, reaching an all-time high in developer activity in late 2025, driven by seamless Python integration and other developer tools that lowered barriers for traditional developers. This reinforced a narrative of institutional-grade reliability and AI potential.
ALGO price prediction June 2026
The Algorand network price forecast for June is a maximum price of $0.1210 and a minimum price of $0.0820. The average price for the month will be $0.1099. For tomorrow and next week, these remain short-horizon estimates within the broader June range. In the coming days, traders will watch whether June price action can hold near the monthly average.
Month
Potential low ($)
Potential average ($)
Potential high ($)
June
0.0820
0.1099
0.1210
Algorand price prediction 2026
For 2026, ALGO’s price will range between $0.0815 and $0.2365. The average price for the period will be $0.1896. That outlook could improve later in the year if the early-2026 liquidity coil unwinds, as US money market funds are expected to rotate into higher-yield digital assets as yields compress.
Year
Potential low ($)
Potential average ($)
Potential high ($)
2026
0.0815
0.1896
0.2365
Algorand price prediction 2027-2032
Year
Minimum price
Average price
Maximum price
2026
0.0845
0.1896
0.2765
2027
0.114
0.1325
0.1511
2028
0.2559
0.2942
0.3324
2029
0.5082
0.6325
0.7623
2030
0.2792
0.3324
0.3856
2031
0.3581
0.3979
0.4376
2032
0.5278
0.6067
0.6855
Some technical analysis models place the 2027 cost in a lower $0.08364-$0.1131 band, implying a slight -0.20% decrease.
Long-range Algorand cost targets also vary widely, with some 2030 models ranging from $0.14 to $2.10 depending on economic conditions.
Other forecasts place 2030 closer to $0.55-$0.81 if ecosystem progress continues and market conditions remain supportive.
Algorand price prediction 2027
Algorand market price prediction climbs even higher into 2027. According to the prediction, Algo’s price will range from $0.1140 to $0.1511, with an average of $0.1325.
Algorand coin price prediction 2028
Our analysis indicates a further acceleration in Algo’s price. It will trade between $0.2559 and $0.3324 and an average price of $0.2942.
Algorand price prediction 2029
According to the 2029 Algorand forecast, the price of Algo will range from $0.5082 to $0.7623, with an average of $0.6325.
Algo price prediction 2030
The Algo price prediction for 2030 is $0.2792-$0.3856, with an average of $0.3324.
Algorand price prediction 2031
The Algorand price forecast for 2031 is a high of $0.4376. It will reach a minimum price of $0.3581 and an average price of $0.3979.
Algorand Algo price prediction 2032
The year 2032 will also be bullish. Our analysis estimates a price range of $0.5278 to $0.6855, with an average price of $0.6067.
These forecasts differ because analysts weigh technical factors and macro assumptions differently.
Cryptopolitan Algorand price prediction
Our predictions indicate that ALGO will achieve a high of $0.24 in 2026. In 2028, it will range between $0.26 and $0.33, with an average of $0.29. In 2030, it will range from $0.28 to $ 0.39, with an average price of $0.33. Note that these predictions are not investment advice and should not replace your own research or other advice from an independent professional; form a plan before you buy Algorand.
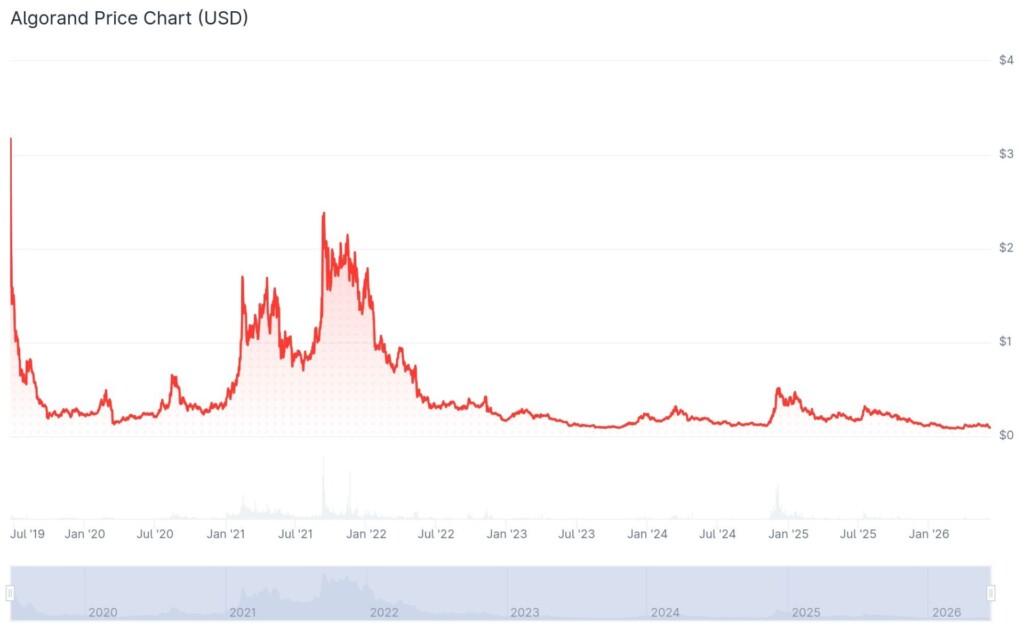
Algorand conducted its token sale in June 2019 at $2.40 per token.
Union Square Ventures, Lemniscap, and NGC Ventures, among others, held earlier funding rounds. The public sale raised $60.40 million, while funding rounds raised $66 million.
Token sale participants who held their tokens since launch are down 90%.
Binance listed ALGO on 21 June 2019. According to CoinMarketCap data, it pumped after its listing, reaching an all-time high (ATH) of $3.28.
ALGO later crashed; four months later, it was down 90% from its ATH.
In July 2021, Coinbase listed the ALGO token. As a result, it gradually recovered, peaking at $0.64 in August.
In retrospect, 2021 was the golden year for the crypto market. The emergence of NFTs, DeFi growth, and institutional interest drove growth.
In 2021, it rose from a low of $0.32 in January to $2.30 in October, a 200% gain.
Nothing prepared crypto enthusiasts for the 2023 crypto winter, which worsened with the FTX crash. The year closed with ALGO trading at $0.23.
The decline continued through 2023, registering an all-time low at $0.0876 in September.
The market’s recovery began in October. By the end of the year, it had risen above $0.2.
It began recovering in November from a low of $0.12, reaching $0.61 in December.
It then corrected into 2025 below the $0.40 mark in January and $0.35 in February. It crossed into October, trading at $0.22.
The coin nosedived to $0.14 by December and held that level through January 2026. Momentum then turned bearish, with prices sliding below $0.10 in March. By May, however, it staged a modest recovery to $0.13. In June, it retreated below $0.10.
Alongside these price cycles, the chain’s longer-term story increasingly centers on institutional utility, including real-world asset tokenization and Central Bank Digital Currency (CBDC) research.
Ongoing protocol upgrades to smart-contract execution also remain part of Algorand’s competitive positioning.
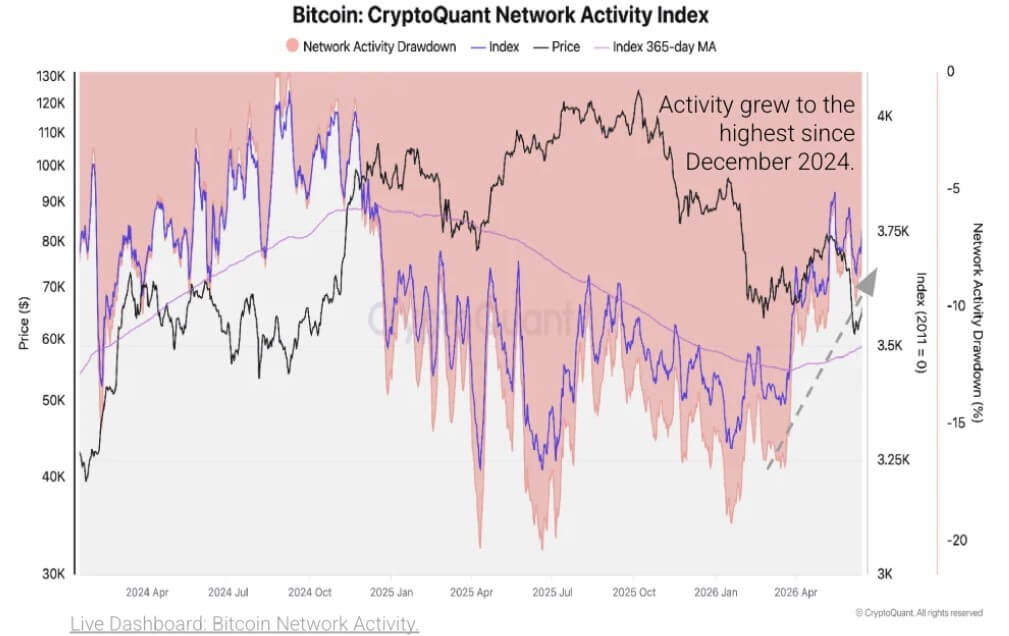
Bitcoin’s blockchain is showing its strongest activity since late 2024, creating a rare split between rising network use and a weakening market price.
CryptoQuant said in a note shared with CryptoSlate that its Bitcoin Network Activity Index has moved above its long-term trend for the first time since mid-2024.
The index has climbed steadily since January and recently reached its highest level since late 2024, leaving it only about 7% below the record reached in September 2024.
Bitcoin Network Activity (Source: CryptoQuant)
The shift began in late March and has held for several weeks, suggesting that the rebound in activity is more than a one-day spike.
Meanwhile, the rise in network activity comes as the Bitcoin price remains under significant selling pressure.
The largest cryptocurrency has fallen about 30% this year to below $65,000, according to CryptoSlate data, extending a slide of more than 50% from its late-2025 record near $126,000 as months of selling pressure and weaker risk appetite weigh on the market.
Small transfers drive the rebound
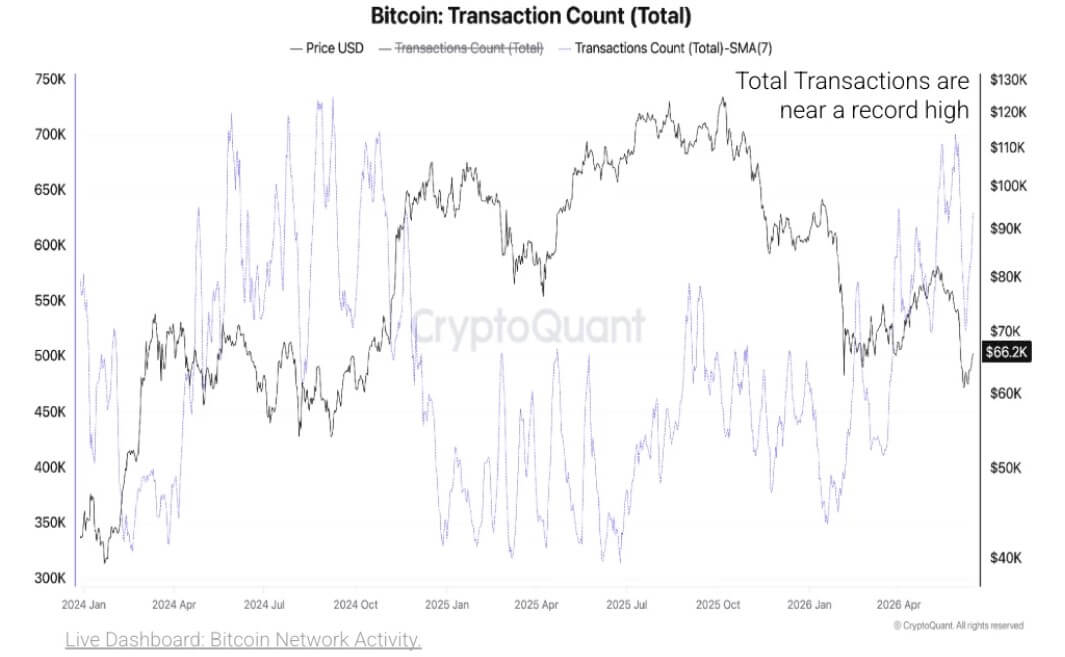
The network rebound is being driven mainly by transaction counts rather than large-value settlement.
CryptoQuant data shows total daily Bitcoin transactions rising above 800,000 at points in 2026, near the strongest readings of the 2023-2025 cycle and more than double the lows seen in 2025. Average transactions per block have also climbed, showing sustained block use from a transaction-count perspective.
The composition of that activity is the more important part of the story.
Transactions worth less than 0.01 BTC now account for about 80% of daily Bitcoin transaction counts, CryptoQuant said. That is up from roughly 44% in 2023.
Bitcoin Total Transactions (Source: CryptoQuant)
The smallest cohorts, including transactions below 0.001 BTC and below 0.01 BTC, have surged this year and are approaching the previous peak reached in 2024.
That means Bitcoin’s network is busier, but much of the growth is coming from very small transfers. In market terms, the blockchain is processing more messages, but not necessarily moving proportionally more economic value.
The pattern resembles prior bursts of protocol-driven activity on Bitcoin, when token experiments, inscriptions, and data services increased transaction counts without matching the value profile of traditional BTC transfers.
OP_RETURN use points to data-heavy demand
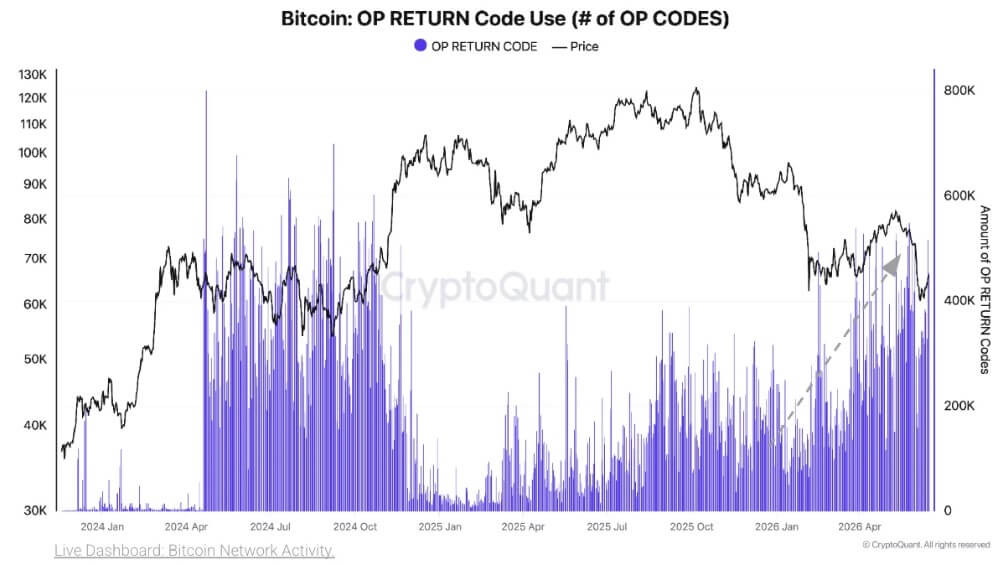
The rise in small transfers has coincided with a sharp increase in OP_RETURN usage.
OP_RETURN is used to attach data to Bitcoin transactions without creating spendable outputs. That has made it a common tool for data-layer activity on Bitcoin, including token-related transfers, timestamping, and inscription-adjacent use cases.
CryptoQuant said OP_RETURN outputs have climbed to near-record levels this year, with the increase linked to activity from Runes, Ordinals, BRC-20-style markets, and other data-writing services.
Bitcoin OP_RETURN Code Use (Source: CryptoQuant)
These systems can generate large numbers of low-value transactions because the economic payload is often the data attached to the transaction rather than the amount of BTC being transferred.
That helps explain why the network activity index is rising while the price remains weak. The new activity reflects demand for Bitcoin block space, but it is not the same thing as a broad recovery in investor appetite for BTC.
It also complicates the long-running debate over Bitcoin’s use case. Supporters may view the surge as evidence that Bitcoin is becoming a more active settlement layer for new types of on-chain activity.
However, critics may see it as congestion from transactions that do little to support Bitcoin’s monetary role.
For now, the data supports both readings to some degree. Bitcoin is being used more. But the use is concentrated in small transactions that differ from the financial transfers many investors associate with durable network demand.
Mempool congestion returns, but fees stay low
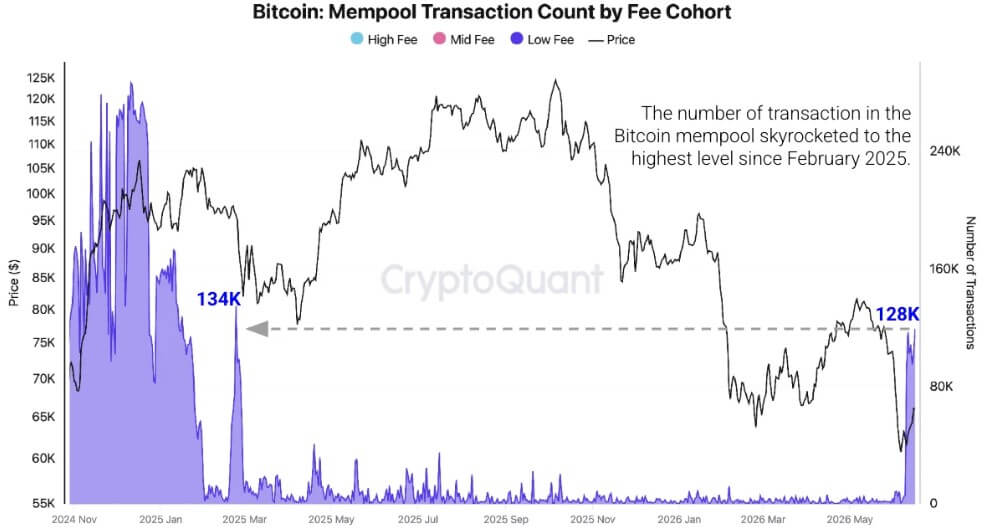
The jump in micro-transactions has started to affect the mempool, where unconfirmed Bitcoin transactions wait before being added to blocks.
CryptoQuant said the Bitcoin mempool transaction count has risen to about 128,000, the highest since late February 2025. The congestion is concentrated in low-fee transactions, consistent with the increase in OP_RETURN and micro-transaction activity.
The current backlog remains well below the extreme peaks seen in September 2023 and November 2024. Still, the increase shows that non-financial or low-value activity is taking up a larger share of Bitcoin transaction flow.
That could become more important if the trend continues. Higher competition for block space can push up fees, especially for users who need time-sensitive settlement.
In past cycles, congestion from inscriptions and token-related activity created brief periods of elevated fees and renewed debate over whether Bitcoin’s block space should be used primarily for monetary transfers or broader data applications.
So far, the latest activity burst has not produced a comparable fee boom.
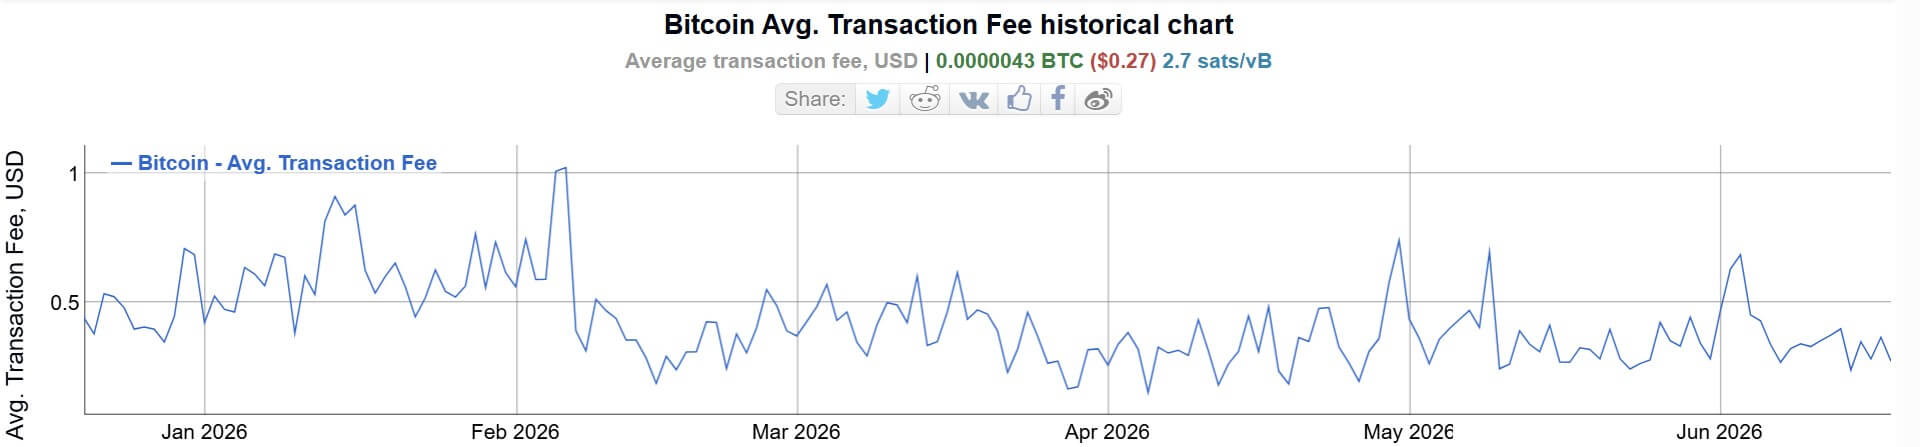
YCharts data, based on Blockchain.com figures, showed daily Bitcoin transaction fees at 3.458 BTC on June 18, down 50.25% from a year earlier.
Bitcoin Average Network Fees (Source: BitInfoCharts)
That gap is central to the current story. Transaction counts are rising, but the fee market has not followed with the same force.
Miner revenue remains the weak link
The muted fee response matters because Bitcoin miners have relied more heavily on transaction fees since the April 2024 halving cut the block subsidy to 3.125 BTC.
At roughly 144 blocks a day, the subsidy remains the main source of miner revenue. Fees contribute only a small share in BTC terms when network costs are low, limiting the direct financial benefit miners receive from higher transaction counts.
That makes the current activity surge less straightforward than prior periods when congestion produced large fee spikes. More transactions can signal stronger demand for block space, but if those transactions are low-value and low-fee, the impact on miner economics remains limited.
The result is a mixed signal for the Bitcoin market.
On one hand, the blockchain is seeing its strongest activity in nearly two years, driven by real demand for small transactions and data-linked use cases.
On the other hand, Bitcoin’s price remains under pressure, sellers still dominate the short-term market structure, and the fee market has not shown that users are willing to pay significantly more for settlement.
That leaves Bitcoin with a busy network but an unresolved market question: whether this new wave of activity can become durable economic demand, or whether it remains another burst of low-value traffic that fills blocks without changing the broader investment picture.
Cardano’s price is expected to surpass $1.33 in 2026.
By 2029, ADAUSD could reach $4.72.
By 2032, Cardano might reach a maximum price of $4.46.
Cardano is a third-generation blockchain platform launched in 2017 by Ethereum co-founder Charles Hoskinson. Designed for decentralized applications and smart contracts, it uses Ouroboros—a unique, energy-efficient Proof-of-Stake consensus mechanism.
Cardano’s two-layer architecture separates transactions from smart contracts, enhancing scalability and flexibility. Its native cryptocurrency, ADA, is used for transaction fees, staking, and governance, allowing holders to influence the platform’s future. Emphasizing a research-driven, peer-reviewed development approach, Cardano aims to address challenges in blockchain, such as scalability and sustainability, making it a strong alternative to platforms like Ethereum.
Perhaps you’re wondering: with its innovative technology, can Cardano’s ADA reach new all-time highs soon?
Let’s uncover what the future holds for Cardano.
Overview
Cryptocurrency
Cardano
Token
ADA
Price
$0.1671
Market Cap
$6.08B
Trading Volume (24-hour)
$289.31B
Circulating Supply
44.99B ADA
All-time High
$3.10 on Sept 02, 2021
All-time Low
$0.01735 on Oct 01, 2017
24-hour High
$0.1737
24-hour Low
$0.1659
Cardano price prediction: Technical analysis
Metric
Value
Volatility (30-day Variation)
16.86% (Very High)
50-day SMA
$ 0.2337
14-Day RSI
30.44 (Neutral)
Market Sentiment
Bearish
Fear & Greed Index
18 (Extreme Fear)
Green Days
9/30 (30%)
200-day SMA
$ 0.2977
Cardano (ADA) price analysis
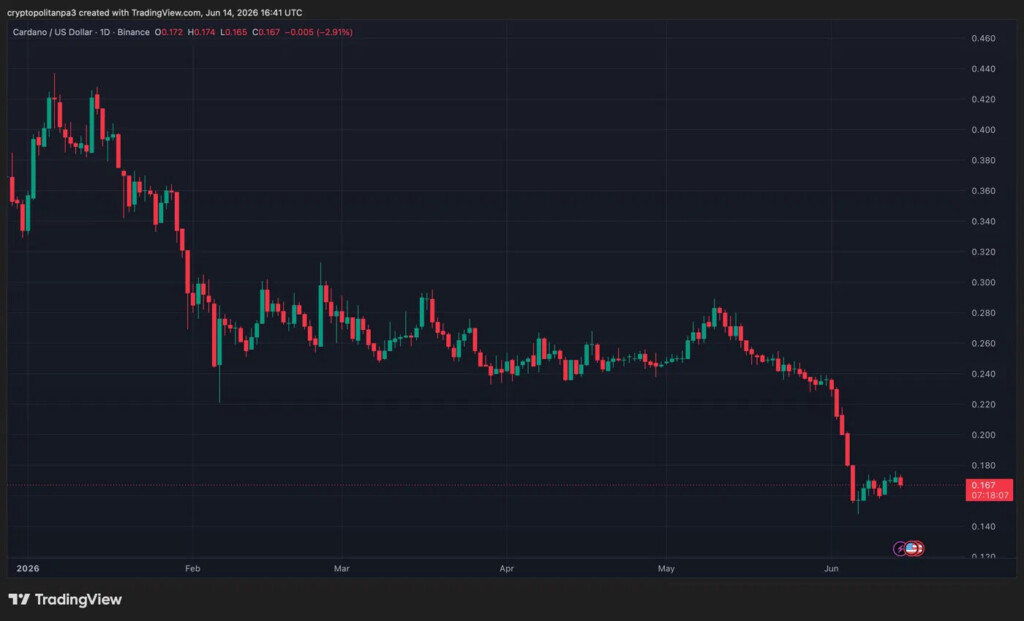
Cardano is down 2.91% at $0.167, hitting fresh 2026 lows with sellers firmly in control across all timeframes.
Price briefly touched $0.145 before a weak bounce, now consolidating between $0.165 and $0.175 with little buying conviction.
Bulls need a reclaim of $0.180 to signal relief; failure risks a drop toward $0.140.
Cardano price analysis 1-day chart: Cardano slides to $0.167 as bears push ADA to fresh 2026 lows
Cardano is trading at $0.167, down 2.91% on the day, hitting fresh 2026 lows after a devastating June sell-off from the $0.240 range. The 1D structure is deeply bearish, with price breaking below the $0.175 horizontal support — a level that had previously acted as a floor — signaling accelerated selling pressure.
The overall trend shows a prolonged downtrend from January’s $0.440 peak, with no meaningful recovery attempts. Today’s candle confirms sellers remain in complete control. Immediate support is thin, with $0.150 as the next major level to watch. A reclaim of $0.180 is needed before any bullish case can be considered.
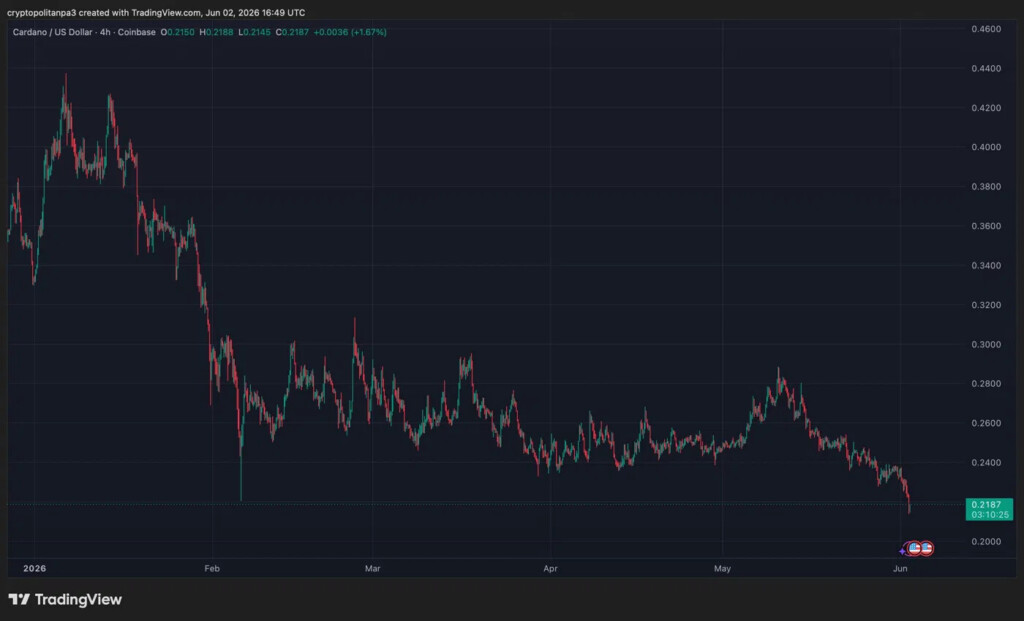
ADA price analysis 4-hour chart: Cardano consolidates at $0.167 as the 4-hour chart signals a fragile recovery attempt
ADA’s 4H chart shows price at $0.167, completely flat at 0.00%, consolidating after an aggressive June sell-off that briefly pushed price to $0.145 lows. The 4H structure reveals a steep descending channel throughout May and June, with no meaningful counter-rally until the recent bounce from all-time 2026 lows.
Price is now attempting to stabilize around the $0.165–$0.175 range, but the recovery lacks momentum. The $0.180 horizontal level remains a key resistance barrier from prior support. A 4H close above this level is needed to signal short-term relief. Below $0.155, selling pressure could intensify toward $0.140 — uncharted 2026 territory.
ADA technical indicators: Levels and action
Daily simple moving average (SMA)
Period
Value
Action
SMA 3
$0.2340
BUY
SMA 5
$0.2340
SELL
SMA 10
$0.2380
SELL
SMA 21
$0.2477
SELL
SMA 50
$0.2519
SELL
SMA 100
$ 0.2569
SELL
SMA 200
$0.3143
SELL
Daily exponential moving average (EMA)
Period
Value
Action
EMA 3
$0.2331
BUY
EMA 5
$0.2345
SELL
EMA 10
$
SELL
EMA 21
$ 0.2544
SELL
EMA 50
$ 0.2574
SELL
EMA 100
$ 0.2780
SELL
EMA 200
$ 0.3483
SELL
What to expect from the Cardano price analysis next?
Following the 1D and 4H breakdowns, the next step would be a 1-hour chart analysis, zooming in on the immediate price action and short-term momentum around the critical $0.165–$0.175 consolidation zone. After that, a key levels summary pulls together the most important support and resistance levels across all timeframes for quick reference. The analysis then moves into a price prediction section, weighing the deeply bearish technical structure against any potential fundamental catalysts that could trigger a recovery. Finally, a conclusion summarizes the overall market bias, helping readers assess whether ADA at $0.167 represents a capitulation buying opportunity or a warning of further downside.
Why is Cardano down today?
Cardano is down today due to a mix of poor price action and deep concerns about the ecosystem. On the charts, ADA has been in a relentless downtrend since January’s $0.440 peak, with sellers breaking every support level in sight. TapTools, a long-standing Cardano analytics platform, shut down after citing unsustainable operating conditions, while founder Charles Hoskinson warned of a potential “wave of failures” and criticized the community’s reluctance to deploy treasury funds to support projects. Adding to the pain, the community voted against funding Cardano’s own flagship 2026 Summit, forcing its cancellation — deepening the confidence crisis already reflected in today’s price.
Is Cardano a good investment?
Cardano (ADA) presents a mixed investment opportunity. It is a third-generation blockchain that aims to solve scalability issues and enhance security through its Proof-of-Stake mechanism. While some analysts predict significant price increases by 2030, others caution that it remains a high-risk investment given the volatility of the crypto market.
Investors should consider their risk tolerance and research before investing, as Cardano’s future performance is uncertain and contingent on market conditions and technological advancements.
Will Cardano recover?
Cardano’s recovery potential depends on market sentiment and adoption. Despite past challenges, its projected price increase in 2026, potentially reaching $1, has significantly bolstered confidence in the coin’s future.
Will Cardano reach $5?
Cardano hitting $5 seems quite achievable given past levels. With its ATH around $3.10, $5 would only need to beat that peak by about 60%. A solid bull run and significant adoption could drive the unit price to $5.
Will Cardano reach $10?
Cardano hitting $10 is a long shot. Its all-time high was around $3.10 back in 2021, so $10 would mean more than tripling that peak. At current prices, that’s an over 13x jump. While crypto can be unpredictable, that would need massive adoption and a bull run far beyond what we saw in 2021.
Will Cardano reach $50?
Cardano hitting $50 is extremely likely. With ADA’s current supply of around 35 billion tokens, a $50 price would require a market cap of approximately $1.75 trillion. Even in crypto’s craziest bull runs, that kind of valuation doesn’t happen for altcoins.
What is the Cardano forecast for 2040?
Predicting Cardano’s (ADA) price in 2040 is highly speculative as it depends on multiple factors, including adoption, regulatory developments, technological advancements, and macroeconomic conditions. However, if Cardano continues to develop its smart contracts, decentralized applications (dApps), and blockchain efficiency, it could see widespread adoption, driving its price higher.
Some optimistic projections suggest that ADA could reach double-digit prices, possibly ranging from $10 to $50 or more. However, in a bearish scenario, where regulatory hurdles and competition slow its progress, ADA could struggle to maintain high valuations.
What will be the future price of Cardano in 2050?
Predicting Cardano’s (ADA) price in 2050 is highly speculative, but if blockchain adoption continues to grow and Cardano successfully scales its smart contract ecosystem, its price could appreciate significantly. What that number will be remains to be seen.
Does Cardano have a good long-term future?
Cardano (ADA) has a positive long-term outlook, driven by its technological advancements and growing ecosystem. The platform’s unique features, such as its focus on scalability and partnerships with various institutions, position it well for future adoption. However, its success will depend on overcoming regulatory scrutiny and challenges related to developer engagement.
Recent news/opinion on Cardano
Cardano’s Plutus Cost Model Update Goes Live on Mainnet Ahead of Protocol Version 11 Hard Fork
Cardano’s Plutus Cost Model GA has launched on mainnet, enabling new Plutus V1, V2, and V3 primitives while requiring DRep and Constitutional Committee votes to activate additional features post-hard fork.
Plutus Cost Model update proposal now live on Mainnet!
Having progressed through SanchoNet, Preview and PreProd test networks during March, April and May respectively, the Plutus Cost Model GA is now live on Mainnet.
Cardano’s June 2026 forecast is $0.2193-$0.3169, averaging $0.2617, driven by steady network development, including smart contract enhancements and scaling upgrades. The growing use of Cardano-based DeFi, NFTs, and governance projects supports moderate bullish sentiment. However, cautious market conditions and slow institutional momentum may limit rapid price expansion, maintaining this controlled range.
Cardano Price Prediction
Potential Low
Potential Average
Potential High
Cardano price prediction June 2026
$0.2193
$0.2617
$0.3169
Cardano price prediction 2026
According to the Cardano price prediction, ADA might reach a maximum price of $1.33, with an average trading price of about $1.20 and a minimum price of $1.03
Cardano Price Prediction
Potential Low
Potential Average
Potential High
Cardano price prediction 2026
$1.03
$1.20
$1.33
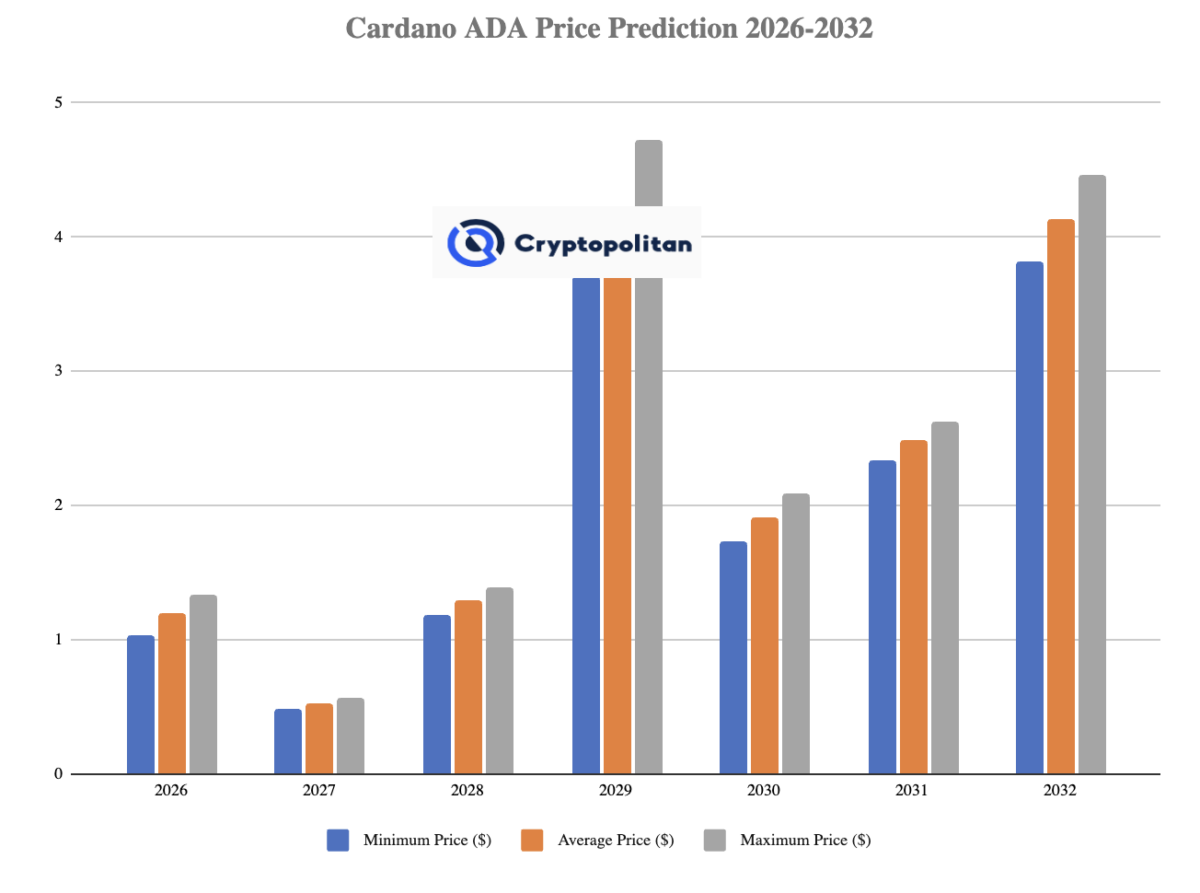
Cardano price predictions 2027-2032
Year
Minimum Price
Average Price
Maximum Price
2027
$0.4838
$0.5282
$0.5725
2028
$1.19
$1.29
$1.39
2029
$3.71
$4.21
$4.72
2030
$1.73
$1.91
$2.09
2031
$2.33
$2.48
$2.63
2032
$3.81
$4.13
$4.46
Cardano price prediction 2027
Cardano’s price is forecast to reach a low of $0.4838 in 2027. According to analysts, the ADA price is expected to decline and could reach a maximum of $0.5725, with an average forecast of $0.5282.
Cardano price prediction 2028
The Cardano price is forecast to reach a minimum of $1.19 in 2028. According to the findings, the ADA price could reach a maximum of $1.39, with an average forecast price of $1.29. This is expected as network upgrades, DeFi expansion, and institutional integration strengthen ADA’s utility and demand, supporting steady long-term growth.
Cardano price prediction 2029
According to detailed market projections and historical trend analysis, Cardano (ADA) could trade at a minimum of $3.71 in 2029, reaching as high as $4.72, with an average price of $4.21.
Cardano price forecast 2030
Based on a comprehensive technical evaluation and market trends, Cardano (ADA) could bottom around $1.73 in 2030, with highs near $1.91 and an average of $2.09.
Cardano price prediction 2031
The price of 1 Cardano (ADA) is expected to increase slightly from previous years, reaching a minimum of $2.33 in 2031, with a potential peak of $2.63 and an average of $2.48.
Cardano price prediction 2032
According to the forecast and technical analysis, the ADA coin price prediction for 2032 is expected to range from a minimum of $3.81 to a maximum of $4.46, with an average of $4.13. This upward outlook is supported by Cardano’s full ecosystem maturity, large-scale enterprise integration, and increasing global adoption of decentralized applications built on its network, driving long-term demand and value appreciation.
Cardano price prediction 2026-2032
Cardano ADA price prediction: Analysts’ ADA price prediction
Firm Name
2026
2027
DigitalCoinPrice
$0.31
$0.31
Coincodex
$ 0.3915
$ 0.6216
Cryptopolitan’s Cardano price prediction
According to Cryptopolitan’s projections, ADA’s price could reach $0.35 in 2026. By 2027, Cardano’s price could trade at a maximum of $0.51.
ACH launched near $0.02 in 2020, surged to $0.1975 in August 2021, then slid below $0.10 by year’s end.
During 2022 and 2023, it fell to $0.0133, later rebounded toward $0.049, but stayed volatile
In 2024, it dropped to $0.0145, recovered above $0.02, and briefly reached $0.0397 in December.
Early 2025 saw swings between $0.016 and $0.040, before weakening again toward $0.020 by mid-year.
Late 2025 into early 2026 marked heavy losses to $0.0070–$0.0078, followed by stabilization near $0.0082.
In early January 2026, Cardano traded between $0.36 and $0.38 as buyers sought to stabilize the price after the December decline and defend support in the mid $0.30s.
By late January into February 7, the price slipped toward roughly $0.33 to $0.34, showing continued corrective pressure and consolidation near a key support zone.
Cardano traded around $0.40 on Jan 7, 2026, but steadily declined through the month, falling to roughly $0.29 by Feb 1 as selling pressure increased across the broader altcoin market.
The price briefly recovered afterward, rising from about $0.25 on Feb 5 to around $0.27 on Feb 7, showing a short-term rebound after the early February dip.
ADA began March around $0.29, attempting to stabilize after a sharp decline, with small consolidation candles forming near that level and a brief 5.8% surge on March 13 as broader crypto markets rallied — though the recovery lacked strong follow-through, with price still trading below all major moving averages throughout the month.
By late March, Hyperliquid’s HYPE token flipped ADA in market cap on March 18, adding bearish sentiment, and ADA dropped 4.8% on March 25 as part of a worldwide market sell-off — ultimately closing the period around $0.24 by April 3, representing a decline of roughly 17% over the month.
ADA entered April 1 around $0.24, having shed roughly 17% through March, driven by broad market selling and bearish sentiment, with the month’s forecast range sitting between $0.2251 and $0.3252.
By May 2, ADA was virtually flat at approximately $0.25, having spent the entire period consolidating in a narrow range with 50% green days and just 1.96% price volatility, reflecting a market stuck in indecision with no meaningful breakout in either direction.
ADA entered May 2 trading around $0.25, consolidating near multi-month lows after a prolonged downtrend from the January highs near $0.44, with bears firmly in control and the token struggling to hold above the critical $0.24-$0.25 support zone throughout the month.
By June 2, ADA had declined further to around $0.23, down 2.56% on the day, after the Cardano Foundation canceled its 2026 annual summit following a funding vote that failed, adding significant negative sentiment and pushing ADA toward its lowest levels since 2020.
Canada Crypto Week Returns July 20–26, Celebrating the Future of Web3, Digital Assets & AI
Canada’s largest week-long gathering of conferences, networking events, and community experiences — uniting entrepreneurs, builders, investors, and institutions.
Toronto, ON — June 2026
Canada Crypto Week returns July 20–26, 2026, for its sixth year, bringing together dozens of events across Canada focused on cryptocurrency, digital assets, and artificial intelligence. The week connects entrepreneurs, builders, investors, and institutions through a diverse lineup of events taking place across the country.
The flagship event is Blockchain Futurist Conference — Canada’s largest Web3 and AI event — taking place July 21–22 at Rebel Entertainment Complex and Cabana Pool Bar in Toronto, attracting thousands of attendees and serving as the hub for the week’s featured events and experiences.
Canada Crypto Week kicks off with Web3TO Toronto Conference 2026 on July 20, bringing together the Web3 community for a full day of insights on the future of the industry.
Returning to Canada Crypto Week, Cayman Finance will host its annual Rum Bar Cayman Experience in the VIP Cabana Area on July 21 and 22, giving VIP attendees an opportunity to experience Cayman hospitality, connect with companies from the Cayman Islands, and learn more about doing business in one of the world’s leading financial jurisdictions.
A key addition this year is the Compliance Breakfast on July 22, presented by VerifyVASP, Inca Digital, XReg Consulting, Crystal Intelligence, and Cloudburst Technologies. The invite-only event brings together regulators, policymakers, compliance leaders, and industry executives for meaningful discussions on digital assets, AI, regulation, and the future of innovation.
Also featured is Agentic Day presented by Hello Agentic on July 21 — a dedicated afternoon program exploring the future of AI agents and autonomous intelligence, bringing together innovators building the next generation of agentic AI.
Featured Events & Activations
Agentic Day by Hello Agentic
Cayman Finance Rum Bar Experience
Compliance Breakfast by VerifyVASP et al.
Invest Hong Kong Workshop
Pudgy Penguins Vibes Card Game Event
SheFi Morning Social at ETHWomen
House of Intelligence by House of ZK
AWIC Facilitated Networking
Whitepaper Reading Sessions
Book Signings: Wick, Nesbitt & Osborne
ETHToronto by Autheo
5th Annual ETHWomen
Bored Ape Meetup
Doginal Dogs VibeZone
Solana VibeStation
Sponsors & Community Partners
Canada Crypto Week is made possible through the support of sponsors, community organizations, and media partners from across the industry. Stablecorp and QCAD join as the Official Stablecoin Partner, supporting the growth and adoption of digital assets in Canada. CryptoNomads connects global Web3 professionals and digital nomads through its worldwide network. CCN (Crypto Citizens Network) will conduct live interviews and capture insights from leading voices across Web3 throughout the week.
“Canada Crypto Week is where Canada’s Web3, digital asset, and AI communities come together to connect, collaborate, and build the future.”
Canada Crypto Week is Canada’s largest week-long celebration of cryptocurrency, blockchain, Web3, digital assets, and artificial intelligence. Now in its sixth year, the initiative brings together more than 50 independent events, conferences, meetups, networking experiences, educational sessions, and community gatherings designed to connect and grow Canada’s innovation ecosystem.
AI Can’t Think Straight Without Verified Data. Here’s Who’s Fixing That.
AI Can’t Think Straight Without Verified Data. Here’s Who’s Fixing That.
Data Lakes are live, the AI SDK is open, and a landmark partnership with Theta puts verified AI infrastructure on-chain. Here is what it all means.
By Crypto Coin ShowJune 4, 20266 min read
The AI industry has a data problem it has not fully admitted to yet. XYO has spent eight years building the answer.
Every major AI model — from OpenAI to Anthropic to Google — runs on data. The quality of that data determines whether the output is useful or dangerous. But for most of AI’s short history, the data feeding these systems has been unverifiable, easy to manipulate, and impossible to audit in real time. That is the gap XYO was built to close.
In the past few weeks, XYO has made a series of announcements that mark a significant shift from infrastructure project to active AI utility layer. Data Lakes — the on-chain data storage system that underpins everything — is now live. The XYO AI SDK has launched, opening the network to developers regardless of blockchain experience. And a formal partnership with Theta Network puts verified AI compute on-chain for the first time at scale.
10M+
Devices on the XYO network collecting and validating data
8 yrs
Building decentralized physical infrastructure before DePIN was a category
XL1
The first blockchain purpose-built for data, not token transfers
Why every other blockchain failed at data
Bitcoin was designed to move value between parties and maintain an accounting ledger. Ethereum expanded that model but remained fundamentally a transaction network. Even Solana — one of the most modern and efficient chains available — makes storing a meaningful amount of data prohibitively expensive, running into the thousands of dollars per operation.
The reason is structural. These networks were optimized for token transfers, not data provenance. Storing an image on Bitcoin costs millions of dollars. Ethereum sits at $100,000 to $200,000 for the same operation. These aren’t edge cases — they represent a fundamental mismatch between what existing blockchains do and what an AI-driven world requires.
“XYO Layer One is the first blockchain really built for data from scratch. We said someone else needs to build a layer one for data — but nobody had done it. So we built it.”
— Markus Levin, Co-Founder, XYO Network
XYO’s approach solves this through its Data Lakes infrastructure. Rather than storing raw data directly on-chain — which would be expensive at scale — XYO hashes the data and records that hash on the XL1 blockchain. The result is a permanent, tamper-evident record that proves both the origin and integrity of the data, without bloating the chain itself.
Data Lakes: what it is and why it matters
Data Lakes is now live on XYO Layer One. It is, at its core, a structured data storage system designed for the requirements of AI and autonomous systems — not for financial transactions.
The system supports both public and private data lakes, which matters enormously for enterprise adoption. A logistics company tracking autonomous robots across a warehouse needs private data with verifiable integrity. A smart city managing traffic flow might use public data lakes to enable third-party verification of its own systems. Both use cases are now available on-chain.
Proof of origin
One of the most technically significant features of Data Lakes is proof of origin. XYO can prove, cryptographically, that a specific piece of data was generated by a specific sensor at a specific time — before it ever touched a data lake or a smart contract. That provenance chain is immutable once written.
For AI systems, this changes the hallucination problem. Today, when an AI model produces a wrong answer, there is no reliable way to trace back to which data source caused it. With XYO’s provenance model, an AI can surface exactly which data sources it relied on — and each of those sources can be independently validated. Bad data can be identified, isolated, and corrected.
Use case
Smart cities and autonomous infrastructure
Imagine a city where self-driving cars move without traffic lights, coordinated entirely by real-time sensor data fed into smart contracts. For that to work safely, the underlying data cannot be faked, delayed, or tampered with. XYO’s verified data layer — collecting from over 10 million devices, hashed and stored on XL1 — is exactly the infrastructure that makes autonomous coordination trustworthy at city scale.
The AI SDK: opening the network to everyone
The XYO AI SDK, released in May 2026, is the interface layer that connects XYO Layer One to the broader developer ecosystem. It is designed around a specific insight: most DePIN projects are technically insular. They are decentralized in structure but difficult to integrate with unless you are already a Solidity developer or blockchain specialist.
XYO took the opposite approach. The SDK is built on JavaScript and standard APIs, meaning any web2 developer — or frankly, anyone who can prompt an AI coding assistant — can connect into the XYO data network and build on top of XL1. Anthropic, Google, and OpenAI could plug in today if they chose to.
Beyond developers, the SDK opens up content authenticity use cases. Creators can hash their content to permanently verify provenance — proving that a piece of writing, audio, or video was generated by them, not by an AI system pulling their likeness or style. As AI-generated content floods every platform, on-chain provenance may become the only reliable signal of authenticity.
From the interview — Markus Levin on the SDK
“Even if you’re a DJ or a janitor or a teacher — it doesn’t matter. If you have an idea you want to connect with blockchain or a DePIN network, anything you can think of can now be built on XYO Layer One using the XYO AI SDK.”
Markus Levin · Crypto Coin Show · May 29, 2026
The Theta partnership: verifying AI agents at scale
The most significant near-term application of all this infrastructure is the partnership with Theta Network, announced in late May 2026. Theta is one of the most established decentralized compute and media delivery networks in crypto, founded in 2019 with partnerships including the Houston Rockets and Olympic organizations. Its core infrastructure is used for AI compute — running AI agents and handling enterprise deployments at scale.
The problem Theta faced, and that much of the AI compute sector faces, is verification. When a decentralized network claims to have a certain number of nodes or a certain level of compute capacity, there is currently no trustless way to independently validate that claim. Projects are incentivized to inflate their numbers. There is no audit trail for AI agent outputs. There is no immutable record of whether an agent performed as intended.
XYO now provides exactly that. Under the partnership, XYO verifies Theta’s AI compute infrastructure — confirming that the nodes claimed actually exist — and records the outputs of Theta’s AI agents on-chain, making them permanent and auditable. If a Theta AI agent gives wrong advice or behaves unexpectedly, that output is on the record. Liability becomes traceable. Quality becomes measurable.
“We record the answers of the AI agents and make it immutable. You can check the quality of the answers and make sure your agents run the way they’re supposed to run.”
— Markus Levin, Co-Founder, XYO Network
Perhaps as significant as the partnership itself is the speed at which it was built. Integrations like this typically take months of development work. The XYO team completed it in a matter of days using the AI SDK — a demonstration that is arguably more important than the partnership announcement itself. It signals that XYO’s infrastructure is now genuinely composable and fast to deploy.
The bigger picture: AI accountability is a market
The converging forces here — AI agents proliferating across enterprise, autonomous systems entering physical infrastructure, regulatory pressure building around AI liability — all point in the same direction. Verified, auditable, on-chain data is not a niche product. It is becoming a compliance requirement.
Healthcare systems using AI for diagnosis. Financial institutions running AI portfolio managers. Logistics networks deploying autonomous robots. Smart cities managing real-time infrastructure. All of these sectors will eventually need what XYO has spent eight years building: proof that the data feeding their AI systems is real, unaltered, and traceable to its origin.
XYO is not the only project working in this space, but it is the only one that started as a data company, built a DePIN network first, and then constructed a blockchain specifically for data provenance rather than adapting a financial ledger to an incompatible purpose. That sequencing matters.
Watch the full interview
Markus Levin on Blockchain Interviews
XYO Co-Founder Markus Levin joins Ashton Addison to go deep on AI hallucinations, the Data Lakes launch, the Theta partnership, and where verified data infrastructure is heading next.
Amsterdam Set to Welcome Thousands of Digital Asset Professionals
Dutch Blockchain Week 2026 Releases Full Summit Agenda as Europe’s Digital Asset Industry Gathers in Amsterdam
DatesJune 22–28, 2026
SummitJune 24 & 25, 2026
VenueJohan Cruijff ArenA, Amsterdam
Side Events40+ City-Wide
With less than a month to go, Dutch Blockchain Week 2026 has released the full agenda for its flagship summit — offering a clearer picture of the companies, institutions and industry leaders set to gather in Amsterdam this June.
7
Days of industry-wide programming across Amsterdam
2
Summit days at Johan Cruijff ArenA
40+
Side events, dinners & meetups across the city
MiCA
Europe’s regulatory era — Amsterdam at the center
Taking place from June 22–28, 2026, Dutch Blockchain Week has evolved into one of Europe’s largest blockchain and digital asset gatherings. At the center of the week is the Dutch Blockchain Week Summit on June 24 & 25 at Amsterdam’s iconic Johan Cruijff ArenA, bringing together exchanges, banks, payment providers, regulators, infrastructure companies, policymakers and investors.
Summit Topics
The summit program reflects the continued maturation of the industry. Key themes taking center stage across two days of content include:
Among the confirmed speakers is Charlie Lee, Founder of Litecoin and Director of the Litecoin Foundation, alongside senior executives and industry leaders from:
Charlie Lee — Litecoin FoundationVisaMastercardKrakenBitwiseFireblocksChainlinkMinistry of FinanceRippleDeloittePwC+ Many Others
Breakout Program
Beyond the main stage, attendees will have access to a dedicated breakout program hosted by leading organizations. These sessions are designed to provide deeper insights into the technologies, regulations and business models driving the next phase of digital asset adoption.
Visa · Mastercard · Deloitte · PwC · Fireblocks · Kraken · OKX · Bybit EU · Zerohash Europe · Coinmerce · Talos
Amsterdam & MiCA
As Europe enters the MiCA era, Amsterdam continues to strengthen its position as a key destination for digital asset companies seeking to operate within a regulated framework. This shift is increasingly reflected in the audience attending Dutch Blockchain Week, which now attracts professionals from traditional finance, banking, fintech, government, legal, payments and blockchain sectors alike.
Networking
Networking remains a major focus for this year’s edition. Through a dedicated networking platform, attendees can connect, schedule meetings and engage with partners before arriving in Amsterdam. During the summit, dedicated networking areas and curated meeting opportunities are designed to facilitate meaningful business conversations and long-term partnerships.
The wider Dutch Blockchain Week ecosystem extends well beyond the summit itself. More than 40 side events will take place throughout Amsterdam — ranging from investor dinners, executive roundtables and networking receptions to community meetups, workshops and industry-focused gatherings.
“Dutch Blockchain Week 2026 is positioning itself as more than a conference. It is becoming a meeting point for the companies, institutions and professionals actively shaping the future of digital assets in Europe.”
Dutch Blockchain Week is one of Europe’s largest blockchain and digital asset gatherings, held annually in Amsterdam. The event brings together professionals from across exchanges, banking, payments, regulation, infrastructure, legal and investment sectors, creating a platform for business development, knowledge sharing and relationship building at the intersection of finance and digital assets.
About Crypto Coin Show
Crypto Coin Show is a leading media platform covering blockchain events, digital asset industry news, and the global crypto conference landscape. We connect professionals with the events, insights and conversations shaping the future of finance.
There’s a scene in the new film Obsession (2026) that’s been living rent-free in a lot of heads since its release. A character gets a fragile little novelty toy, the “One Wish Willow”, and wishes for a billion dollars. (Spoiler alert) and cash literally rains from the ceiling. It’s absurd, it’s funny, and for about three seconds, everyone watching thinks: what would I wish for?
Here’s a better question: what if you didn’t need a wish at all?
The crypto market has always attracted dreamers. That’s not a criticism; it’s how generational wealth gets built. But there’s a difference between dreaming and deciding. Between waiting for the moment to feel right and recognizing that the moment is already here, already moving, already filling up.
Solana Unchained ($UCHN) is in Phase 1 of its presale. The price is $0.05. The listing target is $0.50. That’s a 10x multiple, not a projection, not a promise, a number locked into the structure of the raise before a single token hits an exchange. Phase 1 is already over 30% sold, and the window closes June 6, 2026.
Phase 2 Opens At $0.07. Math Doesn’t Get Easier From Here
$UCHN is a utility-driven token built on Solana, one of the fastest, most battle-tested blockchains in the world. The kind of infrastructure that doesn’t flinch when volume spikes. The kind of network that institutional money has started to take seriously. Solana Unchained is designed to operate inside that ecosystem with purpose, not as a meme, not as a gamble, but as a project built for what comes after the hype cycle settles.
The tokenomics are transparent. The roadmap is public. The presale is structured into 10 phases with incrementally rising prices, each phase rewarding those who moved earlier rather than those who wished they had.
And about that billion-dollar wish
(Spoiler alert) In Obsession, the wish works, but nobody’s in control of what happens next. A $1 billion market cap for Solana Unchained is a different kind of story. With a total supply of 100 million, a $1B market cap would put $UCHN at $10 per token. A long way from current numbers, but crypto has seen even more fascinating stories.
So, What Does Solana Unchained Do?
Solana Unchained isn’t chasing a trend; it’s building infrastructure.
At the core of the ecosystem is the AI Tool Hub, a token-gated platform giving $UCHN holders access to premium AI tools for trading insights, content automation, and DeFi workflows, live during 2026, and some will be live during presale and upon launch, not promised for someday.
Stack that with the Unchained Vault, which offers presale investors a tiered yield account paying 15% to 150% APR weekly, directly to users’ wallets in USDC or $UCHN, with zero lockup requirements. Then there’s the Unchained Wallet, a non-custodial, mobile-first wallet with built-in crypto commerce, social recovery, and on-chain inheritance, solving one of the most overlooked problems in the space: permanent loss of access.
Underneath all of it runs a Native Commerce Protocol that enables real crypto transactions without KYC or middlemen, on Solana’s fast, low-fee network. The supply is fixed to100 million tokens, and 60% is allocated to the presale. There’s no hidden inflation.
The Community Is Paying Attention, And So Are the Auditors.
Trust in crypto isn’t claimed; it’s verified. Solana Unchained has passed independent security audits by Solidproof, Spywolf, and Cyberscope, three of the most recognized names in blockchain contract verification. The team verified their identities to Spywolf, and it is on record. The audit reports are public. Some analysts have already produced coverage on the project, like Crypto League and Crypto Volt. Coverage has also landed across Fidelity, Business Insider, and Benzinga, putting Solana Unchained in front of audiences well beyond the typical crypto bubble. The foundation is audited, the community is growing, and Phase 1 closes June 6, 2026.
Disclaimer: The above article is sponsored content; it’s written by a third party. CryptoPotato doesn’t endorse or assume responsibility for the content, advertising, products, quality, accuracy, or other materials on this page. Nothing in it should be construed as financial advice. Readers are strongly advised to verify the information independently and carefully before engaging with any company or project mentioned and to do their own research. Investing in cryptocurrencies carries a risk of capital loss, and readers are also advised to consult a professional before making any decisions that may or may not be based on the above-sponsored content.
Readers are also advised to read CryptoPotato’s full disclaimer.


 price prediction 2026-2032: Will GRAM reach $10?")