Solana (SOL) price fell about 17% over the past week, but the real damage sits beneath the chart. Capital left the ecosystem, long-term holders capitulated, and trading activity faded together.
The price drop was the surface. On-chain, three measures show the selloff ran deeper than a routine pullback, and they explain why the bounce off $60, the latest low, still looks fragile.
Capital Actually Left the Solana Ecosystem
The first crack is in total value locked, or TVL. It is the dollar value of assets deposited in a network’s DeFi protocols. Solana’s DeFi-only TVL sits near $4.87 billion (excluding liquid staking), down about 9.55% over the past week and roughly 15% over 30 days.
A falling TVL means users pulled liquidity out of Solana’s apps rather than simply marking existing deposits lower. That points to capital leaving the network, not just prices dropping.
Want more token insights like this? Sign up for Editor Harsh Notariya’s Daily Crypto Newsletter here.
The exit raises a sharper question about who was selling, and the holder data provides the answer.
Even Long-Term Solana Holders Left
The deepest damage shows in the holder’s behavior. Hodler net position change, a metric that tracks whether long-term holders of 155 days or more are adding or reducing supply, fell sharply amid the TVL and price decline.
The figure dropped from about 3.27 million SOL on May 31 to roughly 2.36 million SOL by June 6, as the price slid toward its low. When the most patient holders sell into weakness, it shows conviction broken, not just speculative interest.
That loss of long-term confidence is the clearest sign the selloff was structural, and the trading data confirms it.
Trading Activity and DEX Dominance Both Slid
The cooling shows in volume. Centralized exchange volume for SOL peaked at $7.03 billion on June 6, the height of the selloff, then dropped back as the panic eased, leaving turnover at its lowest since that spike.
Do note that the 7-day rising trend is due to the high volume days on June 5 and June 6.
Solana’s DEX dominance, its share of total decentralized exchange volume across crypto, is also slipping. It sits near 22.6%, below its 60-day average of 23.3% and down from a near-term high of about 30.4% on June 4.
Falling dominance shows the weakness is structural, not just a SOL price move, as capital rotates away from Solana’s on-chain trading.
Together, the three measures explain what really broke during the crash.
The Rebound Looks Fragile Until One On-Chain Level Clears
There is one tentative positive. As Solana price bounced about 13% off its June 6 low near $60, hodler net position change turned higher again. This hints that long-term holders started buying once the price stabilized.
This is not a price prediction, but the on-chain cost basis shows the hurdle ahead. The cost basis distribution heatmap, which maps the prices at which holders actually acquired their SOL, shows a dense cluster of supply near $74 to $75.
Holders who bought there tend to sell when the price returns to their entry, creating resistance.
Until DeFi TVL stabilizes and that supply zone clears, the rebound stays fragile. Whether long-term holders keep buying or fading activity wins out will decide whether Solana’s price builds on its bounce or slips back toward its low.
Solana co-founder Anatoly Yakovenko publicly rejected Senator Bernie Sanders’ AI jobs warning. The senator argues artificial intelligence (AI) and robotics could wipe out millions of American jobs.
Sanders paired the warning with a renewed call to ban super PACs. Yakovenko answered with a string of posts defending markets, profit, and decentralized finance (DeFi).
Sanders’ AI Jobs Warning Meets a Free Market Rebuttal
The Vermont senator said Congress has abandoned workers threatened by automation because of industry money.
Is Congress doing anything to help the millions of workers who could lose their jobs to AI and robotics? No.
They’re intimidated by the hundreds of millions the AI industry is pouring into super PACs.
The spending claim tracks with disclosures. Leading the Future, an AI super PAC network backed by OpenAI president Greg Brockman and Andreessen Horowitz, raised $125 million in late 2025.
The group has pledged at least $100 million for the midterms.
“Senders [Sanders] is focusing on hypothetical sci fi problems because he is completely f’ing useless at solving any real problems,” the Solana co-founder posted in the thread.
Capital, Trillionaires, and the DeFi Defense
Yakovenko widened the argument across more than a dozen replies. Billionaires hold capital rather than hoarded wealth, he argued, and surplus production is what raises living standards.
He also claimed 500 more trillionaires would roughly double the global standard of living, all else equal. Reportedly, his family left the USSR with $50 per person, he shared, casting central planning rather than AI as the real threat to workers.
The thread looped back to crypto. Any profitable market will be rebuilt endlessly as a smart contract, he wrote, months after he gave away code for a perpetuals exchange.
There is no last train. Anything that is generating a profit that can be built as a smart contract will be built, over and over. That’s the whole point of DeFi. Reduce the cost of finance to the cost of software.
Solana (SOL) traded at $65.36 at press time, up nearly 6% in 24 hours. The coming primaries will test whose framing carries more weight with lawmakers.
The average Sonic price prediction for 2026 is $0.03259.
Holders can anticipate a maximum price of $0.1574 in 2029.
By 2032, Sonic (S) might touch $0.2967
Sonic is a high-performance EVM Layer 1 blockchain built for DeFi applications, offering up to 400,000 TPS and sub-second finality. The network introduced its Fee Monetization (FeeM) program, allowing developers to earn up to 90% of the fees generated by their applications. Sonic also features a native Ethereum bridge called the Sonic Gateway, which includes a Fast-Lane transaction feature and a fail-safe security mechanism. For investors and traders following Sonic price prediction trends, these features are important because they support ecosystem growth, developer activity, and the chain’s long-term demand.
Sonic emerged from Fantom’s rebrand after Michael Kong announced the Sonic mainnet launch in March 2024. Fantom later fully transitioned to Sonic on January 16, 2025, as the project expanded through partnerships with Chainlink, Pyth Network, Alchemy, Dune, and Safe.
Sonic reached an all-time high of $1.03 in January 2025 before falling to a low of $0.0368 in February 2026. Investors’ questions remain. Will Sonic reclaim Fantom’s all-time high of $3.48? How high can Sonic (S) go in the coming years? Let’s take a look at Sonic’s price prediction and price prediction tool to answer these questions.
Sonic Price Prediction: An Overview
Cryptocurrency
Sonic
Token
S
Price
$0.02906
Market Cap
$83.71M
Trading Volume (24-hour)
$19.27M
Circulating Supply
2.88B S
All-time High
Jan 05, 2025 $1.03
All-time Low
Jun 05, 2026 $0.03036
24-h High
$0.040901
24-h Low
$0.040163
Sonic (S) price prediction: Technical analysis
Volatility
4.09% (Medium)
50-Day SMA
$ 0.04407
Price Prediction
$ 0.02376 (-25.50%)
14-Day RSI
37.59 (Neutral)
Green Days
11/30 (37%)
Sentiment
Bearish
Fear & Greed Index
12 (Extreme Fear)
200-Day SMA
$0.06032
Sonic price analysis S falls to a new all-time low as sellers stay in control
TL;DR Breakdown
Today’s Sonic price analysis shows strong bearish pressure as S falls to a fresh all-time low of $0.02768
Sonic’s current resistance is at $0.0321, while the immediate support remains at the all-time low of $0.0277
Today, Sonic is trading around $0.02924, down 6.32% in the last 24 hours
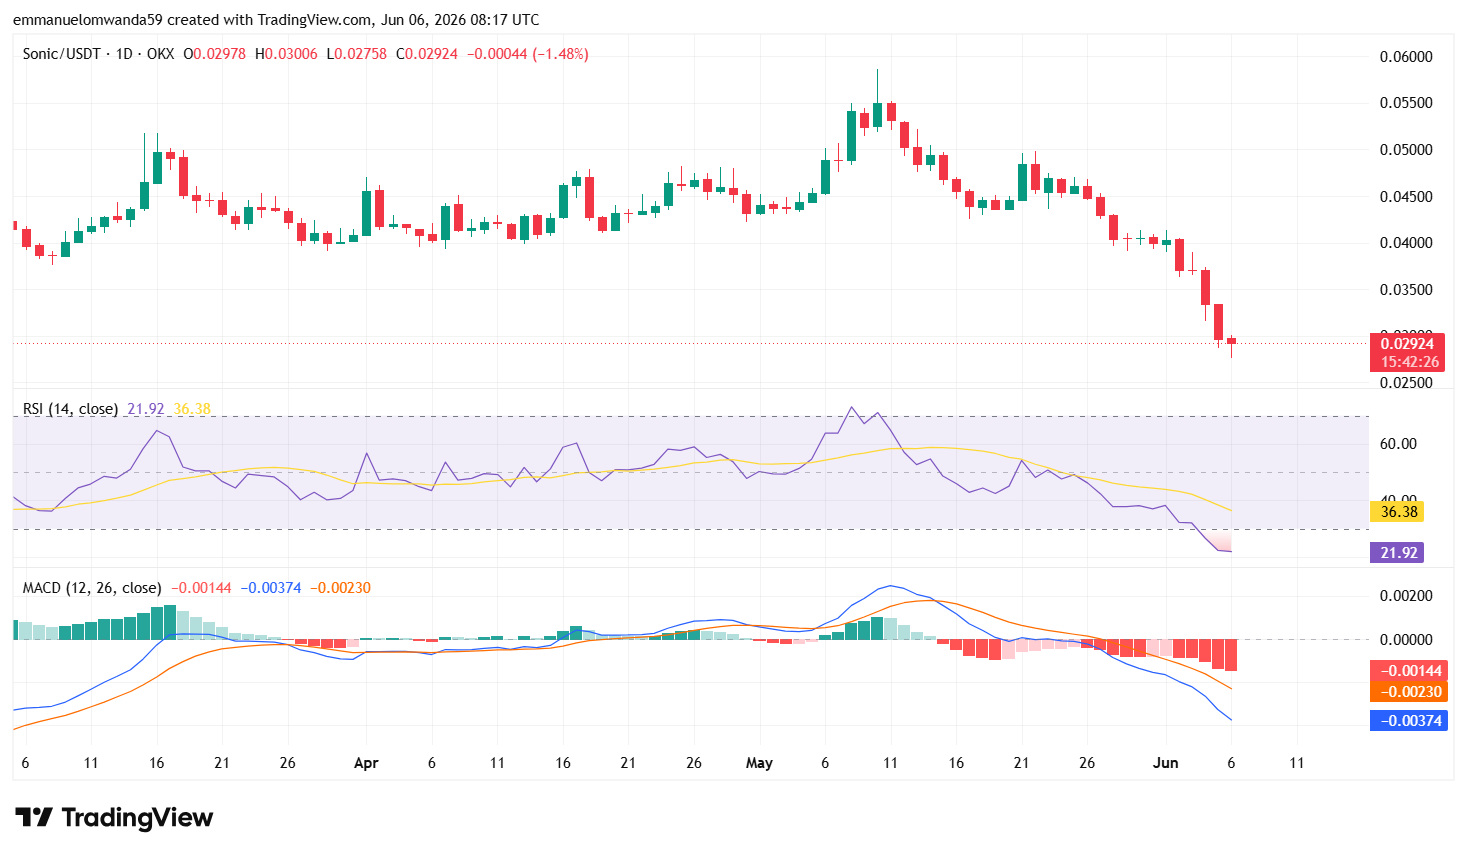
As of June 6, 2026, Sonic’s price analysis shows a bearish market structure. Sonic is currently trading at $0.02928, down 6.32% in the last 24 hours. Selling pressure increased today, driven by Sonic’s new all-time low price of $0.02768, underscoring the continued market dominance by bears. Although buyers managed to trigger a small recovery from the lows, it remains weak as the price continues to trade near historically depressed levels.
Sonic (S) price analysis 1-day chart
Analyzing the one-day chart for Sonic, it shows persistent selling pressure after the token recorded a fresh all-time low.S dropped to $0.02768, breaking below previous support levels and extending its broader downtrend that has been in place for several months.
The latest daily candle remains bearish despite a small recovery from the day’s low. The decline reflects weak market confidence, with sellers continuing to dominate price action. Sonic is now trading more than 97% below its all-time high of $1.03, showing the level of the long downtrend.
Trading activity has weakened over the past 24 hours, with volume falling by 26.14% to $18.93 million. The decline in volume suggests that market participation is cooling despite Sonic’s drop to a new all-time low, indicating limited buying interest at current levels.
S/USD Chart: TradingView
Technical indicators continue to favor sellers. The Relative Strength Index (RSI) has dropped to 21.9, placing Sonic deep in oversold territory. While such levels often precede temporary relief rallies, the indicator is yet to show any meaningful bullish divergence. The continued decline in RSI reflects strong bearish momentum and weak buying interest.
The MACD indicator remains negative as the MACD line trades below the signal line. Expanding red histogram bars suggest that downward momentum is still dominating the market despite today’s rebound from the all-time low. This setup indicates that sellers continue to control the broader trend.
Buyers need to reclaim the $0.0320 area before any meaningful short-term reversal can be considered. Until then, rallies may continue to attract selling pressure.
S’s technical analysis 4-hour chart
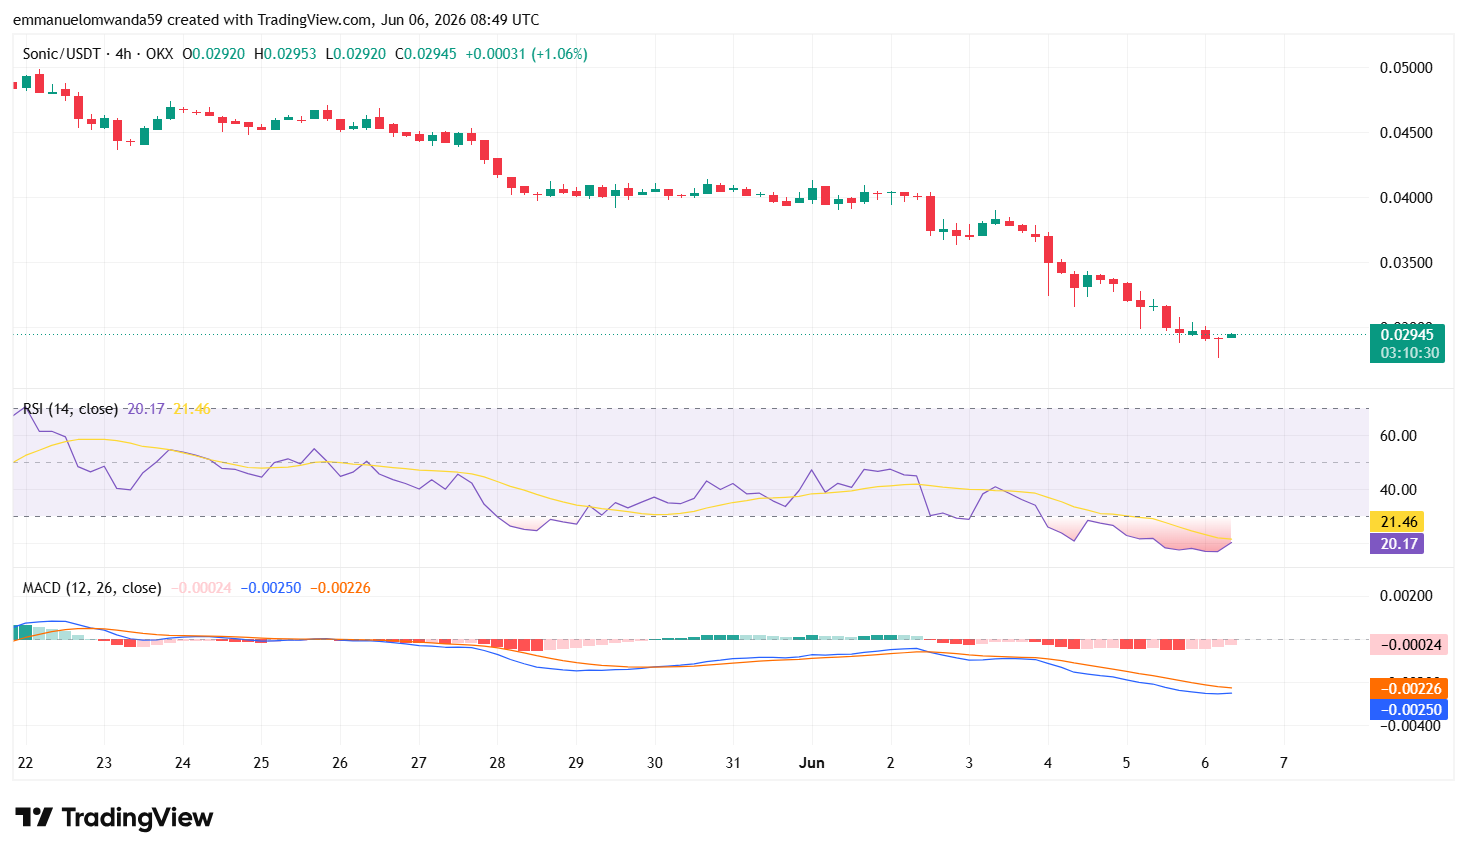
The 4-hour Sonic price chart shows bears still maintaining strong control of the market. Although the token has stabilized around the $0.0294 level, buying momentum remains weak as the broader trend continues to favor sellers.
The RSI on the 4-hour timeframe has dropped to 20.17, still in oversold territory. While this suggests selling pressure has become extreme, the indicator has yet to show a convincing recovery signal. The MACD indicator remains bearish.
S/USD Chart: TradingView
The MACD line continues to trade below the signal line, confirming that downward momentum is still dominant. However, the shrinking red histogram bars suggest that bearish momentum is beginning to slow, although buyers have not yet gained enough strength to reverse the trend.
The nearest resistance is at $0.0300, followed by a stronger barrier around $0.0320. On the downside, immediate support remains at the recently established all-time low of $0.02768. If bears force a break below this level, Sonic could face another low as price discovery continues.
Sonic technical indicators: Levels and action
Daily simple moving average (SMA)
Moving averages are calculated from the average closing price over a set period.
Period
Value
Action
SMA 3
$ 0.03570
SELL
SMA 5
$ 0.03739
SELL
SMA 10
$ 0.03926
SELL
SMA 21
$ 0.04228
SELL
SMA 50
$ 0.04407
SELL
SMA 100
$ 0.04316
SELL
SMA 200
$ 0.06032
SELL
By June 29, 2026, Sonic’s 200-day Simple Moving Average is projected to drop to $0.05181, while the 50-day SMA is estimated to reach $0.03714.
Daily exponential moving average (EMA)
Period
Value
Action
EMA 3
$ 0.03547
SELL
EMA 5
$ 0.03674
SELL
EMA 10
$ 0.03885
SELL
EMA 21
$ 0.04130
SELL
EMA 50
$ 0.04328
SELL
EMA 100
$ 0.04941
SELL
EMA 200
$ 0.08657
SELL
What can you expect from the Sonic price analysis next?
Sonic remains in a corrective trend, but Sonic’s price action is showing early signs of stabilization around the $0.0290 level, and many traders use candlestick charts to assess momentum. Each candlestick shows the opening, closing price, highest, and lowest prices for a chosen interval, helping analysts determine whether support is holding or a rebound may follow.
A successful defense of the $0.02768 support level could allow the token to recover toward $0.0300 and potentially $0.0320 in the coming sessions, according to Sonic key price levels and recent market activity. On the downside, a break below the all-time low of $0.02768 would likely expose Sonic to further weakness, with sellers attempting to establish new lower levels.
In a relatively small market, whales can control short-term moves. Until buyers reclaim the $0.0300–$0.0320 resistance zone, the overall market structure remains bearish despite oversold conditions appearing on technical indicators.
Why is Sonic down today?
Sonic (S) is trading around, down 12.44% over the last seven days, suggesting the broader trend remains bearish despite today’s modest recovery. With no major news catalyst driving recent price action, the decline appears to be due to typical altcoin volatility and profit-taking following earlier gains.
Is Sonic a good investment?
Sonic is a high-speed, scalable blockchain platform that competes with established chains such as Solana and Ethereum L2s, positioning itself as a performance-focused chain within the blockchain ecosystem. Despite its potential, investing in Sonic (S) involves risks typical of cryptocurrencies, including market volatility, so any current forecast should weigh whether it looks like a good buy right now.
While Sonic does not currently lead the market, it maintains a credible and stable position as a reliable, mid-tier chain. Sonic (S) network is also transitioning from a community-driven layer-1 to a more structured corporate model, which investors should factor in before they invest. Own research and assessing personal risk tolerance are essential for anyone considering S as a potential investment opportunity.
Will Sonic reach $5?
The price of Sonic could reach $0.1215 by 2030, with price predictions suggesting a high of $0.1678. The base case scenario for Sonic’s price by 2030 is projected to be around $0.1215, with potential highs depending on market conditions. However, achieving this depends on market conditions, overall technical factors, and fundamental factors.
Will Sonic reach $10?
Based on our technical analysis of multiple technical quantitative indicators, S’s price projections for 2032 estimate a range, with Sonic expected to reach about $0.2967 but not approach double-digit prices within the next 6 years. A move to $10 is not guaranteed; even by 2046, Sonic is expected to reach $0.8797, still far below $10 and requiring over 25,386% upside to hit that mark.
Is Sonic a safe network?
Sonic is regarded as a secure blockchain platform whose architecture differs from traditional blockchains, using its unique Lachesis consensus mechanism to enable high-speed, scalable transactions.
Its directed acyclic graph approach helps deliver theoretical throughput of up to 10,000 transactions per second with finality in less than 500 milliseconds. However, as with any blockchain network, users should exercise caution, use official channels, and follow best security practices to protect their assets.
Does Sonic have a good, long-term future?
Sonic shows potential for a strong long-term future, with price predictions suggesting significant growth by 2030 and beyond. Analysts forecast prices could reach between $0.1215 and lowest prices at $0.1678, driven by its unique blockchain technology, increasing adoption in decentralized applications, and robust ecosystem growth.
Ecosystem growth, fueled by increased developer activity and more developers joining the platform, is crucial for Sonic’s long-term success. Total Value Locked (TVL) in dApps is a critical metric for long-term growth, reflecting real-world usage and platform strength. Sonic also continues airdrop campaigns and support for liquid staking tokens to help boost TVL and revenue generation.
Additionally, the Sonic ecosystem has established a $25 million fund to attract builders and improve user metrics, further supporting future expansion. Future ecosystem expansion may also benefit from plans to pursue a Spot ETF and private investment vehicles on Nasdaq, though the long-term impact remains uncertain. However, market volatility remains a concern.
Recent news/opinion on Sonic (prev. FTM)
Sonic recently expanded its ecosystem focus through infrastructure and security upgrades, including USDC integration support and new stablecoin functionality via Flying Tulip. The developments aim to strengthen Sonic’s position as a developer-friendly EVM chain while improving on-chain utility and security, even as the token continues facing bearish pressure in the broader crypto market.
Sonic recently highlighted the growing adoption of its vertical integration model. The network revealed that its USSD stablecoin is generating approximately $80,000 in annualized real-world asset (RWA) yield without incentives, while Shadow’s AutoVault has already purchased around 350,000 S tokens through market activity.
Vertical integration on Sonic is moving from concept to data.
With zero incentives, $USSD is at ~$80K annualized RWA yield, while @ShadowOnSonic‘s AutoVault has already bought ~350K $S from market activity.
The Sonic price prediction for June 2026 suggests a modest recovery from current levels, with the price expected to range between $0.02881 and $0.03259. The average price is projected to be around $0.03259, as market sentiment, trading volume, and broader crypto market conditions continue to influence short-term price action.
Period
Potential Low ($)
Average Price ($)
Potential High ($)
Sonic (S) price prediction June 2026
$0.02881
$0.03259
$0.03259
Sonic price prediction 2026
In 2026, Sonic (S) is expected to trade between $0.02750 and $0.03789, with an average price of around $0.03270. This suggests relatively stable price action throughout the year, with modest upside potential if ecosystem growth and market sentiment improve.
Period
Potential Low ($)
Average Price ($)
Potential High ($)
Sonic Price Prediction 2026
$0.02750
$0.03270
$0.03789
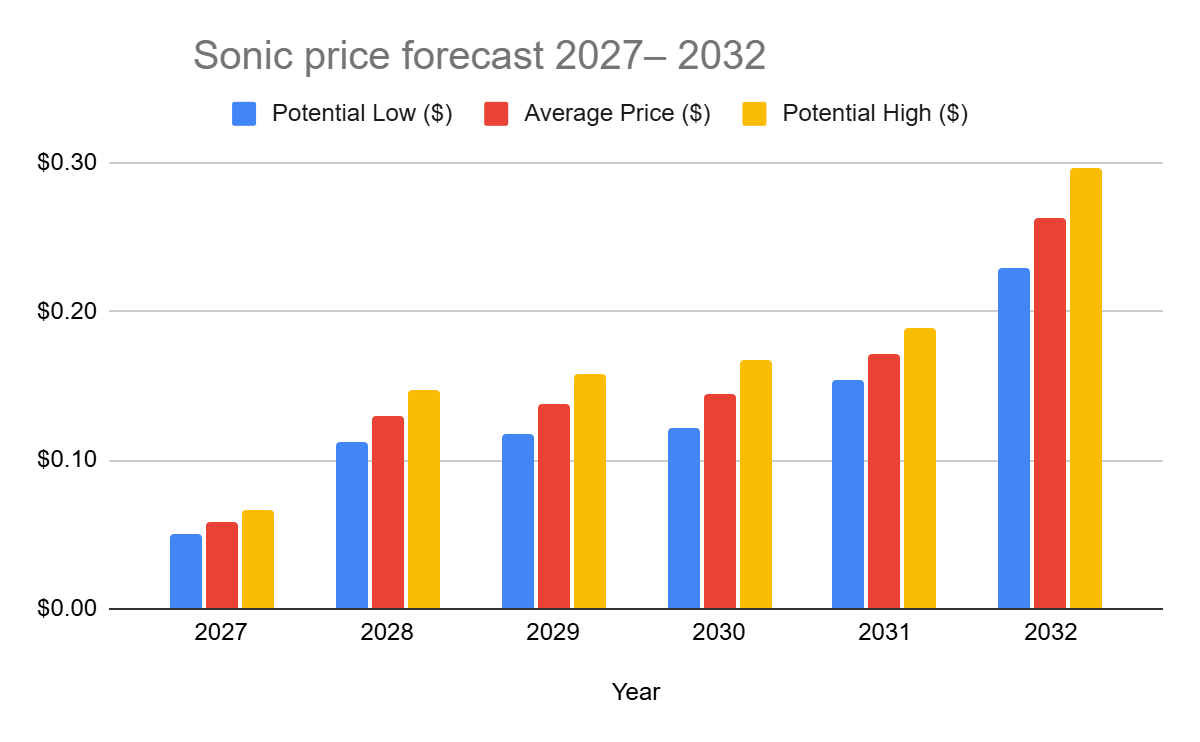
Sonic price forecast 2027– 2032
price prediction chart
Year
Potential Low ($)
Average Price ($)
Potential High ($)
2027
$0.0499
$0.0581
$0.0662
2028
$0.1128
$0.1296
$0.1465
2029
$0.1169
$0.1372
$0.1574
2030
$0.1215
$0.1446
$0.1678
2031
$0.1545
$0.1717
$0.1889
2032
$0.2285
$0.2626
$0.2967
Sonic (S) price prediction 2027
The Sonic forecast for 2027 speculates that the price might reach a maximum of $0.0662 by 2027. On the lower end, corrections may pull the price to $0.0499 with an expected average trading price of around $0.0581. As an alternate modeled scenario, the predicted price for 2027 could be around $0.03998, representing a potential 1.90% increase.
Sonic (S) price prediction 2028
Sonic’s (prev. FTM) 2028 forecast of $0.1128–$0.1465, averaging $0.1296, is linked to growing adoption of its rebranded ecosystem. By then, expanded DeFi, NFT, and gaming use cases are expected to strengthen utility and demand. The projected rise in Sonic’s price by 2028 is supported by its Fee Monetization model and the fee burning mechanism, which incentivize developer activity and reduce token supply. Network scalability upgrades and rising developer engagement support gradual appreciation, while market cycles keep growth within range.
Sonic (S) price prediction 2029
In 2029, Sonic’s market price might stabilize at $0.3238 while attaining an average trading price of around $0.2698, and a minimum price of around $0.2158. The broader outlook points to $0.03250 by the end of 2026, $0.1464 by 2030, and $0.2327 by 2040, based on combined technical and fundamental factors.
Sonic (S) price prediction 2030
Sonic is expected to reach a maximum of $0.1678 by 2030. However, it could fall to $0.1215 with an average price of $0.1446.
Sonic (S) price prediction 2031
Sonic is projected to hit a high of $0.1889 in 2031. In the event of a price correction, it could drop to $0.1545 with an average of $0.1717
Sonic (S) price prediction 2032
Sonic is expected to reach a high of $0.2967 in 2032. The average trading price is expected to be $0.2626, and the minimum price is projected to be $0.2285.
Sonic price prediction 2026-2032
Sonic market price prediction: Analysts’ FTM price forecast
Firm Name
2026
2027
Coincodex
$ 0.02589
$ 0.06573
DigitalCoinPrice
$ 0.03189
$0.0817
It’s important to note that these analyst forecasts may be influenced by broader market rallies and shifts in market sentiment, which can drive Sonic’s price targets higher or lower depending on overall investor optimism or pessimism.
Cryptopolitan’s Sonic (S) price prediction
Our predictions show that the Sonic token could achieve a minimum value of $0.02750 in 2026. The Sonic price may reach a maximum value of $0.03789, with an average trading price of $0.03270 throughout 2026. Investor confidence, along with supply and demand dynamics, plays a key role in Sonic’s price action.
Fundamental events such as hacks and other real-world occurrences can significantly impact price movements. Please note that the content provided on this page is for informational purposes only and does not constitute investment advice. Conduct your own research before making financial decisions
Sonic’s (S) historic price sentiment
Sonic price history
Fantom (FTM) launched in 2018 at $0.0182, hit a low of $0.00229 in 2020, and peaked at $3.24 in 2021 during the DeFi boom.
Following the 2022 bear market, FTM recovered to $0.55 by early 2024 before rebranding to Sonic Labs in August 2024.
The 1:1 FTM-to-Sonic (S) token swap began in December 2024, with Binance completing it by January 2025.
Sonic hit a new ATH of $1.029 in January 2025, but steadily declined to around $0.33 by late August.
By early September 2025, Sonic traded stably between $0.3092 and $0.3126.
Early September, Sonic traded around $0.309–$0.313, showing relative stability compared to its August lows.
Mid-September – Price remained in the ~$0.30–$0.33 band, with minor upward drift toward ~$0.32.
Late September – The token approached $0.26, as reported by markets, showing a decline and increased volatility.
Early October – Trading price dropped further into the ~$0.23–$0.26 range, indicating a weakening trend.
By November 3, Sonic had fallen to approximately $0.122, marking a substantial decline from early September levels.
At the beginning of November 2025, Sonic (S) traded around $0.12–$0.14, occasionally spiking to roughly $0.17 before retreating.
Through mid-November, the price generally drifted downward, reaching a low near $0.10–$0.11 around November 21.
From late November to December 3, S recovered slightly — trading in a narrow band around $0.10–$0.11, suggesting consolidation and stabilization after the mid-month slump.
From early December, Sonic traded around $0.071–$0.075 on Dec 3–Dec 6, then moved higher through mid-December as the price climbed into the $0.085–$0.095 zone by Dec 14–Dec 17, reflecting increasing buying interest late in the year.
Into late December and early January, S stabilized in the $0.07–$0.08 range before rising above $0.08, closing around $0.082–$0.086 by Jan 4 2026, showing a modest recovery into the new year.
On January 4, 2026, Sonic was trading near $0.086–$0.090 after stabilizing from December weakness, with modest rebounds in the first week of January as buyers emerged off key support levels.
By February 3, 2026, Sonic had drifted lower toward roughly $0.065–$0.070, reflecting continued selling pressure and failed rallies, with price consolidating near the low end of its recent range.
Sonic (S) traded around $0.052 to $0.048 between Feb 3 and Feb 10, 2026, before declining toward the $0.041 to $0.039 range by late February amid steady selling pressure.
From early March to Mar 14, 2026, Sonic moved between $0.038 and $0.044 with a gradual rebound attempt as the price stabilized near the $0.040 support zone.
From March 14 to late March, Sonic drifted lower from $0.0514 toward $0.040–$0.042, unable to sustain any meaningful bounces amid broad market weakness.
By April 7, its price pressed critical $0.040 support at $0.0396–$0.0414 — dangerously close to its all-time low of $0.0368 set on February 28.
Sonic is trading at around $0.04951 at the start of May 2026.
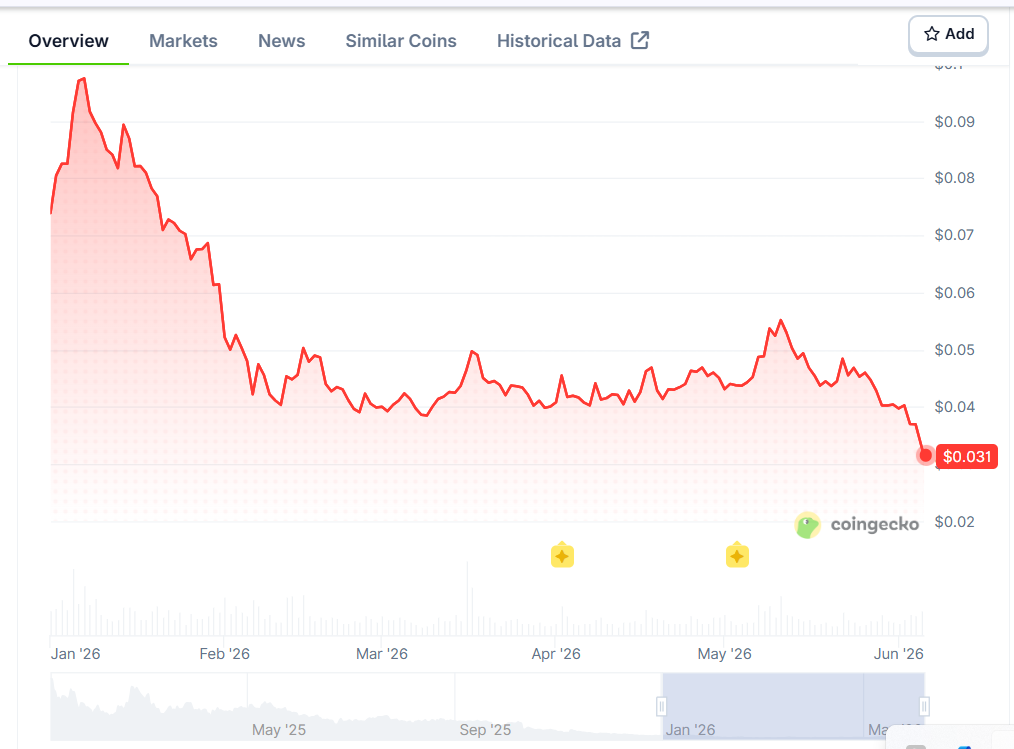
By the end of May 2026, Sonic had retreated to around $0.040, erasing much of its early-May gains after a failed rally above $0.055 and stabilizing near a key support zone amid continued selling pressure.
At the start of June 2026, Sonic traded around $0.03136, extending its decline after losing the key $0.040 support level in late May.
Our Aptos price prediction anticipates a high of $5.54 by the end of 2026.
In 2028, it will range between $19.33 and $25.91, with an average price of $20.18.
In 2030, it will range between $79.95 and $99.65, with an average price of $82.60.
The Aptos blockchain has aggressively attracted capital into its ecosystem, with its total value locked (TVL) rising above $275 million.
Aptos is a high-performance layer-1 blockchain with a mature ecosystem of decentralized finance (DeFi) applications.
Aptos network continues to build decentralized applications and tools for developers. But how about APT’s performance? How high will it go? Is APT a good investment? Let’s explore these questions in our Cryptopolitan price predictions from 2026 to 2032.
Overview
Cryptocurrency
Aptos
Symbol
APT
Current price
$0.9501
Aptos crypto market cap
$778.84M
Trading volume
$89.9M
Circulating supply
819.72M
All-time high
$19.90 on Jan 30, 2023
All-time low
$0.7926 on Feb 23, 2026
24-hour high
$0.951
24-hour low
$0.8908
Aptos price prediction: Technical analysis
Metric
Value
Volatility (30-day variation)
5.79%
50-day SMA
$0.9699
200-day SMA
$1.37
Current APT sentiment
Bearish
Green days
15/30 (50%)
Fear and Greed Index
23 (Extreme Fear)
Aptos price analysis
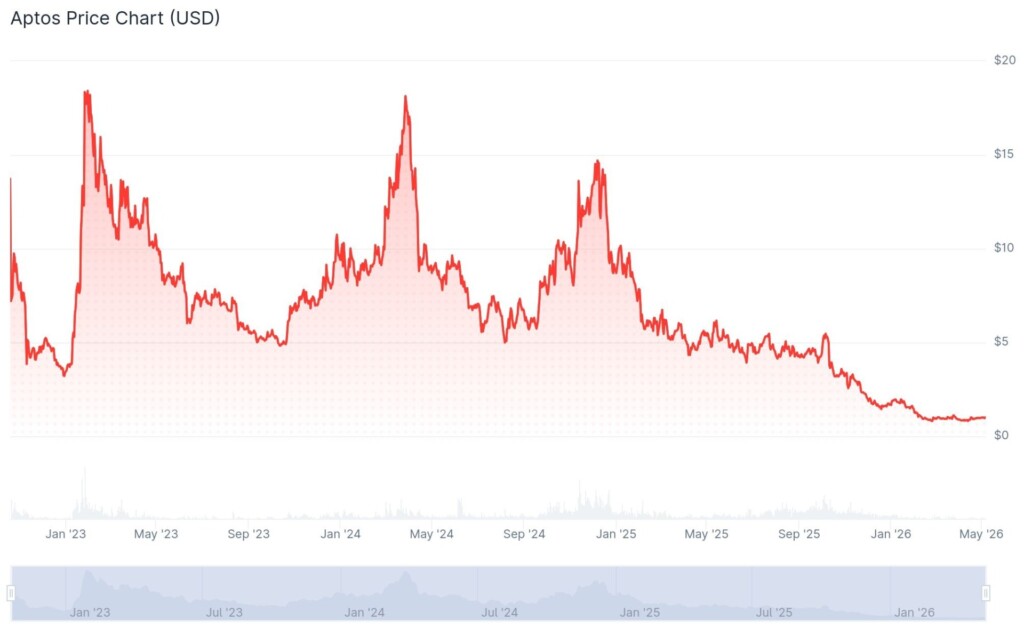
At press time, May 29, Aptos had crossed below $1.00, up 0.83% in 24 hours and down 3.36% in 30 days. Its trading volume fell by 15.10% over the last 24 hours to $86 million.
The MACD histograms show APT run this week was driven by little momentum. The move came after APT corrected from its highest this month at $1.239. Its relative strength index (RSI) is in neutral territory (45.69). It is oversold when the value drops below 30.
The chart highlights APT’s run this month. The latest candle formation is suggestive of a bullish continuation. Its momentum, however, remains negative, limiting further gains below $1.00. The $1 mark is the pivot level above which APT could rise to $1.20. A reversal would send it back to the April lows at $0.80.
Aptos technical indicators: Levels and action
Daily simple moving average (SMA)
Period
Value ($)
Action
SMA 3
0.9523
SELL
SMA 5
0.9537
SELL
SMA 10
0.9529
SELL
SMA 21
1.00
SELL
SMA 50
0.9699
SELL
SMA 100
0.9524
SELL
SMA 200
1.37
SELL
Daily exponential moving average (EMA)
Period
Value ($)
Action
EMA 3
0.9475
SELL
EMA 5
0.9512
SELL
EMA 10
0.9591
SELL
EMA 21
0.9734
SELL
EMA 50
0.9808
SELL
EMA 100
1.09
SELL
EMA 200
1.60
SELL
What to expect from the APT price analysis next?
According to the technical indicators, APT is bearish. Over the short term, the charts show APT broke out to the downside, supported by negative market momentum. There is support at $0.09, which, if broken, could send APT to $0.08; otherwise, $1.20 is a likely target if the market reverses.
Why is Aptos down?
There is widespread altcoin weakness, with technical breakdowns detected across several major tokens, including APT, triggering sell signals and momentum loss.
Will Aptos reach $10?
Yes, Aptos will rise above $10 in 2027. The move will come as the market corrects to previous highs.
Will Aptos reach $100?
According to the Cryptopolitan price prediction, Aptos will reach $100 in 2032.
Will Aptos reach $1000?
Per the Cryptopolitan price prediction, it remains unlikely that Aptos will get to $1000 before 2032.
What is the long-term price prediction for Aptos?
According to Cryptopolitan price predictions, Aptos will trade higher in the years to come. However, factors such as market crashes or stringent regulations could invalidate this bullish theory.
How high can Aptos coin go?
Per the Cryptopolitan price prediction, Aptos will reach a high of $146 in 2032.
Recent news
The Aptos community passed a proposal to introduce deflationary tokenomics in a vote that ended on March 1. The change sets a hard cap on the total supply of APT tokens at 2.1 billion, aligning with a broader shift towards performance-driven tokenomics.
Aptos price prediction May 2026
The Aptos price forecast for May ranges from a minimum of $0.82 to a maximum of $1.40. The average price for the month will be $0.94.
Month
Potential low ($)
Potential average ($)
Potential high ($)
May
0.82
0.94
1.40
Aptos price prediction 2026
For 2026, APT’s price will range between $0.85 and $3.54. The average price for the period will be $2.72.
Year
Potential low ($)
Potential average ($)
Potential high ($)
2026
0.85
2.72
3.54
APT price prediction 2027–2032
Year
Potential low ($)
Potential average ($)
Potential high ($)
2027
5.59
11.18
14.84
2028
19.33
20.18
25.91
2029
34.08
35.59
40.67
2030
54.42
56.24
67.14
2031
79.95
82.60
99.65
2032
121.21
125.84
145.97
Aptos price prediction 2027
The Aptos APT price prediction estimates it will range between $5.59 and $14.84, with an average price of $11.18.
Aptos price prediction 2028
Aptos coin price prediction climbs even higher into 2028. According to predictions, APT’s trading price will range from $19.33 to $25.91, with an average price of $20.18.
Aptos price prediction 2029
Our analysis indicates a further acceleration in APT’s price. It will trade between $34.08 and $40.67, with an average price of $35.59.
Aptos price prediction 2030
According to the Aptos forecast for 2030, the APT price will range from $54.42 to $67.14, with an average of $56.24.
APT price prediction 2031
According to the Aptos price prediction for 2031, the price will range between $79.95 and $99.65, with an average of $82.60.
Aptos price prediction 2032
The Aptos price prediction for 2032 is a high of $145.97. It will reach a minimum price of $121.21 and an average price of $125.84.
Our predictions indicate that APT will reach a high of $5.54 by the end of 2026. In 2028, it will range between $19.33 and $25.91, with an average of $20.18. In 2031, it will range between $79.95 and $99.65, with an average price of $82.60. Note that the predictions are not investment advice. Seek independent professional consultation or do your research.
Aptos raised seed funding in January 2022, led by a16z. Series A funding included Apollo, Dragonfly, Franklin Templeton, and others.
Some members previously worked on the Diem blockchain, a project proposed by Facebook.
The Aptos mainnet launched in October 2022 with an initial supply of 1 billion tokens.
After the launch hype, Apt fell to its lowest in December 2022, at $3.09. A month later, the tables turned, as it peaked at $19.90 on January 30, 2023.
It pumped, partly driven by the NFT market. Collections such as Aptos Monkeys and Aptomingod have attracted more users.
On June 6, it fell below its initial listing price, extending losses from the preceding months.
In October, it began correcting, rising to $8.47 in November.
In 2024, it broke above $10, reaching $18 in March. From April, it reversed, falling below $10. By September, it had fallen to $6. It recovered in October, rising above $7.50. It crossed into November, trading at $8.9, and rose to $13.91. It corrected and traded at $13.24 into December.
It was later corrected and crossed into 2025, trading at $8.71. The drop continued into February, and in May, it fell below $5.10.
In October, it crossed above $5.30, then assumed a bear run, and by November, it had dropped to $3.21. In December, it reached support levels at $1.70. It maintained the levels into January 2026.
Later, it turned bearish, falling below $1 in March and $0.90 in April. In May, it rose back above $1.00.
Ethereal Ventures: Blockchain Is Now the Backend for Global Finance
Crypto Coin Show · Market IntelligenceMay 2026
Venture Capital · Research Report
Ethereal Ventures: Blockchain Is Now the Backend for Global Finance
In its Q1 2026 market insights report, Ethereal Ventures maps five core metrics — dealflow, tokenized real-world assets, payments volume, protocol fees, and token holder distributions — to argue the on-chain migration of traditional finance has barely started.
Ethereal Ventures’ Q1 2026 Digital Asset Market Insights report opens with a blunt thesis: the five metrics it tracks — dealflow composition, tokenized real-world assets, blockchain payments, on-chain protocol fees, and value returned to token holders — all point toward an industry that has moved well past proof-of-concept and into the early innings of genuine financial infrastructure adoption.
The headline number is $29.3 billion in real-world assets now tokenized on-chain, representing a 30× increase over four years. Impressive on its face — until Ethereal frames it against US equity market capitalization, where it represents less than 0.05%. Their conclusion: the migration has barely started.
01Where Founders Are Betting Their Time
Dealflow composition is the leading indicator Ethereal trusts most, on the premise that founders are the best arbiters of where value will compound. This quarter’s inbound pipeline tells a clear story.
32%
AI
20%
DeFi
8%
Payments
6%
Prediction Markets
5%
Applications
5%
Stablecoins
Key Insight
AI is drawing the bulk of talent and capital — but the parallel story is blockchains maturing into the API backend for payments and broader financial activity. Stablecoins and payments are one slice of that compounding interest, as the rails for on-chain commerce keep maturing.
02Real-World Assets: 30× in Four Years
Tokenized real-world assets — the canonical measure of how much traditional finance has actually moved on-chain — reached $29.3 billion as of April 13, 2026. US Treasuries lead the composition, followed by commodities and asset-backed credit. The growth trajectory is steep: +46% in one year, +266% over two years.
Asset Class
Description
Value On-Chain
US Treasury Debt
Tokenized government bonds — leading category
$13.4B
Commodities
Gold, silver, and physical asset-backed tokens
$5.4B
Asset-Backed Credit
Private credit structured on-chain
$3.1B
Specialty Finance
Structured lending and receivables
$1.5B
Non-US Govt Debt
Sovereign bond tokenization outside the US
$1.2B
Stocks
Equity tokenization on public blockchains
$1.0B
Active Strategies
On-chain managed funds and yield vaults
$919M
Venture Capital
Tokenized fund positions and LP interests
$818M
Corporate Credit
Tokenized corporate bonds
$716M
Real Estate
Property fractionalization and REITs on-chain
$297M
Total RWA On-Chain
$29.3B · +30× in 4 years
The Ethereal framing is important here: $29.3B is not a failure to scale, it is a starting line. US equities alone represent roughly $50 trillion. Tokenized assets at current levels are a rounding error — but the infrastructure to absorb orders of magnitude more institutional capital is, by Ethereal’s read, now mature enough to do it.
03Stablecoin Payments: $390 Billion Annualized
Monthly stablecoin payment volume has tripled over three years to $10 billion per month, driven primarily by B2B settlement flows. McKinsey and Artemis data cited in the report puts full-year 2025 stablecoin payment volume at $390 billion annualized once B2B custody flows and cross-border remittances are included.
“+3× in three years to $10bn/mo, against Visa and Mastercard’s mid-single-digit CAGR.”
The comparison to card networks is deliberate. Visa and Mastercard process roughly $2.27 trillion per month combined. Blockchain-based payments are at less than 0.5% of that — but the unit economics of on-chain settlement improve with scale in ways the card stack structurally cannot match. Ethereal’s projection: the first $1 trillion per month arrives via B2B capture; consumer flows follow as embedded wallets reach mainstream apps.
$390B
2025 Annualized Volume
+3×
Growth Over 3 Years
$2.27T/mo
Visa + Mastercard Target
04Protocol Fees: The Bear-Cycle Floor Keeps Rising
Daily protocol fees — the metric that strips away token price noise to show what users are actually paying to use blockchains — have established a structural floor of $50 million per day, holding through every major market drawdown since 2020. The 30-day moving average currently runs above that floor.
Key Insight
Zero to $50mm/day in six years at the bear-cycle floor. The baseline keeps ratcheting up regardless of price action — the clearest signal that demand is structural, not reflexive.
Ethereal projects fees scaling on two compounding curves: surface area (more product categories entering DeFi — prediction markets, perp DEXes, on-chain credit, RWA distribution) and intensity (institutional users transacting in larger size, with higher willingness to pay for settlement finality). Their target: a $500 million per day baseline.
05Token Holders Are Starting to Look Like Shareholders
Perhaps the most structurally significant finding in the report: capital returned to token holders has tripled since 2024, now running at 15–22% of protocol revenue versus 4–7% across 2022–2024. The shift is being led by Hyperliquid, whose 99%-of-fees buyback model has become the benchmark the rest of the industry is now measured against.
The implication, if the trend continues: tokens stop trading as speculative commodities and begin pricing like cash-flowing assets, attracting a fundamentally different and larger buyer base — one that includes traditional equity investors currently sitting on the sidelines.
06Six Predictions: Where We Are vs. Where We’re Going
The report closes with six explicit prediction pairs — current state versus projected destination — that frame Ethereal’s investment thesis for the next three to five years.
Money on Blockchains · Now
~$480B on-chain
↓ TRAJECTORY
Projected Destination
Majority of US M2 ($21.7T)
Stablecoin Payments · Now
$10B / month
↓ TRAJECTORY
Projected Destination
Visa + Mastercard stack ($2.27T/mo)
Companies Using Blockchains · Now
~38% of SMBs
↓ TRAJECTORY
Projected Destination
~100% of companies touching finance
DeFi Daily Active Users · Now
~300K DAU
↓ TRAJECTORY
Projected Destination
>30M DAU via embedded wallets
Protocol Fees · Now
$50M/day floor
↓ TRAJECTORY
Projected Destination
$500M/day baseline
Value to Token Holders · Now
15–22% of revenue
↓ TRAJECTORY
Projected Destination
Majority of fees flowing to holders
07Where Ethereal Sees the Next Breakthroughs
The report’s outlook section categorizes emerging opportunities across three buckets: new market infrastructure, TAM overhauls where AI is rewriting addressable markets, and blue ocean frontiers with undefined outcome shapes.
Bucket 01New Market Infrastructure
The New Intent Exchange
A neutral matching layer beneath AI agent platforms where merchants compete on price for commercial intent, settled in stablecoins.
Agentic Commerce Risk Rails
Programmable spending limits and on-chain escrow built for agent transactions — reversibility designed in, not retrofitted.
Parametric Insurance On-Chain
Instant-payout policies for measurable events: weather delays, satellite launches, AI SLA failures.
Supply-Chain Disintermediation
Agent-queryable factory profiles, attested quality data, and stablecoin settlement collapsing 40–80% intermediation margins in global retail.
Bucket 02TAM Overhauls
Agent Payments and Stablecoins
Agents can’t open bank accounts but can hold wallets. Agent-to-agent flows are the most open frontier, needing new micropayment frameworks at machine speed.
AI Fraud Defense
The next fraud stack moves from scoring events to verifying actors — portable, privacy-preserving credentials that prove identity once and plug in anywhere.
Devtools Are Now Mainstream Tools
Agentic engineering exploded what was historically a tiny market. The durable layer: tooling where the customer is the agent and the human is out of the loop entirely.
The Crypto Credit Highway
Crypto wins as rails between capital pools and origination, not as a replacement underwriter. Wedge: SMB/B2B lending where stablecoin escrow enables new cashflow mechanics.
Bucket 03Blue Oceans
Machines as Autonomous Companies
A progression from AI-native funds to agents running companies end-to-end, dispatching humans to perform tasks via real-time capital flows.
Proof-of-Human Traffic Bifurcation
Publishers charge agents at scale via micropayments; verified humans browse for free. A new content monetization stack for the post-AI-flood web.
Markets for Scarce Rights
Tokenization and dispute resolution for bureaucratically-gated rights: satellite slots, drone air corridors, spectrum bonds, congestion pricing.
Agent-Native Trust and Reputation
A canonical, queryable trust profile for suppliers, merchants, and services — built on machine-readable signals like fulfillment rates and certified quality attestations.
The full Ethereal Ventures Q1 2026 report is available on their Substack: The Maturation of the On-Chain Economy. All figures sourced from RWA.xyz, Artemis, DefiLlama, and McKinsey × Artemis (Feb 2026).
Hyperliquid (HYPE) recently broke into the top 10 cryptocurrencies by market capitalization, sitting alongside top players like Bitcoin (BTC) and Ethereum (ETH), after its price surged past $50 and set a new all-time high. Now, on-chain analytics platforms are showing what HYPE’s ultimate price could become if it surpasses Ethereum’s market cap.
Hyperliquid’s ATH Price If It Surpasses Ethereum’s Market Cap
Hyperliquid skyrocketed past $50 a few days ago, surpassing Dogecoin’s ranking to take the 9th spot as one of the largest cryptocurrencies in terms of market capitalization. The move marks the first time the token has traded above this zone since late October 2025.
Currently, HYPE has extended its rally well beyond $60. The breakout reflects a strong shift in trading activity around the token, as well as renewed interest and confidence in DeFi protocols and AI-backed tokens. HYPE’s move back into this historic price range also suggests that traders and investors are once again engaging more actively with Hyperliquid’s perpetual futures DEX.
Interestingly, the recent rally in the HYPE price has brought renewed focus on Ethereum, one of Hyperliquid’s biggest crypto and DeFi rivals. While Ethereum remains a dominant benchmark for decentralized applications, Hyperliquid is designed specifically for financial trading and derivatives.
Nevertheless, data from Marketcapof has revealed how high HYPE’s price could reach if its market capitalization of $15.99 billion surpasses Ethereum’s, which is around $250.99 billion. Projections indicate the token could move well beyond its previous all-time high, potentially reaching approximately $1,127, marking a 17.92x from present levels.
At more extreme ATH levels, where market euphoria is likely at its peak, estimates place HYPE as high as $2,633. This would represent a gain of about 42x from current prices, underscoring the scale of the cryptocurrency’s potential upside.
Competition Intensifies As HYPE Captures More ETF Inflows Than ETH
Before recording an ATH, Hyperliquid has been strengthening its market position as capital continues to rotate away from major legacy assets like Bitcoin and Ethereum toward newer, high-growth protocols. HYPE’s recent performance reflects both rising adoption of its DEX platform and a broader shift in liquidity across the crypto sector.
A key driver behind the bullish momentum was the launch of spot HYPE ETFs by investment management firms Bitwise and 21Shares in May. The products have attracted millions of dollars in inflows, underscoring steady institutional demand for HYPE amid heightened derivatives activity.
Earlier in the year, market volatility linked to the US-Iran war triggered record perpetual futures volume on Hyperliquid, pushing activity on the platform to new highs. Liquidity conditions also improved after Coinbase, the world’s largest crypto exchange, became the official USDC provider on Hyperliquid.
Against this backdrop, Ethereum dominance is waning significantly. The cryptocurrency’s price has struggled to maintain momentum, falling roughly 30% year-to-date. ETF flow data reflects this shift, with about $1 billion exiting Bitcoin and Ethereum products while XRP and HYPE funds recorded about $94 million in combined inflows.
Bankless co-founder David Hoffman said he sold his Ether holdings because he believes the long-standing “ETH is money” thesis has already largely played out. Despite this, he remains strongly bullish on Ethereum as a network.
According to Hoffman, the decision did not come lightly, given that he built his career, business, community, and identity around Ethereum.
Ethereum Chose the Hard Path Unlike Bitcoin
In his latest tweet, Hoffman stated that the “ETH is money” thesis depended on Ethereum succeeding across multiple layers of coordination, including decentralized leadership, governance, Layer 2 ecosystems, roadmap execution, and technological development.
Hoffman described Ethereum as “not Bitcoin,” and said that Bitcoin simplified its blockchain to maximize the value of BTC, while Ethereum pursued a more ambitious path by expanding utility across decentralized applications, finance, tokenization, and infrastructure. He even went on to add that Ethereum achieved part of that vision and earned the market capitalization it currently has, but said the opportunity for ETH to be significantly rerated higher by the market now appears to be closing.
The Bankless co-founder also explained that the broader “strong version” of crypto, which focused on decentralized finance, NFTs, DAOs, and crypto-native systems, failed to maintain long-term mainstream support outside the 2020 to 2022 period. He said crypto’s reputation later became associated with scams, grifts, and speculative behavior, which ended up weakening the social belief system required for ETH to function as money at a global scale.
He further stated that Ether’s utility increasingly benefits other forms of money, especially stablecoins and tokenized dollars, rather than ETH itself. Hoffman described Ethereum as a “giver, not a taker,” while saying that the network provides secure blockspace, tokenization infrastructure, and DeFi support at minimal cost rather than extracting maximum value for ETH holders. He said Ethereum’s architecture prioritizes applications, rollups, and ecosystem growth over ETH itself, which makes it difficult for the underlying crypto asset to fully achieve global money status without overwhelming market dominance.
Ethereum in Crisis?
Hoffman’s decision also comes at a time when bearish sentiment around Ethereum has been intensifying. A recent report by Santiment found that social media discussions have increasingly shifted from optimism toward frustration and concerns about further downside.
The analytics firm said traders have increasingly viewed ETH as “dead money” compared to stronger-performing crypto assets in 2026, as weakening ETF flows, declining on-chain activity, and growing competition from ecosystems such as Solana and BNB Chain added pressure on sentiment.
Rumors about prominent Ethereum figures reducing or exiting ETH positions, including discussions surrounding Hoffman, have also contributed to rising uncertainty in the market, especially as traders worried about insiders losing confidence in the asset.
Chainlink continues to strengthen its dominance within the oracle economy as adoption of its Smart Value Recapture (SVR) solution accelerates across the DeFi ecosystem. With decentralized finance increasingly reliant on accurate, secure, and tamper-resistant data feeds, Chainlink remains at the center of this infrastructure layer, powering a growing share of on-chain applications.
Why SVR Could Become A Major Revenue Layer For Chainlink
Since Chainlink launched, Smart Value Recapture (SVR) has rapidly become the dominant solution for capturing oracle-related Maximal Extractable Value (MEV), now commanding an estimated 99% market share. Crypto analyst Zach Rynes highlighted on X that the system has been widely adopted by the largest DeFi lending platforms such as Aave, Compound, Venus, and various Morpho markets.
At its core, the SVR exclusively recaptures the non-toxic liquidation MEV of value that would have leaked to Layer 1 validators and searchers during DeFi loan liquidations. The scale of adoption is already producing significant results. SVR has reportedly generated approximately $18.7 million in revenue, distributing approximately $12 million back to integrated DeFi protocols while contributing $6.7 million to Chainlink, including support for LINK buybacks.
Meanwhile, the system efficiency is reflected in its consistent recapture rate of about 85%, meaning SVR recaptures the $85 from every $100 liquidation bonus made available. It has already processed over $700 million in liquidation volume on Aave alone, without generating bad debt, even during periods of heightened volatility such as October 10. Additionally, it also features the largest and most decentralized ecosystem of independent searchers, with over 115 independent liquidators. Competition ensures solvency and drives up recapture rates.
SVR marks a major shift in the Chainlink business model, enabling it to directly monetize the total value it secures across DeFi applications, in addition to monetizing the integration, usage, and maintenance of oracle services by blockchains via the Scale program. In this context, SVR is a powerful new economic engine that reinforces the Chainlink position at the center of decentralized finance.
Chainlink’s Staking Model Awaits A Clear Regulatory Framework
The Chainlink staking ecosystem could be approaching a pivotal moment as the crypto industry moves closer to greater regulatory clarity. According to analyst LinkBoi, the current Clarity Art is limiting Chainlink’s ability to expand staking pool rewards distribution within the network.
Currently, stakers are receiving incentives primarily through allocated token emissions rather than a share of protocol-generated revenue. The staking pool expansion requires permission to pay stakers a portion of the protocol’s revenue.
However, if the Clarity Act provides the necessary legal clarity, it would unlock a major opportunity for the LINK token to be considered as a security. The staking pool could expand significantly, bringing the full LINK tokenomics ecosystem into effect.
Asset manager Bitwise is set to launch an exchange-traded fund tracking Hyperliquid’s native HYPE token.
The ETF will start trading on May 15 under the ticker BHYP on the New York Stock Exchange (NYSE).
Capitalizing on Hyperliquid’s Growth and Dominance
Bitwise said that BHYP is the first HYPE ETF to use an in-house staking infrastructure, with the firm adding that the fund was designed to give investors a convenient and low-cost way to participate in Hyperliquid’s growth. Reacting to the development, Galaxy’s head of DeFi, Marc Antonio, wrote, “Damn Matt Hougan and Bitwise are cooking.”
DeFi Llama data shows that Hyperliquid makes up about 60% of global on-chain perpetual DEX open interest, with the network being capable of processing up to 200,000 orders per second while maintaining a strong reliability track record. Bitwise believes that because of this, the platform is on the road to becoming one of the biggest beneficiaries as capital markets continue moving on-chain.
Matt Hougan, Chief Investment Officer at Bitwise, said the chain proved its relevance during a period of geopolitical tensions earlier this year, when traditional markets were closed, and traders turned to it for price discovery.
“Hyperliquid has emerged as one of the most compelling investment opportunities in crypto today,” said Hougan.
Additionally, Hype has risen to become the tenth largest crypto asset in the world since launching two years ago, with a market cap of over $11 billion.
“Hyperliquid’s token is explicitly designed so that rising trading activity on the Hyperliquid platform directly benefits token holders. This has translated into historically strong returns,” he added.
Bitwise Shares Fees
The fund’s prospectus shows that BHYP carries a 0.34% sponsor fee, which Bitwise plans to waive for the first month on the first $500 million in assets. The company also clarified that the product hasn’t been registered as an investment firm, meaning it doesn’t have the same protections as ETFs and mutual funds.
Earlier in the week, 21Shares launched a similar product tracking HYPE dubbed THYP, which pulled about $1.8 million in trading volume on its first day, a feat described by analyst James Seyffart as “nothing too crazy.”
It has since racked up $7.42 million in cumulative net inflow, with data from SoSoValue showing that yesterday’s flow alone came in at nearly $5 million.
WalletV: The First AI-Native Crypto Wallet Has Arrived
Exclusive
The First AI-Native Crypto Wallet Has Arrived
Virgo Group’s WalletV launches with seven integrated large language models, autonomous trading agents, and real-time decision transparency, marking a pivotal shift in how everyday users interact with decentralized finance.
By Ashton Addison·Editor in Chief, Crypto Coin Show·Consensus Miami 2026·4 min read
For years, the promise of an AI-powered crypto wallet has floated at the edges of the industry, an obvious next step that no one had yet fully executed. At Consensus 2026 in Miami, Virgo Group CEO Adam Cai made that promise concrete: WalletV is live, and it is the first self-custody wallet built from the ground up with artificial intelligence at its core.
The milestone matters not just as a product launch, but as a signal of where the industry is heading. Two forces, Cai argues, will define the next wave of crypto adoption: AI agents and stablecoin payments. WalletV is Virgo’s answer to both, designed to lower the barrier to entry for everyday users while giving them tools that previously required deep technical knowledge or constant market attention.
What makes WalletV different
Most crypto wallets bolt AI onto an existing product, a chatbot here, a help widget there. WalletV’s architecture inverts that logic. The AI layer is not a feature. It is the interface.
At launch, users can choose from seven different large language models and write a natural language prompt instructing the agent how to manage their portfolio. From there, the agent operates autonomously, executing trades, managing swaps, and optimizing yield farming positions according to the logic the user defines, continuously, without requiring the user to watch the market.
Seven LLMs to choose from, giving users the ability to select the model that fits their trading style or risk tolerance.
Autonomous 24/7 operation, with agents executing strategy without requiring constant manual monitoring.
Rationale transparency every 15 minutes, surfacing exactly why the agent opened or closed positions at each decision point.
Top-tier DeFi protocols natively integrated, covering trading, swapping, and yield farming within a single mobile-first interface.
Prompt-driven iteration, allowing users to refine their strategy over time based on the agent’s own reasoning logs.
“Think about it this way. A lot of wallets provide skills documentation for people to connect their own agents. But for a normal day-to-day user to train their own AI and connect with skills, it’s not an easy job. We built that within the app.”
Adam Cai, CEO, Virgo Group · Consensus Miami 2026
The point Cai is driving at is a real one. Connecting a large language model to a DeFi wallet via documentation and custom integrations requires meaningful technical fluency. Virgo has abstracted all of that away, putting the capability directly in the hands of users who simply describe what they want and let the system handle execution.
Solving the hallucination problem in financial AI
The most serious objection to AI-driven trading is the risk of model hallucination, AI systems generating confident but incorrect output, which in a financial context can mean real losses. It is a challenge Cai has thought through carefully, and WalletV’s architecture reflects a deliberate engineering response.
Rather than letting models roam freely across all possible inputs, WalletV constrains its agents to specific, user-defined technical parameters. Users working with technical analysis select from a curated set of 10 to 15 dimensions within which the AI makes decisions. It cannot speculate beyond those bounds, and it must maintain memory of prior context to ensure its reasoning stays grounded over time.
How WalletV controls AI risk
Each agent is constrained to a specific set of user-defined parameters, preventing the model from making decisions outside those bounds while requiring it to retain contextual memory across its operating window. Users can review every decision rationale and adjust their prompts over time, creating a feedback loop between human judgment and machine execution.
The transparency piece matters especially here. Where copy-trading gives you the trade but never the thinking behind it, WalletV surfaces its agent’s reasoning every 15 minutes. If the logic sounds wrong, you update your parameters. If it checks out, you let it run, and benefit from the emotional detachment that a rules-driven system provides, one of the most underrated advantages retail investors can have.
Where the growth is coming from
Virgo Group began as a predominantly Canadian operation before spending five years reshaping its focus around global markets, a shift Cai described as one of the most consequential decisions the company has made. The clearest demand signal right now is coming from Southeast Asia, where retail crypto traders who have lived through painful liquidations are looking for systematic tools that manage risk without requiring constant intervention.
Australia has also emerged as a growth market, with additional regions targeted for expansion through the remainder of 2026. The mobile-first approach positions WalletV well in markets where smartphone penetration outpaces access to traditional trading infrastructure. Users reach for a phone, not a desktop terminal, to manage their financial exposure, and that is exactly where Virgo has built.
The road ahead
Cai set a clear internal target: by the end of 2026, WalletV should be the default choice for users who want AI-assisted portfolio management across trading, swapping, and yield farming. The team is already running weekly performance analyses across its AI modules, comparing win rates and decision quality across models to inform ongoing improvements.
The broader vision is one of access. For the large population of retail participants who lack the time or expertise to make consistently informed decisions, AI could represent something meaningful: a way to participate in decentralized finance on more equal footing. Whether WalletV can deliver on that promise at scale remains to be seen. But as of Consensus 2026, no other crypto wallet has shipped what it has shipped. The first mover on AI-native self-custody is no longer theoretical.
Watch the Interview
Recorded Live at Consensus Miami 2026
Adam Cai, CEO of Virgo Group, speaks with Ashton Addison on the floor of Consensus Miami 2026 about WalletV, AI agents, and the future of decentralized finance.