
NIGHT, the token behind Cardano’s privacy-focused Midnight network, plunged more than 43% earlier today to hit an all-time low of $0.01524.
Speculation then mounted that the Midnight blockchain may have been hacked, causing the steep selloff, but according to The Midnight Foundation, the price drop came after roughly 2% of NIGHT’s supply was moved out of a two-year-old contract tied to Wanchain’s Cardano-to-BNB Chain bridge.
Foundation Says Blockchain Was Not Hacked
Independent on-chain researcher Paul was among the first to flag the withdrawal and noted in his preliminary findings that between 14:46 and 14:55 UTC on Monday, some 515 million NIGHT tokens had been withdrawn from a contract identified as Wanchain’s Cardano-side bridge lock address, which backs the Wanchain-wrapped NIGHT on BNB. Nothing else in that contract, including Mynth, XER, and WMT, was touched.
According to his analysis, around 290 million tokens were then sold across decentralized exchanges, sending the price down, while another 200 million were transferred to a second wallet, leaving what he described as a large unsold overhang. Furthermore, he said that the total NIGHT supply itself did not change, meaning no new tokens had been minted.
Soon after, the Midnight Foundation published a community update on X, saying it was aware of reports involving the Wanchain Cardano-to-BNB bridge and stressed that the available information pointed to a cross-chain bridge issue and not a problem with the Midnight network. It also urged users to only rely on official updates and to watch out for phishing attempts while investigations were going on.
In a second statement, issued a few hours later, the organization confirmed that Midnight’s protocol, validator network, consensus mechanism, and core infrastructure were all operating normally.
CoinGecko data shows that before the plunge, NIGHT had traded as high as $0.026, with the sudden sale of 290 million tokens dragging it down to $0.01524, its lowest ever price level. It has since pulled back some of those losses and was trading more than 28% above that ATL at the time of writing, although it was still 27% in the red over 24 hours. It has also erased all the gains it had made in the last year and is about 34% lower than where it was a week ago.
Bridge Security Back in the Spotlight
Cardano co-founder Charles Hoskinson also weighed in, saying an automated alert on his phone had flagged NIGHT’s unusual price action, after which the Midnight Foundation and other parties set up an informal war room to track the situation as it unfolded.
His message boiled down to three points: that Midnight’s own smart contracts had kept on running without interruption; the problem came from one of the four components in Wanchain’s bridge architecture; and that the industry needs to be more vigilant given how fast AI tools can now find such flaws.
According to Hoskinson, bridge infrastructure is one of the weakest points in crypto because it depends on trust assumptions outside the underlying blockchain. But he believes that technologies, including zero-knowledge proof-based bridges and trusted execution environments, as well as multisig systems, could reduce such risks.
His point on AI is something OpenZeppelin co-founder Manuel Aráoz touched on in late May, when he warned people to get out of DeFi, saying AI-powered coding agents have tilted the security game in favor of attackers, making it difficult for any protocol to hold user funds with any level of confidence. DeFi Investor, an analyst who monitors the sector, repeated the warning recently when Anthropic announced the launch of its Mythos AI, which experts say is extremely good at finding software vulnerabilities.
The Hyperliquid price prediction anticipates a high of $79.77 by the end of 2026.
In 2029, it will range between $187.03 and $213.01, with an average price of $198.99.
In 2032, it will range between $318.95 and $346.16, with an average price of $333.12.
Hyperliquid is a leading decentralized exchange (DEX). It has its own Layer 1 blockchain, and HYPE is its native token, which is used for staking, governance, and payments within the ecosystem.
One of the key features of Hyperliquid, along with its high-speed platform, is that it offers crypto perpetual futures for trading by its users without the need to own the asset. The platform supports a number of cryptocurrencies, including but not limited to BTC, ETH, SUI, AVAX, and SOL, to name a few.
Technically, the Hyperliquid blockchain is based on two protocols, namely HyperEVM and HyperBFT; combined, they help provide high-speed trading and Ethereum-based smart contracts with reliability to support the Hyperliquid ecosystem.
The Hyperliquid platform revolves around community participation, as token holders have voting rights to govern and influence developments taking place on the platform.
On November 29, 2024, Hyperliquid conducted an airdrop of its native token, HYPE, but unlike other players, it was selective in allocating the airdrop to only 94,000 users with an average value of $45,000 to $50,000, making it one of the most worthy airdrops in crypto history.
Let’s take a deep dive into what the future holds for the HYPE token in Cryptopolitan’s Hyperliquid price prediction for 2026 and beyond.
Overview
Cryptocurrency
Hyperliquid
Token
HYPE
Price
$60.99 (+3.58%)
Market Cap
$15.46B
Trading Volume
$253.2M
Circulating Supply
252.88M HYPE
All-time High
$76.70 (Jun 16, 2026)
All-time Low
$3.2 (Nov 29, 2024)
24-hour High
$61.33
24-hour Low
$58.39
Hyperliquid Price Prediction: Technical Analysis
Metric
Value
Price Prediction
$47.72 (-21.54%)
Price Volatility (30-day variation)
4.69%
50-Day SMA
$65.43
200-Day SMA
$43.49
Market Sentiment
Neutral
Fear & Greed Index
28 (Fear)
Green Days
14/30 (47%)
Hyperliquid Price Analysis
TL;DR Breakdown:
Hyperliquid price analysis indicates an upward trend at $60.99.
Cryptocurrency has gained 3.58% of its value.
HYPE token faces strong resistance around the $66 range.
On July 19, 2026, Hyperliquid price analysis revealed a bullish trend, as the altcoin is now trading at $60.99 after dipping to a low of $58 yesterday. From an overall view, the altcoin gained a significant 3.58% in its value over the last 24 hours. This recovery creates relatively favorable circumstances for buyers, as the altcoin was previously following a downward trajectory. However, market conditions appear risky, as the token may start to correct again by the next trading session.
HYPE/USDT 1-day chart analysis
The one-day price chart of Hyperliquid Coin shows a bullish trend in the market. The cryptocurrency’s value has increased to $60.99 during the day, as traders continue to buy more. At the same time, a new green candlestick on the price chart signifies the presence of bullish elements, as the price has started to increase. Buyers are leading the price action at the moment because buying interest is present at the current price level.
The distance between the Bollinger Bands defines the intensity of volatility. This distance is wide, leading to high volatility levels, as the bands are diverging. Moreover, the upper limit of the Bollinger Bands indicator, indicating resistance, has shifted to $73. Conversely, its lower limit, indicating support, has moved to $58.
The Relative Strength Index (RSI) indicator is trending in the neutral region. The indicator’s score has increased to 42 today. This condition is reflected by an upward-pointing RSI curve. If buying activities continue to intensify, the indicator’s reading can increase further into the neutral range.
HYPE/USDT 4-hour chart analysis
The four-hour price analysis of Hyperliquid also indicates positive sentiment in the market on an hourly basis. The HYPE/USD price has increased to $61.01 over the past few hours as buying interest persists. The low volatility on the 4-hour chart also suggests a lower probability of an imminent reversal or further price appreciation.
The Bollinger Bands are covering comparatively less area, resulting in low volatility levels. This condition typically signifies less market unpredictability. Technically, the upper Bollinger Band has shifted to $65, indicating a resistance level. Conversely, the lower Bollinger Band has moved to $56, indicating a strong zone of support.
The RSI indicator has been moving down in the central neutral region during the last 4 hours, as its value has decreased to 42 for now. Overall, selling activity remained high during the last four hours of the day, which has resulted in an increase in the indicator’s score.
Hyperliquid Technical Indicators: Levels and Action
Daily simple moving average (SMA)
Period
Value ($)
Action
SMA 3
60.19
BUY
SMA 5
62.57
SELL
SMA 10
64.52
SELL
SMA 21
66.03
SELL
SMA 50
65.43
SELL
SMA 100
55.62
BUY
SMA 200
43.49
BUY
Daily exponential moving average (EMA)
Period
Value ($)
Action
EMA 3
60.90
BUY
EMA 5
61.96
SELL
EMA 10
63.72
SELL
EMA 21
64.92
SELL
EMA 50
62.98
SELL
EMA 100
57.00
BUY
EMA 200
49.68
BUY
What to expect from Hyperliquid price analysis?
Hyperliquid price analysis gives a bullish prediction regarding ongoing market events. The coin’s value increased to $60.99 in the past 24 hours, after it touched the $58 level. According to an overall analysis, the currency gained 3.58% in its value today. Technical indicators give neutral signals, but the price charts showcase a bullish market scenario at the time of writing.
Why is Hyperliquid up?
The cryptocurrency market is showing positive trends, and HYPE is receiving the same sentiment. It is encouraging that HYPE marked a new ATH a few days ago, on June 16, 2026. From a broader perspective, the HYPE price increased to $60.99, gaining 3.58% in its total value today. The token is still trending in its higher price envelope.
Is Hyperliquid a Good Investment?
HYPE has growing utility, and its Ethereum compatibility helps it steal a share of the DeFi industry. BitMEX co-founder and influencer Arthur Hayes is one of the most prominent mega-bulls and a primary financial backer of Hyperliquid. Through his family office/fund, Maelstrom, Hayes has made HYPE his largest liquid altcoin position.
Arthur Hayes utilizes a revenue-based price prediction tool to analyze how the protocol captures volume from traditional markets, such as its recent $1.7 billion daily peak in oil perpetuals. He maintains that Hyperliquid’s HYPE token is fundamentally de-risked by a robust mechanism that directs 97% of protocol fees toward token buybacks.
Hayes wrote and published a detailed investment thesis titled “Valhalla,” where he revealed that Maelstrom was aggressively selling off other holdings (like ENA, PENDLE, and ETHFI) to increase its exposure to Hyperliquid. In his predictions, Hayes argued to set a very public price target of $150 for HYPE by August 2026. This proves that in his predictions for the HYPE token, Arthur Hayes is extremely bullish. While the technical analysis can change from bullish to bearish with new regulatory developments, price predictions paint a different picture. However, this is not investment advice, and a risk analysis is recommended.
Will Hyperliquid reach $70?
The current price action does justify predicting a $70 target. In the cryptocurrency market, things change rapidly, but if the token maintains its price levels, a rally can be initiated. It can be expected that HYPE will reach above $70 by any time in 2026, once again, as it did a few days ago.
Can Hyperliquid Coin reach $100?
According to Hyperliquid price prediction, HYPE price might surpass $100 in 2027. The highest price HYPE could attain that year is expected to be above $123.17.
Will Hyperliquid reach $500?
According to crypto analysts’ price predictions, Hyperliquid may not reach this level in the next five years. Considering the current market cap of the token, it seems like far target.
Will Hyperliquid reach $1000?
Per the Cryptopolitan’s HYPE price prediction, Hyperliquid is unlikely to reach $1000 before 2032.
How high can Hyperliquid go?
The highest expected price for Hyperliquid is $346.16, which it will achieve in 2032.
Does Hyperliquid have a good long-term future?
Hyperliquid is trading higher than its December 2025 price levels, making it an ideal time for buyers to enter the market. Hyperliquid is now offering Brent and WTI futures. The oil trades are available through the HIP-3 framework on the XYZ exchange, as traders bet high on oil as it smashed through $100 for the first time in years. It is important to remember that XYZ:CL, representing WTI oil, entered the top 5 of the most traded futures in its first week. Given its current price and a favorable future valuation of $346.16 by the end of 2032, the asset appears to be a worthwhile investment.
Recent News/Opinions on Hyperliquid
Cryptopolitan reported that Hyperliquid is now available on TradingView, offering users around the world direct access to on-chain, decentralized perpetual futures in crypto, equities, commodities, and foreign exchange.
According to a report by Cryptopolitan, Multicoin Capital (Multicoin) published a full valuation for HYPE, indicating the protocol’s annual revenues will reach approximately $8 billion by 2028, resulting in a price target of $319, over five times its current trading value of around $67.
Hyperliquid Price Prediction July 2026
This month, Hyperliquid is expected to reach a high of $76.59, with an average price of $65.18 and a minimum trading price of $51.82.
Hyperliquid Price Prediction
Minimum price
Average price
Maximum price
Hyperliquid price prediction July 2026
$51.82
$65.18
$76.59
Hyperliquid Price Prediction 2026
The price of HYPE is predicted to reach a minimum value of $19.31 in 2026. Traders can anticipate a maximum value of $79.77 and an average trading price of $66.53 throughout this year.
HYPE Price Prediction
Minimum price
Average price
Maximum price
Hyperliquid price prediction 2026
$19.31
$66.53
$79.77
Hyperliquid Price Predictions 2027 – 2032
Year
Potential Low ($)
Potential Average ($)
Potential High ($)
2027
96.51
109.89
123.17
2028
142.02
154.97
167.74
2029
187.03
198.99
213.01
2030
231.04
243.84
257.14
2031
274.89
287.97
302.10
2032
318.95
333.12
346.16
Hyperliquid (HYPE) price prediction 2027
The year 2027 will experience more bullish momentum. According to the Hyperliquid price prediction, it will range between $96.51 and $123.17, with an average trading price of $109.89.
Hyperliquid crypto price prediction 2028
The Hyperliquid price prediction climbs even higher into 2028. According to the projections, the price of HYPE will range between $142.02 and $167.74, with an average of $154.97.
Hyperliquid coin price prediction 2029
According to our Hyperliquid (HYPE) price prediction for 2029, we expect a maximum price of $213.01, a minimum price of $187.03, and an average price of $198.99.
Hyperliquid price prediction 2030
As per the HYPE price prediction for 2030, it will reach a maximum price of $257.14 and a minimum price of $231.04, with an average price of $243.84.
Hyperliquid price prediction 2031
The Hyperliquid forecast for 2031 suggests a price range of $274.89 to $302.10 and an expected average trading price of $287.97. This long-term prediction also hinges on HYPE’s rising global recognition and adoption.
Hyperliquid prediction 2032
The Hyperliquid price forecast for 2032 is a high of $346.16. According to the HYPE coin price prediction, it will reach a minimum price of $318.95 and average at $333.12.
While the short-term sentiment keeps flickering, we anticipate Hyperliquid will trade higher in the coming years. The coin will achieve a high of $79.77 before the end of 2026. In 2027, it will range between $96.51 and $123.17, with an average of $109.89. However, you should note that HYPE is still quite volatile. Negative market sentiment, such as market crashes, could derail the predictions.
The native token of Hyperliquid, called HYPE, was launched on November 29, 2024, through an airdrop targeted at a limited number of only 94,000 users.
This was one of the most lucrative airdrops, with an average allocation of value of $45,000 to $50,000.
Hyperliquid kept away from venture capitalists, who usually get most of the tokens in usual airdrops; rather, 76% of the supply was slated for user-centric initiatives.
Usually, tokens dump after airdrops until the market momentum picks up, but Hyperliquid’s approach helped garner trust, and the token jumped from $4 to $35 from November 2024 to December 22, 2024.
Hyperliquid’s market cap improved during this period, reaching above $8 billion, showing significant growth, as it received super positive market sentiment.
In late December and early January 2025, the HYPE token corrected down to $20.24, shedding significant value as per crypto market data.
Price stabilized through February as it traded in a range of $19.92 to $27.42 before taking a dive at the end of February, when the broader trend turned bearish again.
HYPE stumbled to $12.34 by mid-March, and it touched a low of $10.21 on April 7, 2025, which significantly decreased the market capitalization.
The token saw nothing but improvement in the remainder of the month of April, and its price surged to $18.57 by the end of the month.
On June 16, 2025, HYPE reached a high price of $45.57. A month later, on July 14, it marked another all-time high of $49.75, and on August 27, it discovered the $50.99 level with changing market dynamics.
On September 18, HYPE achieved its ATH at $59.30, and in October, it corrected to $50. At the start of December, the HYPE token price fell to the $31 range.
At the start of 2026, the HYPE token was trending near $25, and in March, it increased to the $33 rang.
At the start of April, Hype was trading near the $36 range, and in May, it jumped above $70, with the broader crypto market turning into bullish mode. However, the token corrected to the $57 range in June.
Hype maintained a higher price range near $70 in July, despite the broader crypto market being bearish.
Chainlink is holding near a key support area while the market continues to judge whether its cross-chain infrastructure story can turn into durable demand for LINK.
The token has been trading around levels that matter to short-term traders, but the larger Chainlink conversation is not only about price. It is about whether CCIP, data feeds, and institutional integrations can keep moving from announcements into real usage.
That distinction matters. Chainlink has one of the clearest infrastructure narratives in crypto, especially around oracles, tokenization, and cross-chain communication. But infrastructure narratives take time to prove themselves. The market wants adoption, volume, and recurring demand — not just another list of integrations.
For LINK holders, the current support test is therefore about more than the chart.
TL;DR
Chainlink is holding near a key support zone as traders watch LINK’s next move.
CCIP adoption remains central to the longer-term Chainlink story.
The market wants evidence that integrations are translating into sustained usage and demand.
Chainlink’s Story Is Bigger Than One Price Level
Chainlink is not a typical altcoin story.
The project sits underneath a large part of the crypto infrastructure stack through oracle services, data feeds, automation, proof-of-reserve tools, and cross-chain messaging. That makes it important even when LINK price action is quiet.
The problem for traders is that infrastructure value does not always translate cleanly into token momentum. A new integration can be useful. A major institution can test Chainlink tools. CCIP can expand across ecosystems. But the market still has to decide how much of that activity should be reflected in LINK’s price.
That is why support levels matter in the short term, but they do not tell the whole story.
If LINK holds support while adoption keeps growing, bulls can argue that the market is gradually pricing in Chainlink’s role as cross-chain infrastructure. If support fails despite continued announcements, traders may question whether the token is capturing enough of the network’s relevance.
The current setup sits between those two readings.
CCIP Is The Part Traders Keep Coming Back To
Chainlink’s Cross-Chain Interoperability Protocol has become one of the most important parts of its market narrative.
CCIP is designed to help move data and value across blockchains in a more secure and standardised way. That matters because crypto remains fragmented. Liquidity, assets, applications, and users are spread across many networks, and institutions are unlikely to tolerate messy bridging risk at scale.
If CCIP becomes a widely used standard, Chainlink’s position in the market strengthens.
CCIP activity and integrations are the key areas to watch in the current Chainlink setup. That is the right area to watch. The market does not need another vague infrastructure claim. It needs evidence that real projects, institutions, or networks are using Chainlink tools in ways that create recurring demand.
That evidence can come through transaction volume, value transferred, integrations moving into production, and institutional use cases that go beyond pilot programmes.
Until then, CCIP remains a strong narrative with a live adoption test.
LINK Needs Usage To Beat The Altcoin Cycle
Like other major altcoins, LINK still trades inside the broader crypto liquidity cycle.
When risk appetite is strong, infrastructure tokens can rally as investors look for high-quality altcoin exposure. When the market weakens, even strong projects can fall if capital rotates back to Bitcoin, stablecoins, or cash.
That is why Chainlink’s support area matters now. It shows whether buyers are willing to defend LINK during a less forgiving market.
The stronger case for LINK is that Chainlink has a clearer utility story than many altcoins. Its tools are used across DeFi, data, and cross-chain environments. It is also one of the few crypto projects that regularly appears in conversations about institutional infrastructure.
The weaker case is that token demand remains hard to model. Traders may believe Chainlink is important while still questioning whether LINK captures enough of that importance during quieter market periods.
That tension is not new, but it is becoming more important as the market matures.
If CCIP usage continues expanding and LINK holds support, the token could regain attention as an infrastructure play rather than a short-term altcoin trade. If usage data remains unclear and support breaks, traders may wait for a better entry or stronger confirmation.
For now, Chainlink’s story remains intact, but the market wants more proof. The next phase depends on whether adoption becomes visible enough to support the price narrative.
This article is based on information from Chainlink.
This article was written by the News Desk and edited by Samuel Rae.
Crypto trader Axel Bitblaze has laid out a fresh market thesis built on a video from analyst Taiki Maeda, arguing that assets like Hyperliquid (HYPE), Lighter (LIT), and Zcash (ZEC) are already trading like winners of the next cycle while most investors are waiting for a fourth-quarter bottom.
He says that markets tend to move before the crowd agrees a bottom has formed, so the better window to position could be mid-to-late Q3 and not whenever things look safe.
The Case for HYPE, LIT, and ZEC
On July 15, Maeda shared a video on his X account in which he said that crypto was bottoming and that he would be longing HYPE, LIT, and ZEC.
His take was expanded on by Bitblaze in a July 16 post, who noted that Hyperliquid has bought back about 3.4% of the circulating HYPE supply this year, allowing the token to perform well even as sector mainstays such as Bitcoin (BTC) struggled.
“If BTC volatility causes another $HYPE dip without changing its fundamentals… that could be an accumulation opportunity,” wrote the analyst.
Lighter’s LIT token was presented as a higher-risk alternative, with Bitblaze crediting its reported partnership with Robinhood for giving the decentralized perpetual exchange access to a much wider audience. He also noted that buybacks have removed more than 6% of LIT’s circulating supply, helping to push it to an all-time high on the second-to-last day of 2025, when many altcoins were losing ground.
Meanwhile, ZEC carries the most caution. In his market update video, Maeda said he sold the privacy coin after the discovery of a vulnerability in its Orchard shielded pool that could have allowed bad actors to create unlimited amounts of fake ZEC, triggering a 60% collapse. He did, however, buy most of the ZEC back after reassessing the project’s outlook, with the Ironwood upgrade set for July 28 expected to introduce stronger quantum resistance and use formal verification to reduce the risk of hidden bugs.
That update, according to Bitblaze, could help push up the asset’s price. Recall that last week, Zcash founder Zooko Wilcox said that they were close to producing a mathematical proof that Ironwood’s new shielded pools have no undetectable counterfeiting bugs, taking ZEC’s price past $500.
The token is trading at about 0.8% of Bitcoin’s market cap, and per Maeda’s model, it could go anywhere between $650 and $700 if that ratio climbs back to 1%.
Traders Urged Not to Wait for Bitcoin
Bitblaze said that crypto has been in a bear market since the euphoria experienced in mid-2025 when ETH was closing in on $5,000. Now, people are waiting for the bottom, which, according to him, has been penciled in for Q4 2026.
But he believes the market has a tendency to “front-run what everyone expects,” meaning it is better for traders to start positioning themselves between August and September “before the recovery becomes obvious.”
“Don’t wait for Bitcoin and the entire market to look perfect,” the analyst advised. “The next winner usually starts separating from the market before everyone accepts that the bottom is forming.”
Ostium, an on-chain perpetuals trading platform, said a five-minute security incident caused losses from its public liquidity vault. Security firms estimated the exploit at up to $24 million.
Co-founder Kaledora Kiernan-Linn confirmed that the issue ran from 14:18 to 14:23 UTC on July 15 and affected the public Ostium Liquidity Provider (OLP) vault. She said the team identified it within minutes and coordinated a trading pause within the hour. The statement did not give a definitive loss total, identify the root cause, or provide a final postmortem.
Security firms said authorized data, rather than a missing signature, sat at the center of the incident. Blockaid and Cyvers said a registered PriceUpKeep forwarder submitted future-dated, authorized oracle reports that created artificial trading profits.
SlowMist said an authorized signer supplied validly signed manipulated data used for repeated profitable trades. Those descriptions remain third-party findings pending Ostium’s postmortem.
Cryptographic authentication can establish that a permitted key signed a report. Price plausibility, timestamp freshness, and settlement safety require separate controls.
The OstiumVerifier code linked from Ostium’s security documentation recovers an ECDSA signer and checks whether the signer is authorized, but that verifier function does not enforce a price-plausibility test or timestamp bound.
The code does not appear to identify which implementation was active during the incident or whether separate contracts applied those checks. Any timestamp, replay, price-deviation, or multi-source safeguards would have to operate elsewhere in the execution path.
Ostium’s protocol documentation states that the OLP vault holds traders’ collateral and pays out winning trades immediately on-chain. If artificial profits were accepted for settlement, vault liquidity funded the payouts.
Published estimates rose as tracing continued. Blockaid put the payout near $18 million, Cyvers estimated $23.7 million, and PeckShield later described roughly $24 million drained.
SlowMist’s lower $11.86 million figure appears to track one 11,862,444.782 USDC vault outflow visible in its cited transaction.
PeckShield said the extracted USDC was swapped into 12,080 ETH and that 10,540 ETH had reached Tornado Cash by its update. Kiernan-Linn said Ostium was working with law enforcement, SEAL 911, and third-party security specialists.
The mechanics distinguish Ostium from a similar issue with Bonzo Lend, a Hedera lender hit four days earlier. Bonzo’s incident report said its verifier accepted a proof carrying no valid signature. In Ostium’s case, security firms allege the reports came through an authorized signer path: authentication succeeded, but the data was allegedly unsafe.
Ostium still has to establish whether a signer key was compromised, an authorized operator acted maliciously, or another privileged path was abused.
Its remediation will be judged by whether signer isolation, tight timestamp bounds, independent price checks, rate limits, and circuit breakers can prevent one trusted path from turning minutes of bad data into another vault payout.
Our SUI price prediction indicates a high of $2.07 by the end of 2026.
In 2028, SUI will range between $10.47 and $12.10, with an average price of $10.83.
In 2031, it will range between $33.01 and $40.39, with an average price of $34.20.
Our SUI price prediction points to a high of $2.07 by the end of 2026, an average price of $10.83 in 2028, and a potential average of $34.20 by 2031. If you’re an investor, trader, or crypto enthusiast weighing SUI‘s future upside and investment potential, this forecast breaks down the data that matters: historical price action, technical indicators, short- and long-term projections from 2026 to 2032, market sentiment, recent news, and whether SUI looks like a good investment. In a volatile market, understanding SUI’s likely price path and the network developments shaping it can help you make more informed decisions over the next few years.
Overview
Cryptocurrency
Sui
Symbol
SUI
Current Sui price
$0.7474
24-hour trading volume
$231.61M
Circulating supply
4.05B
Market capitalization
$3.02B
Total supply
10B
All-time high
$5.35 on Jan 6, 2025
All-time low
$0.3643 on Oct 19, 2023
24-hour high
$0.7638
24-hour low
$0.7343
SUI price prediction: Technical analysis
Metric
Value
Volatility (30-day variation)
4.00% (Medium)
50-day SMA
$0.7574
200-day SMA
$1.03
Sentiment
Neutral
Green days
11/30 (37%)
Fear and Greed Index
25 (Extreme Fear)
SUI also remains below its 50-day and 200-day simple moving averages, indicating a dominant daily bearish trend. In any forecast, technical factors should be weighed alongside fundamental factors.
SUI price analysis
On July 16, SUI coin fell by 0.26% over the past 24 hours and 0.49% over the past 30 days. Its trading volume rose 8.86% to $231M over 24 hours, signaling rising conviction in the trend, with short-term price action tracking the broader cryptocurrency markets.
SUI is neutral, having faced resistance levels at $0.811. The candles are coherent, supporting the neutral sentiment. It has technical support in the $0.50- $0.66 range. If bullish pressure resumes, it could test $0.80, then $0.89.
SUI is volatile on this timeframe and is on its next leg up. Support and resistance levels are at $0.699 and $0.771, respectively. Its Relative Strength Index (RSI) is now at 51.33. It is oversold when the value crosses below 30.
SUI technical indicators: Levels and action
Daily simple moving average (SMA)
Period
Value ($)
Action
SMA 3
0.7453
BUY
SMA 5
0.7405
BUY
SMA 10
0.7343
BUY
SMA 21
0.7244
BUY
SMA 50
0.7574
SELL
SMA 100
0.8816
SELL
SMA 200
1.03
SELL
Daily exponential moving average (EMA)
Period
Value ($)
Action
EMA 3
0.7493
BUY
EMA 5
0.7443
BUY
EMA 10
0.7382
BUY
EMA 21
0.7369
BUY
EMA 50
0.7791
SELL
EMA 100
0.8695
SELL
EMA 200
1.16
SELL
What to expect from the SUI price analysis next?
The short-term charts show negative momentum, while key technical indicators remain neutral unless a bullish continuation develops above nearby resistance. Next week’s price action depends on whether support at $0.699 holds.
Why is SUI down?
Sui’s drop closely mirrors Bitcoin’s decline, indicating it moved as a high-beta asset during a broad market sell-off. The total crypto market cap fell 1.44% to $2.2T.
Recent news
Sui blockchain has processed nearly $65 billion in stablecoin transactions since June 10, following an update that eliminated fees for stablecoin transfers. This fee removal, aimed at simplifying B2B payments and retail use, has boosted transaction volumes and could challenge traditional payment systems like SWIFT.
Will SUI reach $10?
According to the Cryptopolitan price prediction, SUI is expected to reach $10 in 2027, with an average price of $10.83 for the year.
Will SUI reach $100?
It remains unlikely that SUI will rise to $100 before 2032.
Will SUI reach $1,000?
It remains unlikely that SUI will rise to $1,000 before 2032.
How high can Sui go?
Per the Cryptopolitan price prediction, SUI could reach $4.77 by the end of 2026, while some long-term models place it in the $2.00-$3.50 range under favorable ecosystem expansion and market recovery. Its long-term potential will also depend on how the network handles token unlocks, institutional adoption, and scaling execution.
Is SUI crypto a good investment?
Should the market sentiment change, SUI will rise to its previous highs. SUI’s price predictions for 2032 are optimistic as global adoption of decentralized applications rises, though the long-term upside also depends on how Sui competes with Solana and Ethereum Layer 2s and manages that competitive risk.
The native token supports network economics, and the SUI token is used to pay gas and transaction fees, participate in governance, and support liquid staking, which can strengthen demand if usage improves and fresh capital follows continued innovation. Sui uses a delegated proof-of-stake model, where validators and delegators help secure the blockchain and earn rewards. Integrations with major tech frameworks expand developer access in SUI. Its architecture also emphasizes parallel execution, horizontal scaling, low-latency transactions, and deep composability.
SUI price prediction July 2026
The SUI price forecast for July ranges from $0.65 to $1.10. Next month, traders should watch whether support holds and momentum improves after the May range. The average price for the month will be $0.89.
Month
Potential low ($)
Potential average ($)
Potential high ($)
July
0.65
0.89
1.10
SUI price prediction 2026
For 2026, SUI’s price will range between $0.68 and $2.07. Some analyst models place the end-2026 price between $1.20 and $1.50, depending on broader market cycles, while a stronger bull run would likely be needed to push SUI toward the upper end of that range as investors shift toward digital assets during changing macro conditions. Alternative long-range forecasts put Sui Crypto at $0.7545 by the end of 2026, $3.33 by 2030, and $5.32 by 2040, while some 2025 projections targeted $2.85 to $3.00 under favorable conditions. The average price for the year will be $1.77.
Year
Potential low ($)
Potential average ($)
Potential high ($)
2026
0.62
1.77
2.07
SUI price prediction 2027-2032
Year
Potential low ($)
Potential average ($)
Potential high ($)
2027
7.05
7.24
8.16
2028
10.47
10.83
12.10
2029
15.50
16.04
18.66
2030
22.96
23.77
27.04
2031
33.01
34.20
40.39
2032
47.50
49.21
57.09
Sui price prediction 2027
SUI coin price prediction estimates a range of $10.47 to $12.10, with an average of $10.83.
Sui price prediction 2028
SUI network coin price prediction climbs even higher into 2028. According to the prediction, the SUI cost will range from $15.50 to $18.66, with an average of $16.04.
Sui price prediction 2029
According to the SUI forecast for 2029, the price of SUI will range from $22.96 to $27.04, with an average closing price of $23.77.
Sui price prediction 2030
According to the 2030 SUI price prediction, the price will range from $33.01 to $40.39, with an average of $34.20.
Sui price prediction 2031
The SUI crypto price forecast for 2031 is a maximum price of $57.09. It will reach a minimum price of $47.50 and an average price of $49.21.
Sui crypto price prediction 2032
The SUI’s price prediction ranges from $7.05 to $8.16, with an average of $7.24. The predictions indicate long-term growth.
SUI price prediction 2026 – 2032
SUI market price prediction: Analysts’ SUI price forecast
Our predictions show that SUI will reach a high of $2.07 in 2026, and future forecasts will depend not only on adoption and scaling but also on whether the native token captures value as ecosystem usage grows. In 2028, it will range between $10.47 and $12.10, with an average of $10.83. In 2030, it will range between $33.01 and $40.39, with an average of $34.20. Sustained capital inflows and higher on-chain usage would strengthen the long-term case.
If you plan to buy sui or trade sui, base that decision on your own research rather than headline targets alone. Note that the predictions are not investment advice and that risk can also rise with supply growth if token unlock pressure persists. Seek independent consultation or do your own research.
Exchanges such as Binance, OKX, KuCoin, and Bybit hosted activities toward the initial distribution of SUI in April 2023.
Sui was developed by Mysten Labs, the team behind the Layer-1 chain.
Its object-centric data model allows tracking of individual objects, and its architecture uses parallel execution to handle many transactions with low latency while maintaining efficient performance.
The Move programming language is used to create digital assets and smart contracts in a more secure environment.
Tools such as zkLogin and sponsored transactions make sui easier for mainstream users by simplifying access and fees, while the design also supports deep composability.
The chain is built for high throughput, fast transactions, and real-world apps such as gaming and finance, with low-latency transactions, horizontal scaling as the network grows, and ongoing innovation that could support long-term value through sustained usage.
The SUI token is the native token used for fees, staking, and governance.
SUI initially traded at $2.10, well above the $0.10 investors paid during its public sale at the end of April.
A bear run preceded the listing, and on October 23, 2023, it fell to its lowest price, $0.3643.
It started recovering in November 2023.
It reached its highest price on March 27, 2024, at $2.18, following the Greek stock exchange’s announcement of a possible collaboration.
On May 21, 2024, the SUI network surpassed 1 million daily active wallets. In August, it traded at $0.57.
It later rose, breaking above $1.5 in September and $2 in October.
The bull market run continued into November, reaching a new all-time high of $5.35 on January 6, 2025. Later, it quickly reversed, falling below $3.50 in February and $2.00 in April.
It began recovering in May, rising above $3.50. In July, it fell below $3.0, and, like Solana and Ethereum Layer 2 networks, broader adoption still depends on ecosystem depth, since those rivals already benefit from deep liquidity.
It rose to $3.60 by October, then entered a bear run. Decentralized exchanges, lending platforms, and liquid staking can strengthen ecosystem liquidity, while ecosystem partners can support token distribution and liquidity management.
By November, it had dropped to $2, and in December to $1.6.
In January 2026, it recovered to $1.9, but erased those gains in February, falling below $1. It reached $0.90 in April. In June, it dropped to $0.70 and maintained that level into July.
In June, Morgan Stanley received preliminary conditional approval from the Office of the Comptroller of the Currency to establish a national trust bank for digital assets.
The OCC decision opened a path for Morgan Stanley Digital Trust to bring custody, transaction administration, fiduciary staking, and collateral support inside the firm.
The proposed subsidiary would serve Morgan Stanley Wealth Management clients. Its public application presents it as a wholly owned national trust bank, giving the firm a regulated vehicle for functions that separate specialist providers have often handled.
The OCC’s application record classifies the filing as a new bank charter under a holding company with trust powers requested.
The proposed services cover everything from safeguarding assets to running the day-to-day operations behind an institutional account. It covers custody, purchases, sales, swaps and transfers, fiduciary staking, and collateral administration supporting affiliate digital-asset lending.
With final approval and implementation, Morgan Stanley could retain customer assets, transaction administration, staking administration, and lending-collateral work within its group.
That shift puts crypto-native intermediaries under fresh pressure. Third-party custodians, staking administrators, and collateral-service providers face the clearest exposure where their products overlap with the trust bank’s approved functions.
Bringing those controls in-house at Morgan Stanley could make outside firms less central to client relationships and daily operational workflows around digital assets. It could also reduce the number of handoffs among the teams safeguarding assets, administering staking and managing collateral, concentrating more of the service relationship in one Wall Street group.
Several layers would still sit beyond the defined trust-bank plan. Access to execution venues, trading liquidity, lending counterparties, validator operation, and broader blockchain infrastructure each involve their own relationships and implementation choices. The OCC filing shows what Morgan Stanley wants to keep inside the bank, while outside firms can continue handling the rest.
The approval still comes with hurdles. Morgan Stanley Digital Trust needs at least $50 million in Tier 1 capital, a set pool of liquid assets, and enough liquidity to cover 180 days of operating costs, according to Corporate Decision 1378. The OCC application record lists the charter action as approved on June 18.
Final approval would let Morgan Stanley pull custody, transfers, fiduciary staking and collateral support for affiliate lending under one roof. Crypto-native providers would then have to show where they still add value once a Wall Street bank keeps the most important control points for itself.
The Ethereum (ETH) price broke out of a descending trendline that had capped it since the all-time high, while futures open interest climbed to $19.8 billion. ETH trades near $1,928, up 5.2% in the last 24 hours.
Derivatives positioning, liquidation data, and long-term chart structure now point in the same bullish direction. However, one missing ingredient still keeps the breakout unconfirmed.
Futures Traders Return as Open Interest Nears $20 Billion
Glassnode data shows Ethereum futures open interest across all exchanges spiked to $19.8 billion on July 14. That is the highest reading since June 3, when a market-wide deleveraging event reset positioning.
Open interest measures the total value of outstanding futures contracts. Rising open interest alongside a rising price suggests new capital is entering the market rather than shorts simply covering.
The metric had collapsed to approximately $15.5 billion in late June. Its sharp recovery indicates traders are returning to ETH derivatives with conviction. Elevated positive funding on Ethereum supports the same reading.
Whale trader Machi Big Brother reportedly opened a $24.3 million ETH long at 25x leverage, with liquidation set at $1,833.
Machi Big Brother has opened a $24,300,000 $ETH long with 25x leverage.
A drop back below the June range would flip this signal and suggest the new positioning was short-lived.
Long Liquidations at a Yearly Low of 4% Point to a Short Squeeze
The composition of recent liquidations strengthens the bullish case. Ethereum futures long liquidations dominance fell to 4%, its lowest level in a year, according to Glassnode.
In plain terms, only 4% of liquidated positions were longs. The remaining 96% were short traders forced out as the price pushed higher.
Still, squeeze-driven rallies carry a caveat. Forced short covering can exaggerate upside moves, as the June 3 liquidations cascaded to exaggerate the downside. Spot demand must follow for the move to hold.
A return of dominance above 50% would indicate that longs are absorbing damage again and would weaken the momentum signal.
Ethereum Price Holds the Trendline From the 2022 Bottom
The weekly chart shows why the current level matters so much. An ascending trendline drawn from the June 2022 bottom, respected throughout the previous bull market, held near $1,600 once again.
The bounce also occurred inside a long-term green demand zone that has served as support four times since early 2023. Moreover, the area coincides with the 0.786 Fibonacci retracement of the entire cycle at $1,754.
This triple confluence of trendline, horizontal support, and Fibonacci level makes the zone a structural line in the sand. The next major resistance sits far above, at the 0.618 Fibonacci retracement of $2,438.
ETH Price Prediction as the $2,000 Test Looms
On the daily chart, Monday’s 6.5% green candle broke above a descending trendline in place since the all-time high. That line had rejected the ETH price five times before this breakout.
The daily Relative Strength Index (RSI) confirms the shift in momentum. It broke out of its own descending trendline, drawn from July 2025, and now sits just below 65.
One warning sign remains. Volume has been declining during the recovery, so the breakout lacks confirmation from participation. Analysts watching the ETH/BTC ratio see early signs of a broader Ethereum comeback that could fill the missing demand.
Immediate resistance lies between $1,900 and $2,000. A confirmed daily close above that zone on rising volume could open the way toward $2,438, nearly 30% above the current price.
On the downside, $1,754 is the critical support. Losing it would expose the trendline near $1,600, and a weekly close below that level would invalidate the bullish structure entirely.
Either volume arrives to validate the breakout, or ETH returns to the zone that has saved it four times already.
San Francisco, July 14, 2026 — Anchorage Digital, home to America’s first federally chartered crypto bank, today announced expanded support for the TRON Network with native TRX staking and custody for TRC-20 assets. The expansion enables institutions to securely custody TRON-based assets and participate in network staking through the same regulated platform they already use for digital asset custody. TRON Network is governed by TRON DAO, the community-governed DAO dedicated to accelerating the decentralization of the internet through blockchain technology and decentralized applications (dApps).
Institutions can now stake TRX directly through Anchorage Digital, enabling them to earn protocol staking rewards while maintaining the security, operational controls, and regulatory standards they expect. Staking rewards are generated by the TRON protocol and vary based on validator selection and applicable platform fees. The launch also includes support for TRC-20 assets, giving institutions broader access to tokens issued on the TRON network.
Earlier this year, Anchorage Digital added custody support for the TRON blockchain, allowing institutions to hold TRX through both its regulated platform and Porto, Anchorage Digital’s self-custody wallet. Today’s launch builds on that foundation by adding native staking and broader support for the TRON ecosystem.
“Institutions are looking for the ability to participate in leading networks where on-chain activity and adoption continue to grow,” said Nathan McCauley, Co-Founder and CEO of Anchorage Digital. “TRX staking is another step in our commitment to supporting the digital asset ecosystems our clients care about. By adding native staking alongside custody, we’re giving institutions a compliant way to engage more deeply with TRON, a network that sits at the center of the stablecoin economy.”
“Expanding support with Anchorage Digital is an important milestone for the TRON ecosystem and the institutions building on it,” said Justin Sun, Founder of TRON. “Custody is the first step, but staking allows institutions to become active participants in the network. Secure, regulated infrastructure is what helps turn institutional interest into participation.”
TRON has become a leading blockchain for stablecoin settlement, with the largest circulating supply of USD Tether (USDT), which currently exceeds $90 billion. The network has also grown to more than 392 million total user accounts, processed over 14 billion transactions, and reached more than $26 billion in total value locked.
As institutional adoption of digital assets grows, Anchorage Digital’s expanded TRON integration provides secure, regulated access to one of the world’s most active blockchain networks. Through this integration, Anchorage Digital is broadening institutional participation in the TRON ecosystem, while TRON continues to strengthen the infrastructure supporting stablecoin settlement and on-chain financial activity.
About Anchorage Digital
Anchorage Digital is a global crypto platform that enables institutions to participate in digital assets through trading, staking, custody, governance, settlement, stablecoin issuance, and the industry’s leading security infrastructure. Home to Anchorage Digital Bank N.A., the first federally chartered crypto bank in the U.S., Anchorage Digital also serves institutions through Anchorage Digital Singapore, which is licensed by the Monetary Authority of Singapore; Anchorage Digital NY, which holds a BitLicense from the New York Department of Financial Services; and self-custody wallet Porto by Anchorage Digital. Anchorage Digital Bank also offers fiat custody services through the use of an FDIC-insured, licensed sub-custodian. Anchorage Digital is funded by leading institutions including Andreessen Horowitz, GIC, Goldman Sachs, KKR, and Visa, with a valuation of $4.2 billion. Founded in 2017 in San Francisco, California, Anchorage Digital has offices in New York, New York; Porto, Portugal; Singapore; and Sioux Falls, South Dakota. Learn more at anchorage.com, on X @Anchorage, and on LinkedIn.
TRON DAO is a community-governed DAO dedicated to accelerating the decentralization of the internet via blockchain technology and dApps.
Founded in September 2017, the TRON blockchain has experienced significant growth since its MainNet launch in May 2018. Until recently, TRON hosted the largest circulating supply of USD Tether (USDT) stablecoin, which currently exceeds $90 billion. As of July 2026, the TRON blockchain has recorded over 392 million in total user accounts, more than 14 billion in total transactions, and over $26 billion in total value locked (TVL), based on TRONSCAN. Recognized as the global settlement layer for stablecoin transactions and everyday purchases with proven success, TRON is “Moving Trillions, Empowering Billions.”
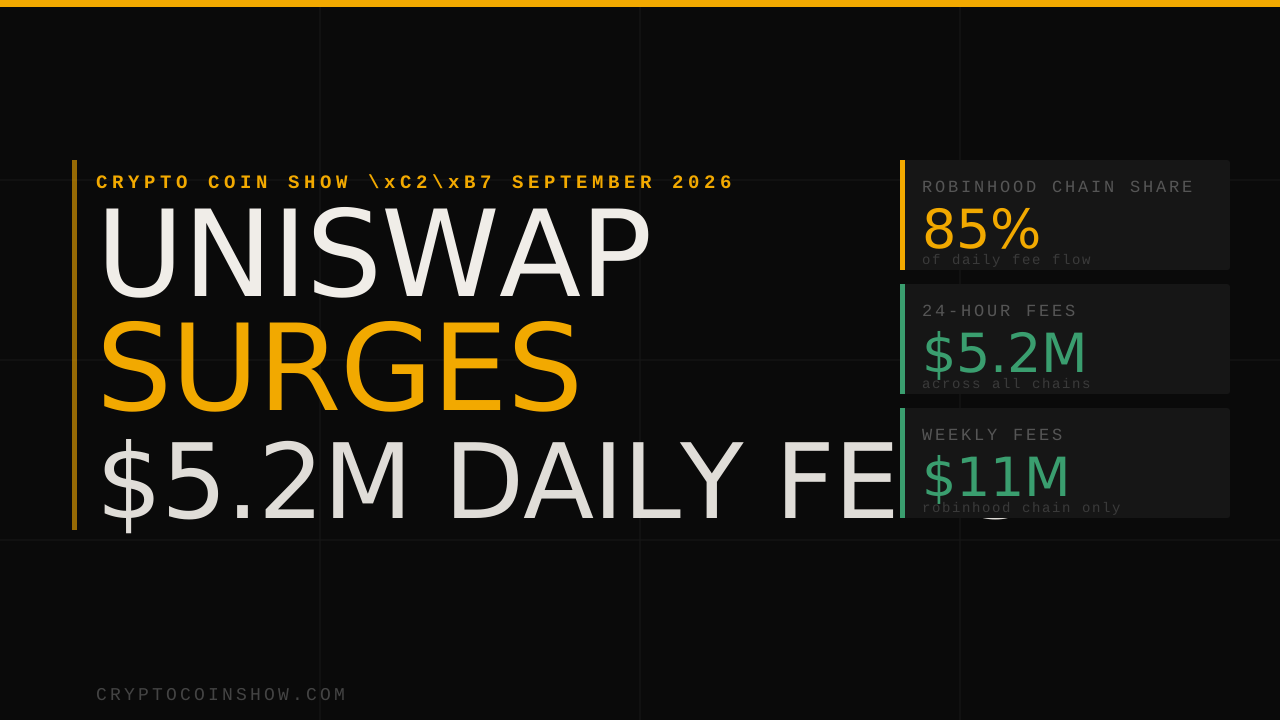
Uniswap’s founder, Hayden Adams, has shared that the company collects roughly $5.2 million in fees per day. Data from DefiLlama backs the figure at $5.16 million over the past 24 hours.
The surge is largely thanks to Robinhood’s two-week-old blockchain, which now accounts for most of that fee flow. Meanwhile, a key governance vote is underway that could extend UNI token burns to v4 pools.
Why is Robinhood Chain so important for Uniswap?
Uniswap’s CEO, Hayden Adams, has revealed through a post on X that it is raking in over $5 million in fees every day, with Robinhood’s new blockchain, which launched on July 1, accounting for most of that money.
Of the $5.16 million in fees Uniswap collected over 24 hours, DefiLlama attributes $4.38 million to Robinhood Chain. In comparison, Ethereum, which used to be the protocol’s core market, contributed only about $296,000. Base was close behind at roughly $288,000.
Robinhood Chain, built on Arbitrum’s technology, went live on July 1. The trading activity on the blockchain has exploded since then, with more than 220,000 daily traders and cumulative volume hitting $1 billion in just nine days.
For UNI token holders, this could mean more token burns if a current “snapshot” vote regarding extending its fee-and-burn mechanism to v4 pools passes.
Uniswap was integrated as the main automated market maker from day one. Its v2, v3, v4, and UniswapX products were all deployed at launch. Over seven days, Robinhood Chain accounts for $10.98 million of Uniswap’s $20.1 million total weekly fees.
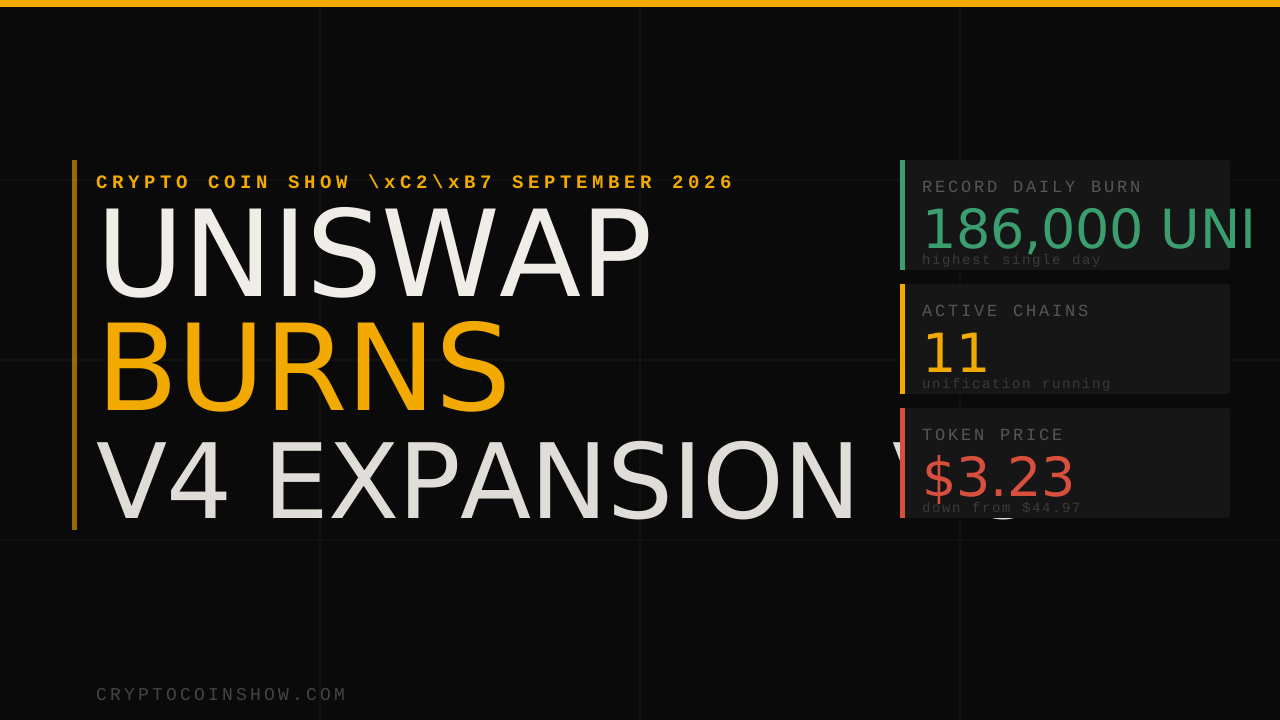
UNI is trading around $3.62, up roughly 35% from its early-July low of about $2.70. However, it remains about 92% below its all-time high of $44.97 reached in May 2021.
Across all 47 chains it operates on, Uniswap logged $2.112 billion in 24-hour DEX volume, more than five times the next-largest exchange, PancakeSwap.
The company’s CEO, Hayden Adams, posted on X that the protocol was out-earning every crypto project except the stablecoin issuers behind USDC and USDT.
However, it is important to note that these “fees” are not the same as protocol income. DefiLlama shows Uniswap’s 24-hour revenue at just $73,454. The bulk of the $5.2 million flows to liquidity providers, not to the treasury or token holders directly.
How will the snapshot vote affect users?
Cryptopolitan previously reported that Uniswap Labs is running a “Snapshot” vote from July 7th to the 12th. The vote is regarding whether or not to extend its fee-and-burn mechanism to v4 pools.
This mechanism is part of the UNIfication program approved in December 2025 that requires anyone who wants to claim fees from the protocol to first burn an equivalent value of UNI tokens. The burned tokens are permanently removed from circulation.
Early Snapshot results indicate over 93% approval, with about 13.9 million UNI votes in favor. If passed, binding on-chain votes are expected the week of July 13.
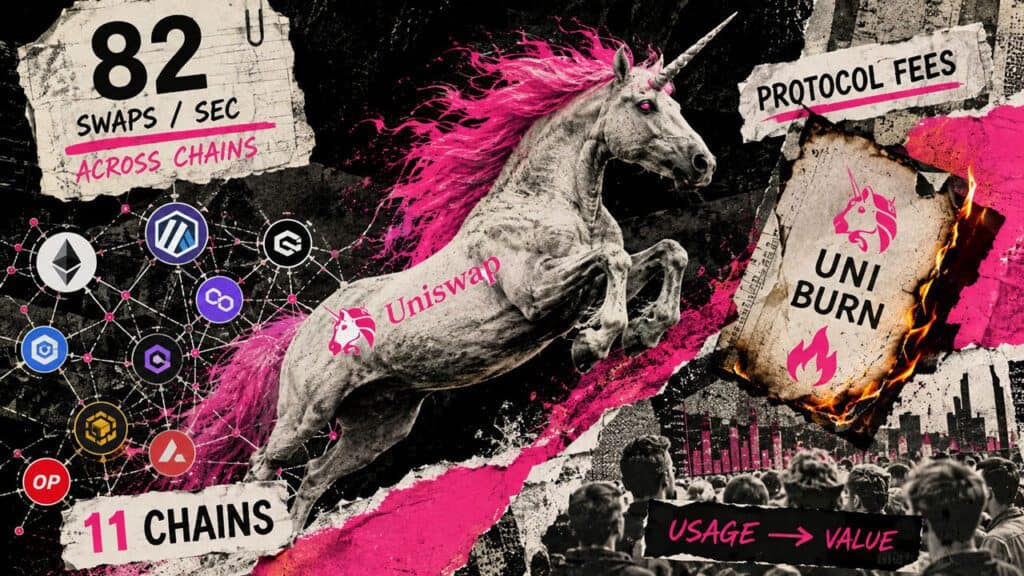
The proposal would activate fees on three families of v4 pools across 11 different blockchain networks, including Ethereum, Arbitrum, and Polygon. This expansion would broaden the burn engine to its largest scope yet.
Uniswap holds a record of burning 186,000 UNI in a single day last month, surpassing the previous daily high of 134,000.
However, liquidity providers have warned that the v4 fee switch could drive them away. Protocol fees are taken from the amount that LPs earn, so fee-enabled pools will offer slightly lower returns than those with zero fees.
Don’t just read crypto news. Understand it. Subscribe to our newsletter. It’s free.