The second-largest cryptocurrency has staged a minor resurgence in the past few days, yet certain bullish signals suggest it could be on the verge of a further rally.
Analysts speculate that the price may soon surpass $2,300, while others warn that a potential drop to as low as $1,000 might also be on the way.
Exodus From Exchanges and More
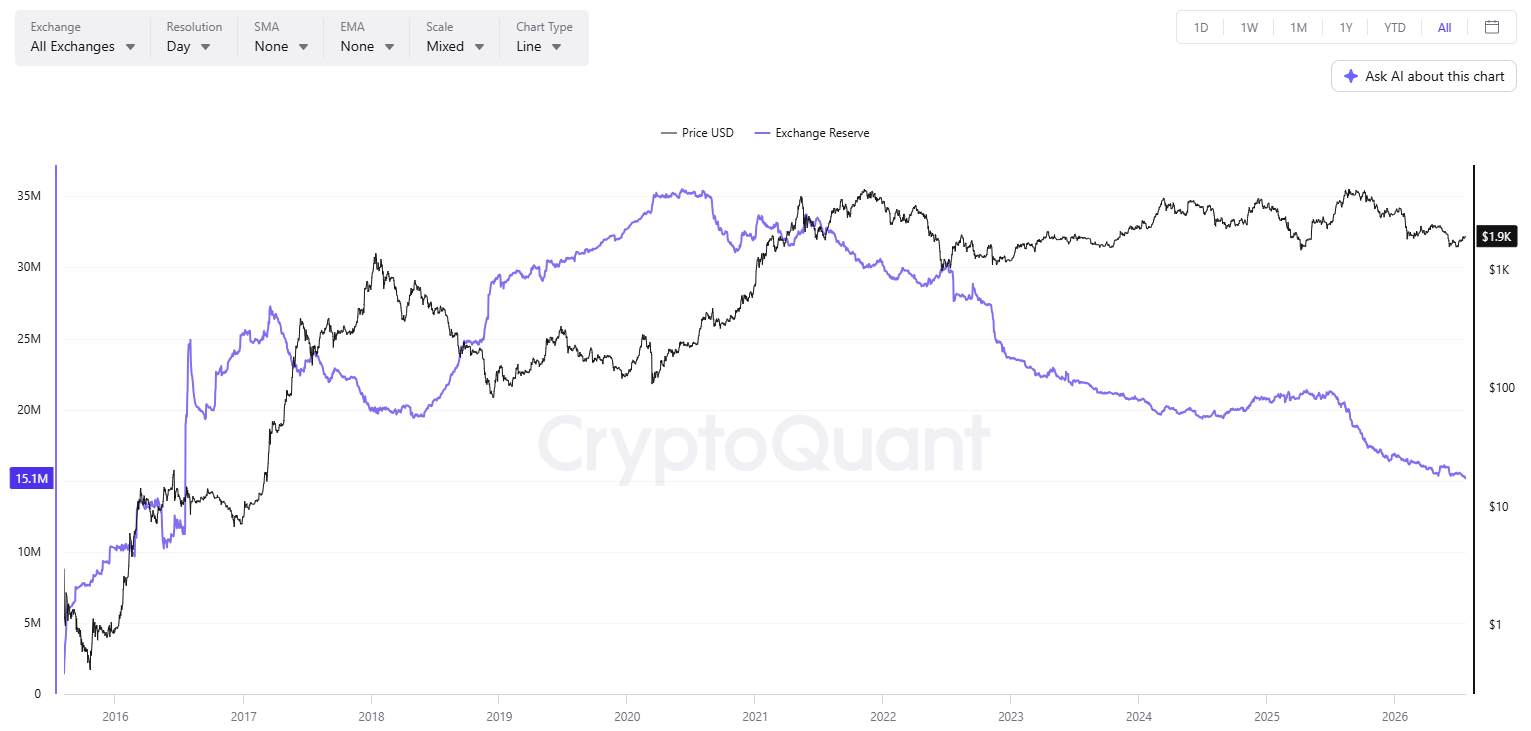
The popular analyst Ali Martinez revealed that investors have withdrawn roughly 1 million ETH (worth almost $2 billion) from centralized platforms over the last 30 days. A deeper look on CryptoQuant shows that the total figure has plummeted to around 15.1 million, marking the lowest level in the past 10 years.
ETH Exchange Reserve, Source: CryptoQuant
Such action is usually considered an optimistic sign for the cryptocurrency, with Martinez explaining:
“Falling exchange balances typically point to reduced sell-side pressure, a trend that supports Ethereum’s bullish outlook.”
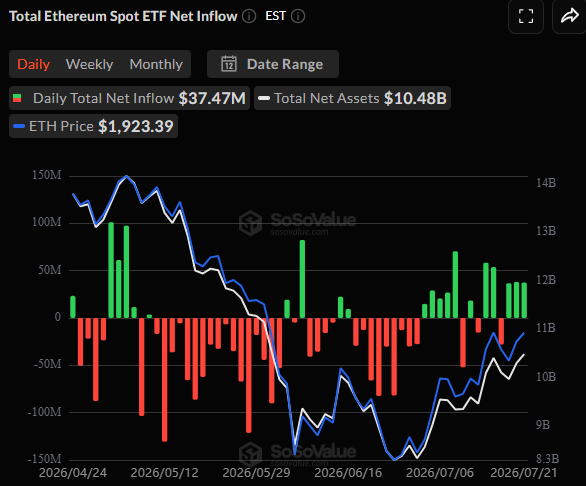
Another positive development surrounding the asset is the return of institutional interest. According to SoSoValue, inflows into spot ETH ETFs have been dwarfing outflows on most days this month, meaning that conservative investors like pension funds and hedge funds have increased their exposure, forcing BlackRock, Fidelity, VanEck, Franklin Templeton, and other financial behemoths to back the shares with real ETH.
Spot ETH ETFs, Source: SoSoValue
Institutions aren’t the only ones ramping up their interest in the asset, as earlier this week, Arthur Hayes (co-founder of BitMEX) spent over $2.5 million to purchase 1,332 units.
The Latest Forecasts
$2,300 appears to be a common short-term target outlined by multiple analysts. According to Ali Martinez, an increase of that magnitude is possible after the formation of a double bottom on ETH’s price chart and as long as the asset holds the $1,850 level.
For their part, KALEO envisioned a pump to $2.3K by mid-August, which could then be followed by a major drop to $1,200 and a revival in October.
Crypto Patel also gave their two cents. The analyst described a potential surge to $2,160-$2,400 as a likely scenario, going even further to predict a possible explosion to as high as $10,000 in the event of a confirmed close above $2,400. At the same time, they suggested that a rejection from the depicted range may open the door to a whopping crash to $1,500-$1,000.
Solana (SOL) joined the broader crypto rebound after cooling US inflation data, climbing back toward $80.
According to some analysts, this could be the beginning of a more substantial rally that might push the price well beyond the psychological level of $100.
SOL Turns Bullish
The renowned analyst Ali Martinez claimed that the Average True Range (ATR) stop has flipped below price, marking the first SuperTrend buy signal on Solana since October 10.
He believes that if buying pressure continues to build, SOL could surge toward $96 and even $121. At the same time, Martinez paid close attention to the $60 level, noting that a drop below that support would invalidate the bullish setup.
Michael van de Poppe also chipped in, suggesting that the asset is at an important crossroads. He thinks that if SOL manages to keep its current valuation at around $77, it may trigger a much more substantial upswing. On the other hand, he warned that a drop below $73 could trigger a retest of the lows in the coming weeks.
Bloomberg’s James Seyffart pointed to a key regulatory development that may swing momentum toward the bulls. He revealed that Wall Street giant Morgan Stanley has filed updated documents to launch a Solana ETF with the ticker MSOL and a 0.14% fee. An eventual introduction of such a financial vehicle could draw additional investors into Solana’s ecosystem and benefit the price.
It is important to note that Morgan Stanley wouldn’t be the only behemoth offering that kind of a product, as Bitwise, Fidelity, Grayscale, VanEck, Franklin Templeton, Invesco, 21Shares, and Canary Capital have already jumped on the bandwagon. The cumulative net inflow into spot SOL ETFs to date has reached almost $1.15 billion.
Another Positive Factor
The prolonged bear market and unmet ecosystem expectations have recently pushed Solana’s fear, uncertainty, and doubt (FUD) to its highest level for 2026.
This means that sentiment among market participants is extremely negative, and most weak-hand investors have already exited. The development could be interpreted as bullish, since the price often reverses when fear peaks, suggesting that the cycle’s bottom might have been formed.
MicroStrategy, rebranded Strategy, has unveiled a Bitcoin Banking Adoption Index scoring how far big banks embrace Bitcoin (BTC). It puts overall institutional adoption at 32%.
The index ranks 25 major banks by how deeply they offer Bitcoin services. Fidelity leads at 71%, far ahead of most European and Japanese lenders, which sit below 30%.
Strategy Launches Bitcoin Banking Adoption Index, Fidelity Leads at 71%
What the Bitcoin Banking Adoption Index measures
The index works like a report card for banks. MicroStrategy scores how much of the Bitcoin economy each firm has built in, then combines those marks into one percentage. For most readers, this measures how close everyday banking now sits to Bitcoin.
Many of those products are new, since US regulators approved the first spot Bitcoin ETFs only in January 2024.
A 32% overall score means banks have taken on about a third of what MicroStrategy tracks. The score blends many services, so a firm can rank high on custody yet low on lending.
“Major-bank Bitcoin adoption is accelerating, but still early: 32% overall as measured by the index,” noted Strategy executive chair, Michael Saylor.
The company drew the numbers from public data as of July 10 and calls them approximate.
Fidelity Leads while Japanese Banks Lag
Fidelity’s lead is no accident. It set up Fidelity Digital Assets, an institutional custody and trading arm, in 2018. The firm now issues a spot Bitcoin ETF too.
The gap widens by geography. European lenders such as Banco Santander and Société Générale sit mid-table near 35%. Japan’s SMBC and the Royal Bank of Canada trail at just 13%.
Strategy has a stake in the story it is telling. The company holds 843,775 Bitcoin, the world’s largest corporate Bitcoin treasury, so wider adoption supports its core bet. It published the index itself, invited corrections, and stressed the data is approximate.
Introducing the Bitcoin Bank Adoption Index. Adoption of Bitcoin and the related digital asset ecosystem across major banks and financial institutions is accelerating, but still early at 32%.
Methodology and updates to follow. Institutions with questions, corrections, or… pic.twitter.com/BEajJPIE63
Strategy said methodology details and updates will follow. Whether banks accept or contest their scores will test how seriously Wall Street treats the ranking.
Bitcoin’s current price sat near $61,900, down more than 3% on the day. Saylor’s longer-term outlook still bets on far deeper adoption from the banks ranked here.
The ETF became one of Wall Street’s most powerful distribution tools because it turned market exposure into an easy-to-use and easy-to-understand retail product.
Investors could buy an index, a basket of bonds, a commodity thesis, or a tightly packaged theme from the same account they use for blue-chip stocks. This was so convenient that it changed both investor behavior and issuer incentives at the same time.
Once the ETF wrapper became the default way for millions of buyers to gain exposure, issuers had every reason to keep stretching it into new territory.
That’s the backdrop for the SEC’s latest review of what it calls “novel” ETFs. The agency seems to be revisiting a broader boundary: how much leverage, derivatives exposure, structural complexity, and valuation risk can sit inside a product that most investors still treat as simple by habit.
That’s the backdrop for the SEC’s June 30 request for public comment on “novel” ETFs, which it defines as funds that invest in innovative asset classes or use novel strategies.
The agency listed crypto assets, commodity-focused instruments, single-stock strategies, heightened leverage, blockchain-enabled opportunities, private assets, and event contracts as products under consideration.
It also asked whether existing rules need new portfolio limits, strategy restrictions, or exclusions, beginning an exploratory review ahead of any proposed changes.
An ETF carries a lot of trust, and regulators are now asking whether that trust is being asked to do too much.
Crypto is one of several categories named in the request and is likely to draw particular scrutiny because digital-asset products combine volatile underlying markets with a familiar retail wrapper.
Crypto ETFs bring together several traits regulators tend to watch closely in newer ETF structures. They wrap volatile underlying assets in a familiar format, rely on markets that behave differently from ordinary equity markets, and have a customer base that sees approval as a judgment about the legitimacy of the asset and its wrapper.
An unfamiliar product in a familiar packaging
For years, the crypto ETF fight was about access: would the SEC allow mainstream investors to buy spot Bitcoin through a fund, or would it keep that exposure outside the traditional brokerage channel?
The legal terminology matters here. Spot Bitcoin products such as Fidelity’s FBTC are exchange-traded products rather than ETFs governed by the Investment Company Act of 1940, even though they are widely called ETFs.
The SEC’s request separately asks whether ETPs outside the investment-company framework should use the “ETF” or “fund” label.
That was the first and biggest fight because approval itself was the barrier. However, once a category gets through the door, access is no longer the issue, and product design takes its place.
An ETF can hold a broad stock index and behave in ways most advisers and investors understand immediately. But it can also hold derivatives, use leverage, concentrate exposure in a single issuer, or package an asset whose underlying market couldn’t be more different from the exchange where the shares trade.
Those differences all affect liquidity, valuation, investor understanding, and their behavior under stress. They also affect how quickly an ETF can become a complicated, high-risk structure.
The SEC has strong reason to focus on that line because much of the ETF boom has come from importing riskier exposure into a format retail investors often treat as safe by convention. Issuers want to satisfy demand and keep innovating, but regulators have to decide whether that innovation is making the market easier to use or just easier to sell.
Crypto funds are one of the biggest issues here because the wrapper makes them too familiar. The shares trade through known brokers and sit inside ordinary accounts, while the underlying assets bring weekend trading, fragmented liquidity, custody issues, and an unusually politicized approval process.
Even the trading-hours explanation on Fidelity’s FBTC page shows how the wrapper and the underlying market operate on different schedules. When the SEC looks at novel ETFs, it’s also looking at how long a familiar wrapper can mask an unfamiliar market structure.
That’s why the next phase of crypto ETF regulation is likely to focus on limits. Straightforward spot exposure is easier to explain, supervise, and distribute. Pressure builds once issuers move toward leveraged products, engineered income vehicles, broader token baskets, or hybrid structures that depend on layered assumptions about liquidity and pricing.
At that point, the SEC needs to decide what kind of complexity public-market investors should be asked to absorb through an ETF.
Crypto turns a debate about ETF design into a debate about legitimacy
Crypto ETFs will face more scrutiny because they carry structural complexity and political symbolism.
The crypto market behaves differently from equities, bonds, or broad commodity products with long histories in mainstream portfolios. At the same time, every new crypto ETF approval is seen as a signal about the federal government’s stance toward the asset class.
That symbolism was evident in the SEC’s own 2024 statement approving spot Bitcoin ETPs. The agency stressed that approval did not amount to an endorsement of Bitcoin, underscoring how much political meaning investors attach to a decision the SEC framed as a legal and market-structure judgment.
That’s why this broader ETF debate will shape crypto long after the fight over spot Bitcoin approval fades. If the SEC imposes firmer boundaries around complexity, crypto funds are likely to be among the products most affected.
Approvals may slow, disclosure expectations may get stricter, and issuers may have less room to build products that depend on investors trusting the wrapper more than they understand the underlying exposure.
That’s an important distinction for the crypto industry because access only helps normalize an asset class when the products themselves are sufficiently legible for advisers, fiduciaries, and ordinary investors to use with confidence.
Once access begins to resemble a delivery system for engineered complexity, its benefit weakens. At that point, wider distribution starts to expose fragility in the product design.
The broader market should pay attention for the same reason. ETF policy shapes what mainstream investing looks and feels like in retirement accounts, advisory platforms, and self-directed brokerage portfolios.
A category that reaches the public through transparent structures helps build one kind of investor culture. A category that arrives through opaque or heavily engineered products builds another.
Crypto’s long-term place in public markets will depend as much on which of those cultures takes hold as on whether the next fund gets approved.
The SEC’s scrutiny is more than a clash between Washington and the crypto industry. The commission appears to be deciding how much complexity the ETF wrapper should continue carrying and how much of that complexity public investors can reasonably be expected to evaluate for themselves.
Crypto funds are at the center of that problem because they place a volatile, politically charged asset class inside a format investors still associate with simplicity, liquidity, and convenience.
The industry has every reason to want broader access. It has just as much reason to want access that remains understandable once the wrapper is stripped away, and the product design has to stand on its own.
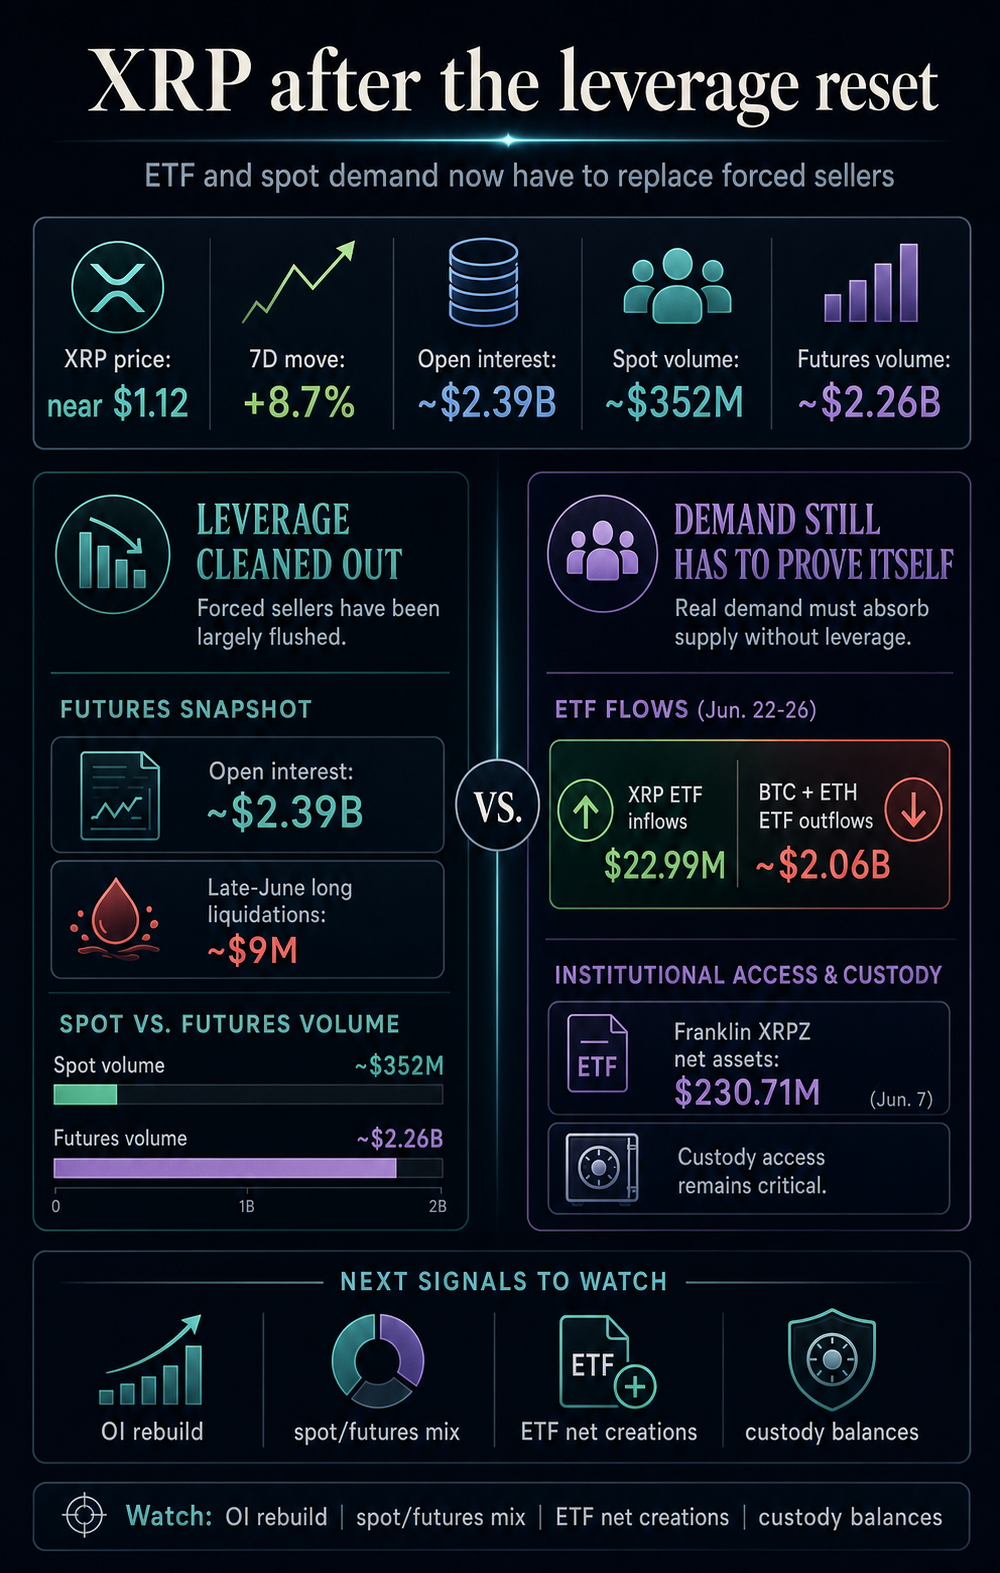
XRP’s late-June washout removed a major source of market instability: excess leverage that could have turned another sharp move into a liquidation cycle. The next test is harder because XRP now needs ETF and spot buyers to carry the market without rebuilding the same crowded futures trade.
The rebound is now a test of real demand. XRP has moved away from the pressure zone that defined the late-June washout, when prior CryptoSlate coverage showed the token falling to $1.02, long liquidations accelerating, futures activity shrinking, and realized losses hitting the weakest reading since 2022.
A market can stabilize after sellers run out, but a sustained rebound requires new buyers to step in.
CryptoSlate’s XRP market data shows the token trading near $1.08, up about 2.7% over seven days, with a market value of about $67 billion.
Coinglass data shows roughly $402 million in 24-hour spot volume against about $2.25 billion in futures volume, with open interest around $2.35 billion and about $8.3 million in liquidations over the prior day.
Bitcoin and Ethereum remain the main market anchors, with BTC dominance at 58.2% and ETH dominance at 9.9%.
While those numbers show XRP’s setup has improved, they still don’t answer the main question about demand. Futures look much more balanced than they did during the washout, although derivatives still dominate XRP’s visible turnover. ETF demand has been steady in recent flow windows, but its scale remains too small to settle the question on its own.
The reset lowers risk, but demand still has to show up
Open interest provides useful context for position size by showing how many futures contracts are active in the market. It tracks contracts that traders still hold, which helps show how much leverage may still be exposed to the next price move.
CoinGlass’ open-interest guide noted that falling OI can reflect forced liquidations, voluntary exits, or traders reducing exposure as volatility rises.
That range of possible causes shows why XRP’s reset can cut both ways. On the bullish side, fewer crowded positions mean fewer traders are sitting at liquidation levels that can turn a normal price move into a chain of forced selling.
We’ve seen this happen at the end of June. XRP’s drop toward $1.07 triggered about $9 million in long liquidations, and XRP open interest fell to about $2.34 billion.
Futures turnover was also down to roughly $2.84 billion from more than $30 billion during the same period last year.
That is a real reduction in speculative pressure across the XRP derivatives market. It means XRP can climb from a smaller pile of leveraged long positions. A smaller rally from that base can be healthier because fewer distressed positions are being closed into every bounce.
The bearish case is that a lower-risk setup still needs a demand engine. If open interest stopped expanding because traders lost conviction, the absence of forced sellers could be what creates temporary relief.
The market still needs a replacement buyer, and the obvious candidates are spot traders and ETF allocators.
The current numbers keep the picture balanced. While spot volume is meaningful, futures volume still represents a much larger share of XRP’s visible trading activity in CoinGlass data.
Liquidations have moved out of the main headlines, but open interest remains large enough for XRP to become a leverage-driven trade again. That risk increases if traders rebuild positions faster than spot demand improves.
That leaves a practical hurdle for any sustained move. XRP can coexist with active derivatives markets, but it needs spot buying and ETF allocations to expand while leverage stays contained.
A bounce driven mainly by lower liquidation pressure can give the market time to stabilize. However, sustained strength requires buyers who can absorb future selling from holders waiting to exit near cost.
ETF demand has been steady, but scale is the caveat
The stronger case for a healthier XRP market comes from regulated products that have continued to draw selective interest during broader risk-off periods. These products are an important part of the market because they represent demand outside the high-leverage futures trade.
CryptoSlate’s recent institutional-flow coverage showed that from June 22 to June 26, U.S. spot Bitcoin ETFs lost about $1.79 billion and U.S. Ethereum ETFs lost about $273.5 million.
XRP spot ETFs took in $22.99 million during the same period. That flow was directionally important because it showed XRP products gained assets while the largest ETF complexes saw outflows.
However, it’s important to note that the signal also came at a limited scale, because XRP’s $22.99 million inflow sat beside roughly $2.06 billion in combined Bitcoin and Ethereum ETF outflows.
That stops short of a wholesale rotation into XRP, but it points to selective buying in a market where institutions were still cutting broad crypto beta.
CoinShares’ June 1 fund-flow report carried a similar message. Digital asset investment products saw $1.67 billion of outflows, with Bitcoin losing $1.438 billion and Ethereum losing $257 million.
XRP was one of the few altcoins with meaningful positive demand, drawing $20.3 million. Again, the signal was positive, while the scale was modest compared with the capital leaving the largest assets.
The ETF inflows carry weight because they represent a different type of exposure from leveraged futures positions.
The Franklin XRP ETF S-1 says the fund is passive, seeks to reflect the price of XRP before expenses, and will avoid leverage, derivatives, or similar instruments.
Franklin’s launch release said XRPZ is structured as a grantor trust that holds XRP, with Coinbase Custody Trust Company serving as XRP custodian. The product page listed total net assets of $230.71 million as of June 7.
Grayscale’s GXRP page uses a similar passive framing, saying the fund is solely and passively invested in XRP. It also states that the fund seeks to reflect the value of XRP held by the trust, less expenses and liabilities.
There is a straightforward reason ETFs could provide stronger long-term support for XRP. ETF demand is much steadier than high-leverage futures activity because it moves through brokerage accounts, custody arrangements, and fund-share creation mechanics.
If allocations keep arriving, they can absorb XRP supply without depending on traders borrowing to make directional bets.
ETF demand becomes a dominant price force only when net creations are persistent enough to go against the rest of the market. Those creations are important because they indicate when ETF demand requires that underlying XRP enter the fund wrapper.
CryptoSlate’s earlier ETF analysis separated AUM from fresh buying because AUM can rise for several reasons. It can increase when price rises, when seed inventory exists, or when investors trade ETF shares with each other.
Net creations give a much better signal because they show the part of the ETF process that requires new XRP purchases. That makes them a more useful measure of direct ETF demand than AUM alone.
The next phase for XRP depends on whether a different buyer base is willing to take over after the worst of the wipeout.
Signal
Healthier signal
Weaker signal
Futures open interest
Stable or slowly rising while the price holds
Fast rebuild that recreates liquidation risk
Spot versus futures volume
Spot volume expands relative to derivatives
Rallies remain mostly futures-led
ETF flows
Positive net inflows continue through weak market days
AUM holds up, but net creations fade
Custody balances
ETF holdings keep absorbing supply
Custody growth stalls while price relies on leverage
A healthier XRP move can happen alongside active futures trading because liquid derivatives markets are normal for large tokens.
What would matter is balance: open interest that does not outrun spot buying, ETF flows that remain positive across several reports, and custody balances that show shares are backed by real XRP accumulation rather than secondary-market churn.
The available data is insufficient to prove that XRP’s rally is mostly short covering, though it shows why that explanation remains plausible enough to watch.
If price rises while futures volume dominates and open interest looks driven by position cleanup rather than fresh spot demand, the rally would be less convincing. If price holds while ETF inflows continue and spot volume improves, the market would show a stronger buyer base.
The most important shift is psychological. During the capitulation phase, XRP’s market was defined by traders who wanted to sell. After the wipeout, it’s defined by who actually wants to buy.
ETF demand and spot accumulation can answer that question when they appear in the data with enough persistence and scale. The flows need to be large and consistent enough to matter against futures activity and spot selling.
For now, XRP’s market structure is cleaner than it was during the late-June stress, which gives it a better starting point.
The next leg still has to show that ETF and spot buyers can provide stronger support than the relief created by the absence of forced sellers.
On-chain data has confirmed that June was a painful month for bitcoin (BTC), but beyond the price weakness, both spot demand and institutional flows faltered. Due to last month’s performance, there is speculation that the market may be nearing a cyclical bottom, but this remains unconfirmed.
In the meantime, analysts at the crypto exchange Bitfinex revealed in this week’s Bitfinex Alpha that historical data suggests that July could be better for BTC. However, a seasonality dynamic will not be able to sustain a recovery for BTC this month – the asset needs sustained spot and institutional demand.
Worst June in 4 Years
BTC fell to a fresh cycle low of $57,800 last month, marking the worst June since 2022 and the second-worst since 2013. Analysts say this dump was intensified by waning STRC demand and six consecutive weeks of outflows from Bitcoin exchange-traded funds (ETFs), the longest since their launch. The decline to $58,000 marked a 54.15% plunge from current cycle highs, and BTC ended June down 20.48%.
“June’s downside was likely deepened by the failure of both principal demand engines: waning STRC demand and ETF outflows that represented the worst streak on record. The month closed down 20.48 percent from its monthly open, far below the seasonal median of negative 1.5 percent. That sharp deviation left the market technically oversold heading into July,” analysts explained.
With BTC reclaiming the $60,000 level on July 1, market experts believe the plunge may have been a failed breakdown rather than a sustained leg lower. Additionally, the rebound indicated that spot demand had begun to return at marginal lows. Although the current setup supports a positive seasonality for July, only the return of stronger demand, particularly through renewed ETF inflows, will sustain recovery.
Will July Be Better?
In prior bear markets, June and November have been the weakest months, so July has historically been firmer. This month posted double-digit gains in 2018 and 2022 bear cycles. However, analysts believe it is too early to tell if the cycle lows are in. The stage for broader sustainable recovery is only set if the demand engines are repaired.
“Seasonality supports the current setup but will not drive it,” analysts stated.
Interestingly, the ETF market has witnessed a reprieve from the bearish regime – $223.5 million on July 2. However, analysts insist that one session of inflows is insufficient to reverse the damage from six weeks of outflows.
US spot Bitcoin (BTC) exchange-traded funds (ETFs) recorded $221.72 million in net inflows on July 2. It was the first positive day for Bitcoin ETF inflows since June 12, per SoSoValue data.
Glassnode’s latest weekly report, published Monday, describes Bitcoin as entering a consolidation phase. The firm sees spot selling pressure easing after weeks of heavy institutional redemptions.
Bitcoin ETF Inflows End a 10-Day Outflow Streak
Data from SoSoValue shows the July 2 print snapped a 10-day outflow streak that had drained the funds since mid-June. Total net assets stood at $74.37 billion after the reversal, down from above $100 billion in early May.
US spot Bitcoin ETF daily net inflows chart showing the July 2 turnaround, Source: SoSoValue
The pause in redemptions ends a punishing stretch. Spot Bitcoin ETFs shed nearly $9 billion across two months of outflows, the deepest institutional pullback since the products launched in January 2024.
Price action on Monday captured the market’s two-way tension. BTC slipped below $62,000 after Strategy, the largest corporate bitcoin holder, disclosed a sale. The price then rebounded over $2,300 within three hours to trade near $63,643 as of this writing.
BREAKING: Bitcoin has surged +$2,300 over the last 2.5 hours, recovering all of its losses following Strategy’s Bitcoin sale disclosure.
The swift recovery extends last week’s jump toward $62,000 off a June 25 low near $58,200. That trough sits roughly 54% below the October 6, 2025 peak of $126,080. The decline remains far shallower than the 77% to 84% drawdowns that closed the 2018 and 2022 cycles.
Glassnode Sees Consolidation as Selling Pressure Eases
In its Market Pulse report for week 28, Glassnode argued the market is moving away from aggressive distribution and toward equilibrium.
“The Bitcoin market is currently exhibiting signs of structural stabilization, characterized by a transition from aggressive distribution toward a state of equilibrium.”
Derivatives data supports the shift. Futures open interest has risen, and long-side funding payments have exceeded historical norms, signaling renewed bullish appetite. Meanwhile, moderation in the 25-delta options skew suggests demand for downside protection is fading.
On-chain activity tells a similar story. Active addresses and transfer volumes are rising, and the average ETF investor has returned to profit. Long-term holders continue to anchor the market despite lingering unrealized losses.
However, the firm flagged a growing share of hot capital, the short-term and price-sensitive money that often precedes sharper swings. Monday’s whipsaw around the Strategy disclosure fits that pattern, with volatility rising even as profitability improves.
Shrinking Stablecoin Liquidity Clouds the Recovery
Not every gauge supports the recovery case, however. Analytics firm CryptoQuant flagged a contraction in stablecoin liquidity.
“USDC and USDT market cap are down -3.6% and -2% respectively over the past 30 days. Overall, we can see that this slowdown has now been in place since November 2025,” wrote CryptoQuant.
Stablecoins are the primary dry powder for crypto purchases. A liquidity slowdown dating to November 2025 could therefore starve the ETFs of follow-through demand.
Without fresh capital entering the system, July 2 risks standing as a one-day reprieve rather than a turn.
Sustained inflows over the coming sessions would show whether institutional demand has truly returned. For now, the longer-term Bitcoin outlook hinges on whether consolidation resolves higher before liquidity tightens further.
Wall Street’s Bitcoin expectations have taken another hit. Citi has cut its 12-month Bitcoin target to $82,000 from $112,000, pointing to weaker investor appetite, negative ETF flows, and a slower regulatory backdrop in the United States.
The move is not just another forecast revision. It shows how much of the institutional Bitcoin thesis still depends on one input: whether spot ETFs can keep attracting fresh capital.
For more details, visit the official Reuters platform.
TL;DR
Citi lowered its Bitcoin target to $82,000 and cut its Ether forecast to $2,240. The bank also reportedly reduced its assumed net ETF inflows over the next 12 months to zero, down from a previous expectation of $10 billion. That is the real headline for crypto markets.
Price targets are easy to debate. Flow assumptions are harder to ignore.
Bitcoin’s ETF launch era gave the market a clear institutional demand story. For a while, that story helped support higher prices and stronger confidence. But when flows turn negative, the same structure works in reverse. Analysts do not simply mark down price targets because BTC fell. They mark them down because the demand model behind the price target has changed.
That is what Citi’s revision reflects.
The ETF Bid Is Being Repriced
The key issue is not whether Bitcoin can still trade above Citi’s target. It can. Crypto price targets are never guarantees. The more important point is that one of the market’s most widely followed demand channels has become less reliable.
ETF flows have been treated as the bridge between traditional portfolios and Bitcoin exposure. If those flows weaken, the market has to lean more heavily on native crypto demand, corporate treasury buyers, and long-term holders.
That can still be enough. But it makes the path more volatile.
Citi’s cut also lands at a moment when digital asset treasury companies are under closer scrutiny. If investors worry that treasury buyers may become sellers, the market’s confidence in institutional accumulation weakens further. That does not mean a wave of forced selling is inevitable, but it adds another layer of caution.
Why This Matters For Bitcoin Traders
For traders, the message is simple: Bitcoin needs a new catalyst or a repair in ETF flows.
A stronger macro backdrop could help. So could clearer US digital asset legislation, a return of ETF inflows, or renewed accumulation from long-term holders. Without one of those, the market may struggle to rebuild the same momentum it had when spot ETF demand was the dominant story.
That does not make Citi’s $82,000 target bearish in absolute terms. It is still above current prices. But it is a meaningful downgrade from the earlier view and shows that institutional expectations are being reset.
Bitcoin has survived plenty of forecast cuts before. The question now is whether the ETF market can stop being the reason analysts lower their numbers and start being the reason they raise them again.
This report is based on information from Reuters and Citi’s reported market forecasts.
This article was written by the News Desk and edited by Samuel Rae.
The last trading day of the previous business week finally brought some more net inflows rather than consistent outflows for the spot Bitcoin ETFs in the United States.
The products tracking the world’s largest altcoin had even more to celebrate at the end of the week, but still closed in the red.
The Good and the Bad: BTC ETF Edition
There’s no need to sugarcoat the end result – the week was still dominated by the bears. Investors pulling out funds from the spot Bitcoin ETFs withdrew $526.64 million throughout the four-day trading week. This means that the overall negative streak continues as the products have not seen a single green week in almost two months.
Within this timeframe, the total cumulative flows have dumped from $59.34 billion to $51.08 billion. July 1 saw the most daily withdrawals, with $294.62 million leaving the funds, according to SoSoValue data. Another $222.64 million went out on June 30 and $231.10 million on June 29. That’s all on the negative side.
The bright side was July 2. After 10 consecutive days of only net inflows, the streak was broken as investors poured in $221.72 million. Moreover, this was the highest single-day inflow recorded since May 5. Friday was a non-trading day due to the July 4 holiday, meaning that the week ended on a more positive note.
Spot Bitcoin ETFs Net Flows. Source: SoSoValue
Ethereum ETF Edition
The daily performance of the financial vehicles tracking ETH was even more promising. The Ethereum ETFs saw more modest $30.04 million withdrawals on June 29 and $27.60 million on June 30. However, the tides turned during the next two business days.
Investors poured in $14.89 million on Wednesday and $29.08 million on Thursday, marking a near-monthly high. Nevertheless, the week still ended in the red, with total net outflows of $13.67 million. As such, the negative streak of the Ethereum ETFs continues, with eight straight weeks in the red. The total cumulative flows are down from $12.09 billion in early May to $10.89 billion on Thursday.
On the more positive side, though, it was a lot less harmful than the $273.34 million taken out during the previous business week.
Although July has only just begun, the past seven days brought some much-needed and long-awaited relief to the cryptocurrency market, even if the overall sentiment remains nothing but fragile.
Last week at this time, Bitcoin was still struggling around the $60,000 mark after the painful correction that was charted in June. The cryptocurrency spent the weekend moving mostly sideways, as neither bulls nor bears managed to take control.
The real action only started at the beginning of the business week. BTC attempted to recover, but was quickly rejected near $60,700, which allowed the sellers to push it lower. The pressure intensified on Tuesday, when Bitcoin, alongside the majority of the broader market, including the S&P500, the Nasdaq, as well as major tech stocks, took a beating. BTC dumped below $59,000 and slipped toward $58K on some exchanges, marking its intraweek low.
However, that support held firm. The cryptocurrency bounced back and quickly reclaimed $60,000. Later, it pushed toward $62,000 as buyers returned and spot Bitcoin ETFs finally saw renewed inflows after a brutal streak of outflows.
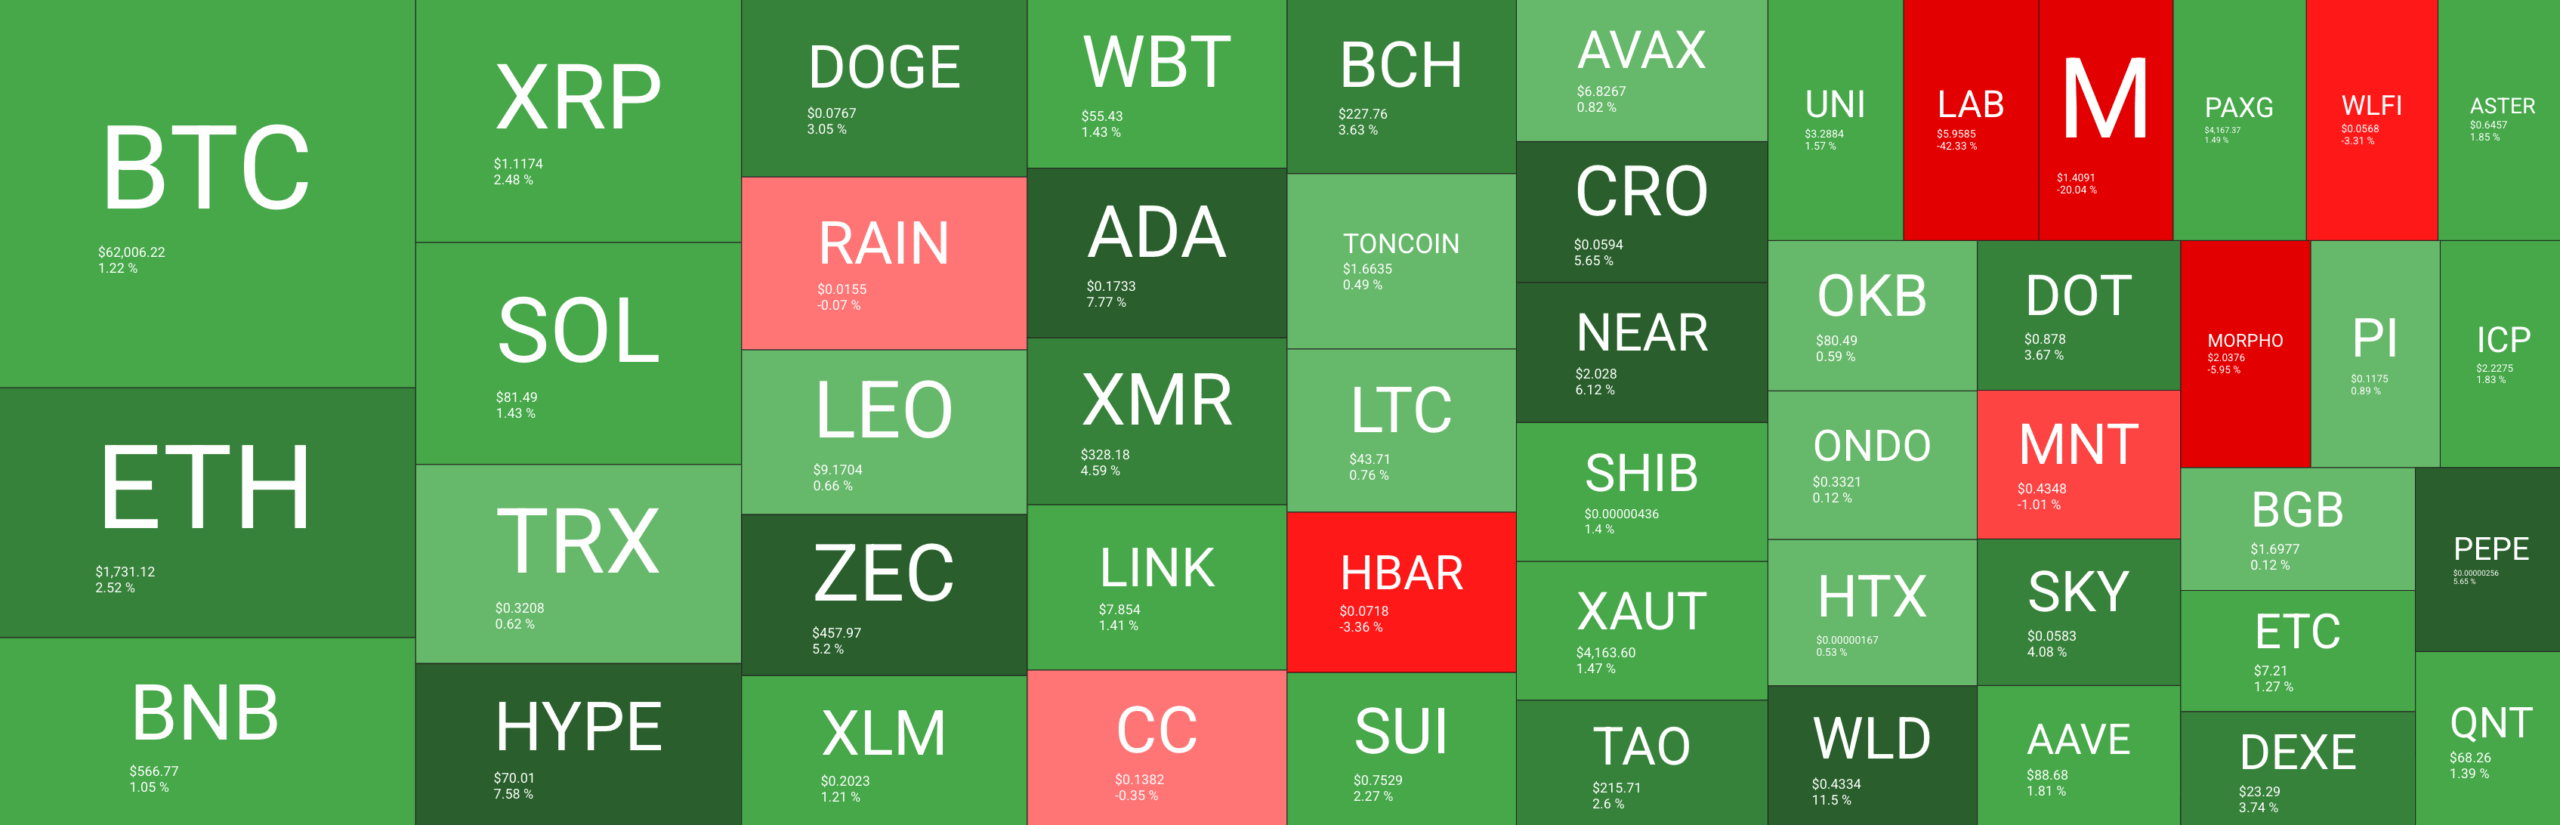
Altcoins were also able to follow, and some of them even marked sharper increases. ETH recovered strongly and moved back toward $1700, while SOL was among the best performers with a double-digit weekly jump. XRP, DOGE, ADA, XLM, and HYPE also joined the rebound, helping the total crypto market cap recover some of its recent losses.
The week was also packed with some major headlines. Donald Trump’s latest financial disclosure showed that he holds more than $50 million in Bitcoin, reigniting strong debates. FBI Director Kash Patel also amended a disclosure that was associated with Strategy’s stock, while Securitize made its NYSE debut and launched tokenized shares on Solana and Avalanche.
Overall, the bulls were finally able to stop the bleeding. However, this doesn’t mean that the worst is over. BTC still needs a decisive breakout above pivotal levels around $70K to prove that this was more than just a slight dead cat bounce.
Tokenized Stocks Emerge as Altcoin Lifeline Amid Crypto Market Reset. A new report argued that tokenized stocks are becoming one of crypto’s few bright spots, as persistent token unlocks and weak altcoin narratives continue to wear speculative assets down. The analyst also outlined that Solana is currently dominating tokenized equity trading alongside Hyperliquid’s HIP-3.
Why Bitwise’s Matt Hougan Thinks Strategy’s Bitcoin Era Is Fading. The CEO of Bitwise, Matt Hougan, said that Strategy’s role as one of the largest corporate buyers of Bitcoin is likely going to fade, especially as the next cycle could be led by institutions such as banks, asset managers, pension funds, and sovereign wealth funds.
Standard Chartered Becomes First Major Bank to Offer Direct Stablecoin Services. Standard Chartered became the very first major global bank to offer direct USDC minting and redemption services to institutional clients through its banking platform. The service was launched with Circle in Dubai’s DIFC.
Can Circle Defend Its Stablecoin Lead Against OpenUSD? Experts Weigh In. Experts, on the other hand, warned that Circle itself might be facing one of its toughest challenges yet from OpenUSD – a new stablecoin backed by major financial and payments firms such as Visa, Mastercard, BlackRock, and Coinbase.
UK Investors Sue Binance and Former CEO Changpeng Zhao for $200M. A group of 1,700 UK investors sued Binance and its former CEO – Changpeng Zhao – in London’s High Court. The plaintiffs seek roughly $200 million in damages, claiming that the exchange sold unauthorized derivatives products.
The Vanishing Bitcoin Bid: Where Are the ETF Billions Going? HashKey research Tim Sun told us that Bitcoin’s recent ETF outflows may reflect capital rotating into AI, semiconductors, and GPU-related stocks rather than a complete collapse in risk appetite.

 Indicator Finally Flashes a Buy Signal: Can Bulls Push to $120?")