Ethereum (ETH) whales keep adding to their holdings while the price trades near $1,963, up 4.3% in the last 24 hours. Three separate datasets now point to an accumulation two weeks after ETH broke its long-term descending trendline.
Glassnode data shows growing whale addresses, and US spot ETF flows have turned positive. However, one metric still refuses to confirm the recovery.
Ethereum Whales Grow Their Ranks at Yearly Lows
Glassnode’s whale address count tracks wallets holding between 1,000 and 10,000 ETH. The metric bottomed near 4,750 addresses in early June and has since climbed toward 4,850.
Meanwhile, the 30-day change has stayed positive through most of July. This suggests sustained accumulation rather than a short-lived spike.
The timing separates this move from October 2025. Back then, Ethereum whales spiked while ETH traded near its record high, and the rally reversed soon after. This time, large holders are buying close to yearly lows.
Fresh wallets also bought 50,000 ETH in mid-July as the ETH/BTC ratio jumped 6%. A flip of the 30-day change back below zero would weaken the signal.
ETF Inflows Return After 8 Weeks of Outflows
Institutional flows tell a similar story. US spot Ethereum ETF net flows flipped positive in July after roughly eight weeks dominated by outflows.
The funds have now recorded a third straight week of inflows, adding $103.9 million in the week ending July 24. Green bars have dominated the Glassnode flow chart throughout the month.
Still, the scale remains modest. Daily inflows sit in the tens of millions, far below the $600 million to $1 billion days of August 2025. Institutional demand is returning, not surging.
A return of sustained daily outflows would flip this signal back to bearish.
Active Addresses Remain the Missing Piece
Network activity complicates the bullish setup. The 14-day moving average of Ethereum active addresses sits near 400,000, according to Glassnode.
That reading stands far below the February 2026 spike near 800,000. It also trails the June local peak of roughly 460,000. In other words, accumulation is not yet backed by growing usage.
Crowd sentiment has also turned deeply bearish, although Santiment treats such readings as contrarian signals. The previous two pessimism extremes preceded ETH rebounds.
ETH Price Prediction as $2,000 Caps the Breakout
The daily chart shows why these signals matter now. A descending trendline from the August 2025 record high rejected the ETH price five times before the mid-July breakout, which came with futures open interest near $19.8 billion.
The price has held above the broken trendline for two weeks. It now presses into the resistance zone just below $2,000, a level with clear psychological weight.
A confirmed daily close above $2,000 could open the way toward the 0.618 Fibonacci retracement at $2,438. That target sits about 24% above the current price and overlaps the supply zone from May.
However, rejection remains possible. In that scenario, ETH could retest the 0.786 Fibonacci level at $1,754 and the broken trendline near $1,600. The green demand zone in that area has supported the price before.
Volume keeps declining during the recovery, which fits an accumulation phase but leaves the breakout unconfirmed. Either the whales, the ETFs, and the chart pull the price through $2,000, or ETH revisits the zone that launched this move.
The second-largest cryptocurrency has staged a minor resurgence in the past few days, yet certain bullish signals suggest it could be on the verge of a further rally.
Analysts speculate that the price may soon surpass $2,300, while others warn that a potential drop to as low as $1,000 might also be on the way.
Exodus From Exchanges and More
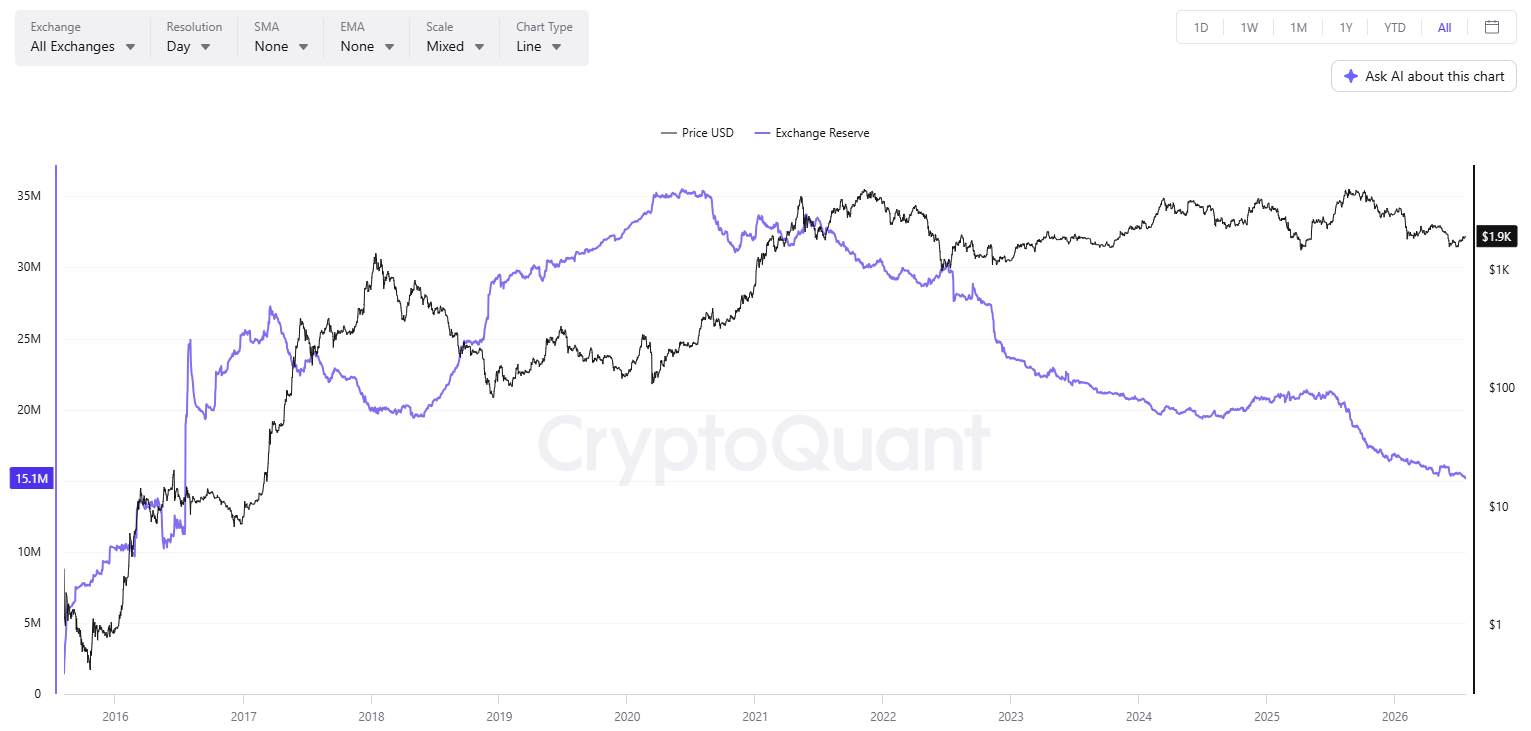
The popular analyst Ali Martinez revealed that investors have withdrawn roughly 1 million ETH (worth almost $2 billion) from centralized platforms over the last 30 days. A deeper look on CryptoQuant shows that the total figure has plummeted to around 15.1 million, marking the lowest level in the past 10 years.
ETH Exchange Reserve, Source: CryptoQuant
Such action is usually considered an optimistic sign for the cryptocurrency, with Martinez explaining:
“Falling exchange balances typically point to reduced sell-side pressure, a trend that supports Ethereum’s bullish outlook.”
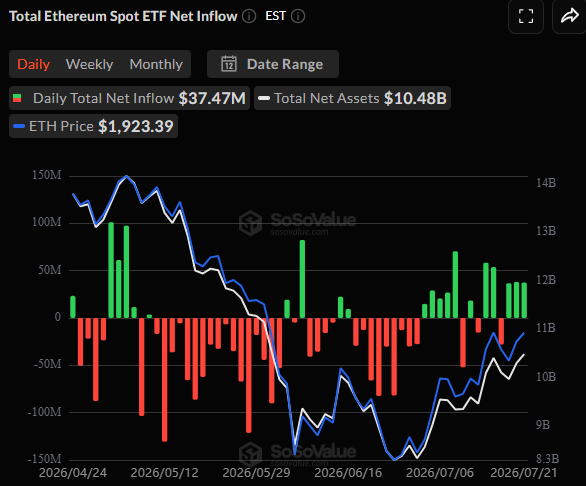
Another positive development surrounding the asset is the return of institutional interest. According to SoSoValue, inflows into spot ETH ETFs have been dwarfing outflows on most days this month, meaning that conservative investors like pension funds and hedge funds have increased their exposure, forcing BlackRock, Fidelity, VanEck, Franklin Templeton, and other financial behemoths to back the shares with real ETH.
Spot ETH ETFs, Source: SoSoValue
Institutions aren’t the only ones ramping up their interest in the asset, as earlier this week, Arthur Hayes (co-founder of BitMEX) spent over $2.5 million to purchase 1,332 units.
The Latest Forecasts
$2,300 appears to be a common short-term target outlined by multiple analysts. According to Ali Martinez, an increase of that magnitude is possible after the formation of a double bottom on ETH’s price chart and as long as the asset holds the $1,850 level.
For their part, KALEO envisioned a pump to $2.3K by mid-August, which could then be followed by a major drop to $1,200 and a revival in October.
Crypto Patel also gave their two cents. The analyst described a potential surge to $2,160-$2,400 as a likely scenario, going even further to predict a possible explosion to as high as $10,000 in the event of a confirmed close above $2,400. At the same time, they suggested that a rejection from the depicted range may open the door to a whopping crash to $1,500-$1,000.
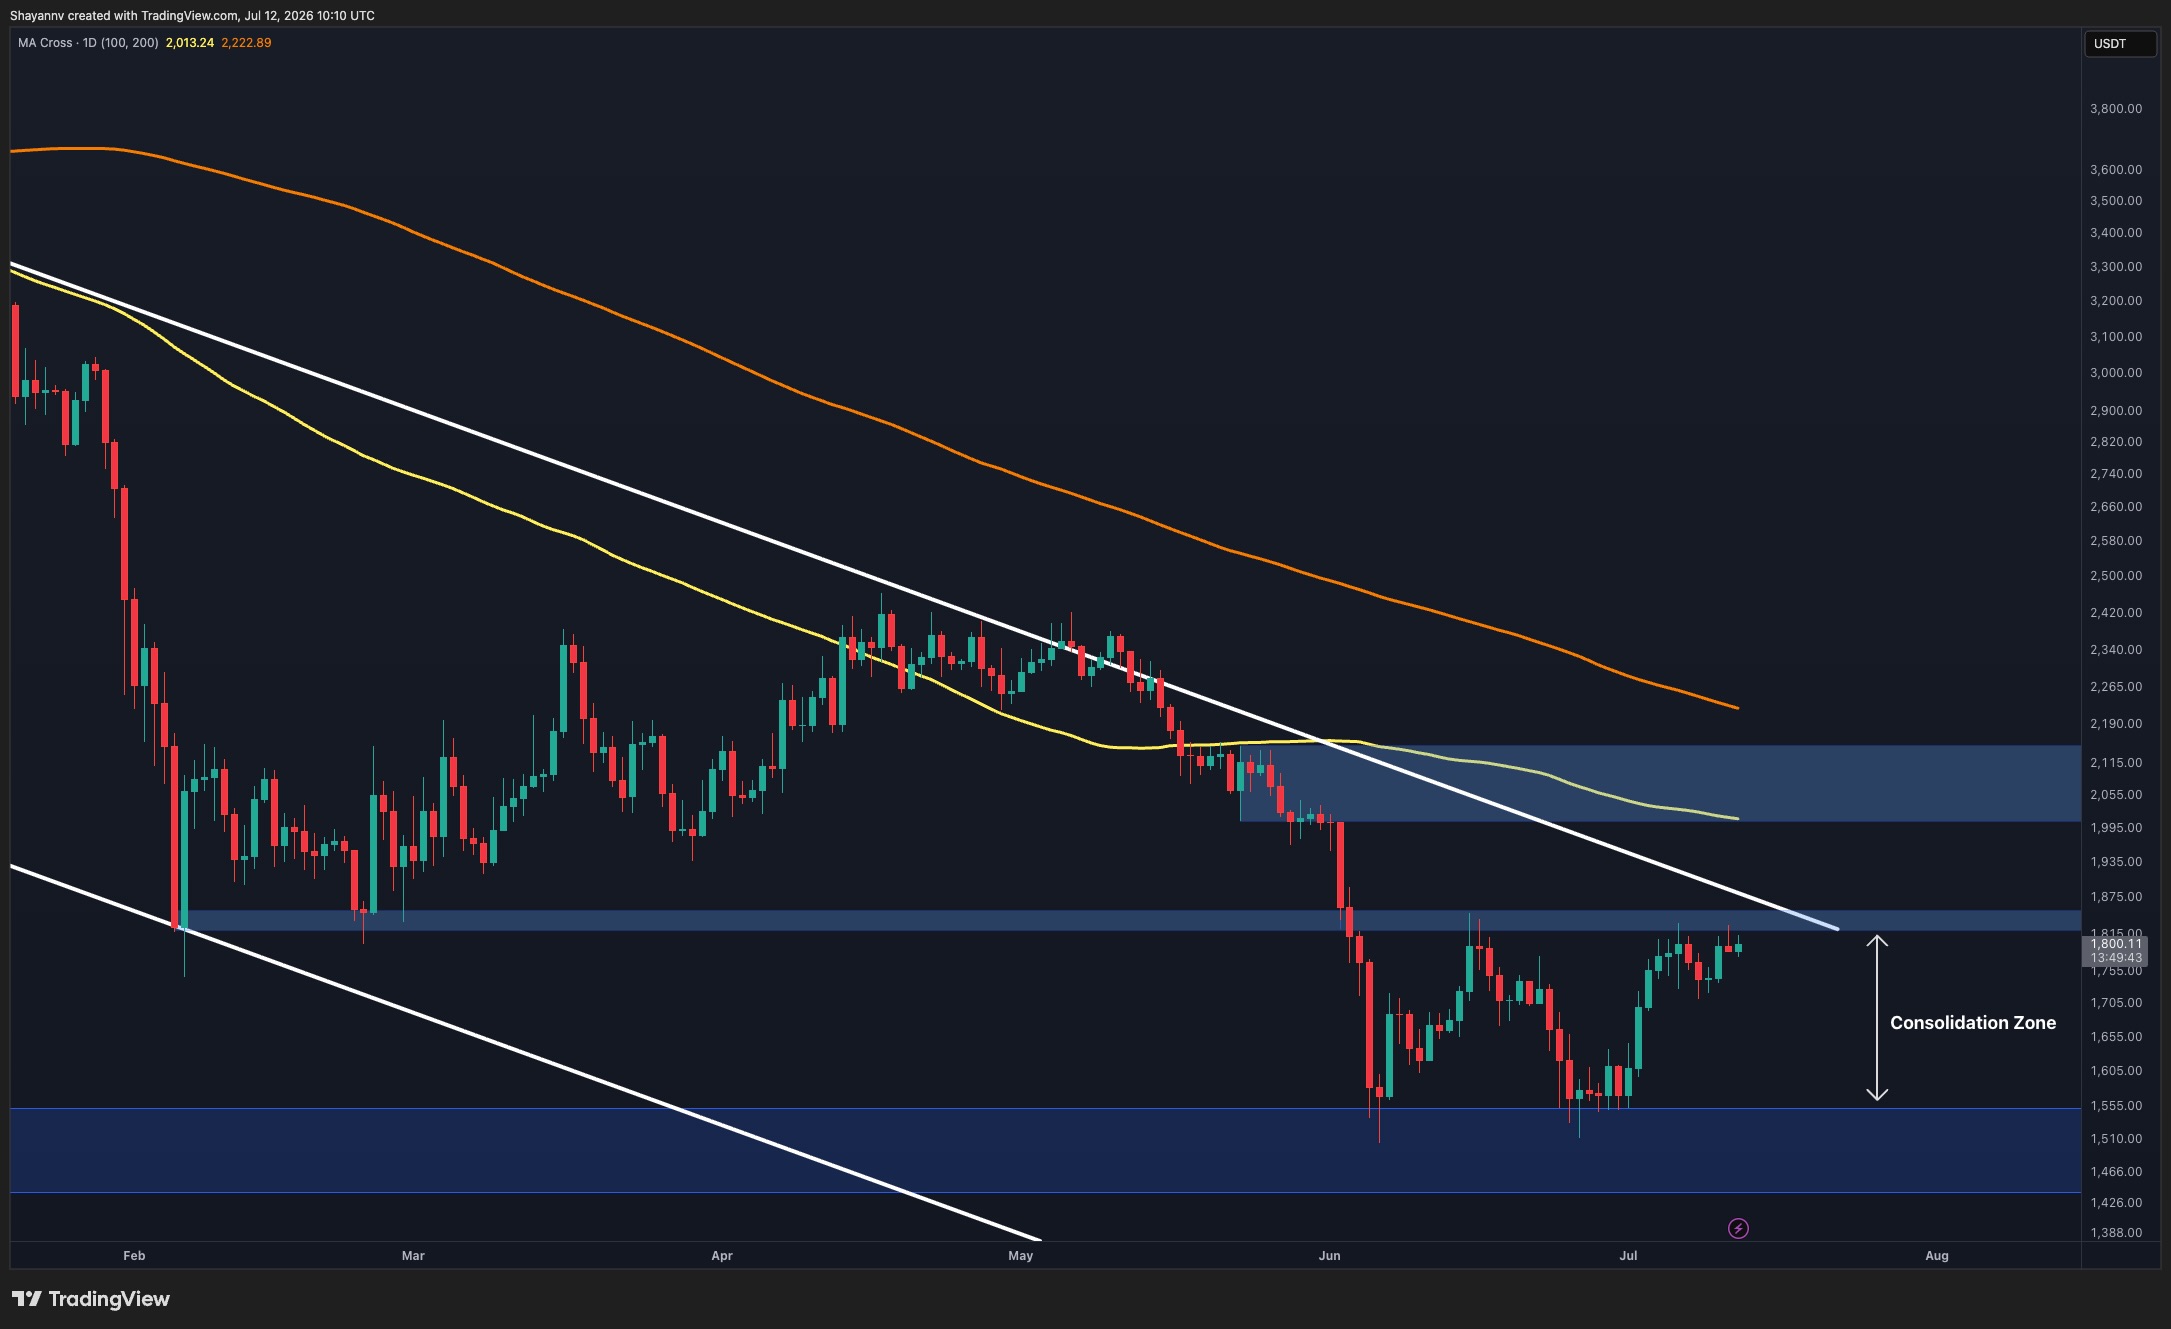
Ethereum remains trapped below a major higher-timeframe resistance cluster despite recovering strongly from its June lows. The recent rejection near local highs has pushed the asset back into an important support zone, while the price is approaching a technical decision point that should determine whether buyers can extend the recovery toward higher resistance or whether another corrective leg unfolds.
ETH Price Analysis: The Daily Chart
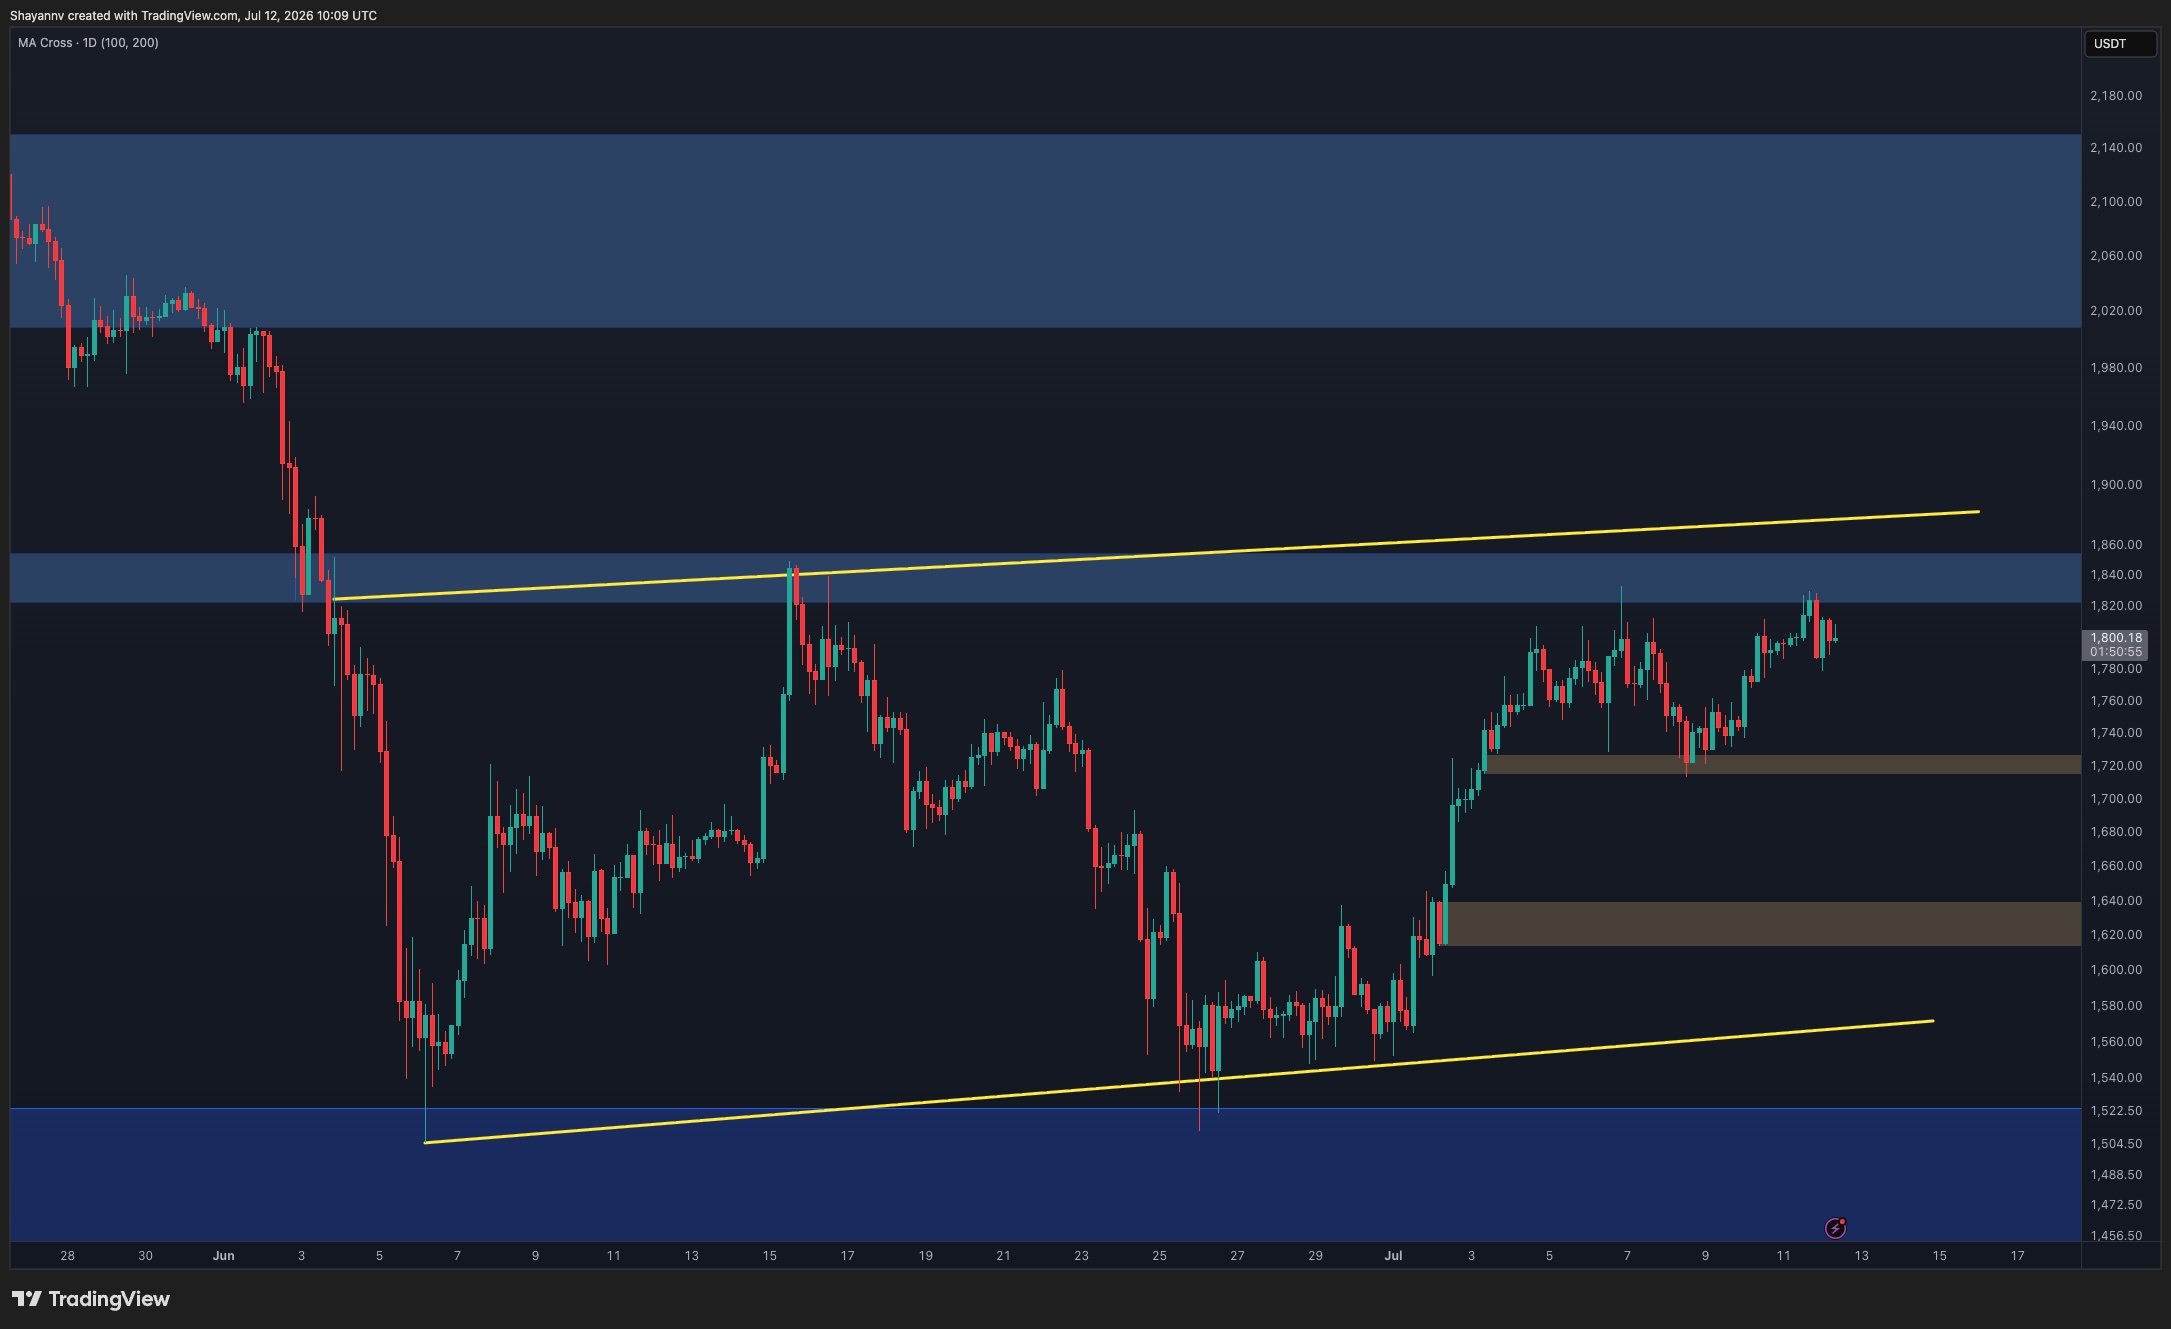
On the daily timeframe, ETH continues to trade below the descending 100-day and 200-day moving averages, confirming that the broader market structure remains bearish despite the recent rebound.
The asset recently failed to sustain a move above the short-term resistance around $1.9K and has now pulled back into the $1.75K-$1.85K demand zone. This region has acted as support throughout the current recovery and now represents the first line of defense for buyers.
As long as Ethereum holds above this area, another push toward the major decision zone between $2K and $2.15K remains possible. This region also aligns with the descending long-term trendline and the declining 100-day moving average, making it the most significant resistance cluster on the daily chart.
A successful breakout above this confluence would mark an important structural improvement, while rejection would likely shift attention back toward the long-term demand zone around $1.45K-$1.55K.
ETH/USDT 4-Hour Chart
The 4-hour chart shows Ethereum pulling back after failing to extend above the recent swing high near $1.95K. The correction has pushed it back to the short-term demand zone around $1.76K-$1.84K, which has repeatedly attracted buyers over the past week.
This area now serves as the immediate support needed to preserve the sequence of higher lows established since early July. Holding above it could allow another attempt toward the upper boundary of the current recovery structure and eventually the daily resistance around $2K.
However, losing this demand zone would likely expose the lower support levels around $1.7K before buyers attempt another recovery.
Sentiment Analysis
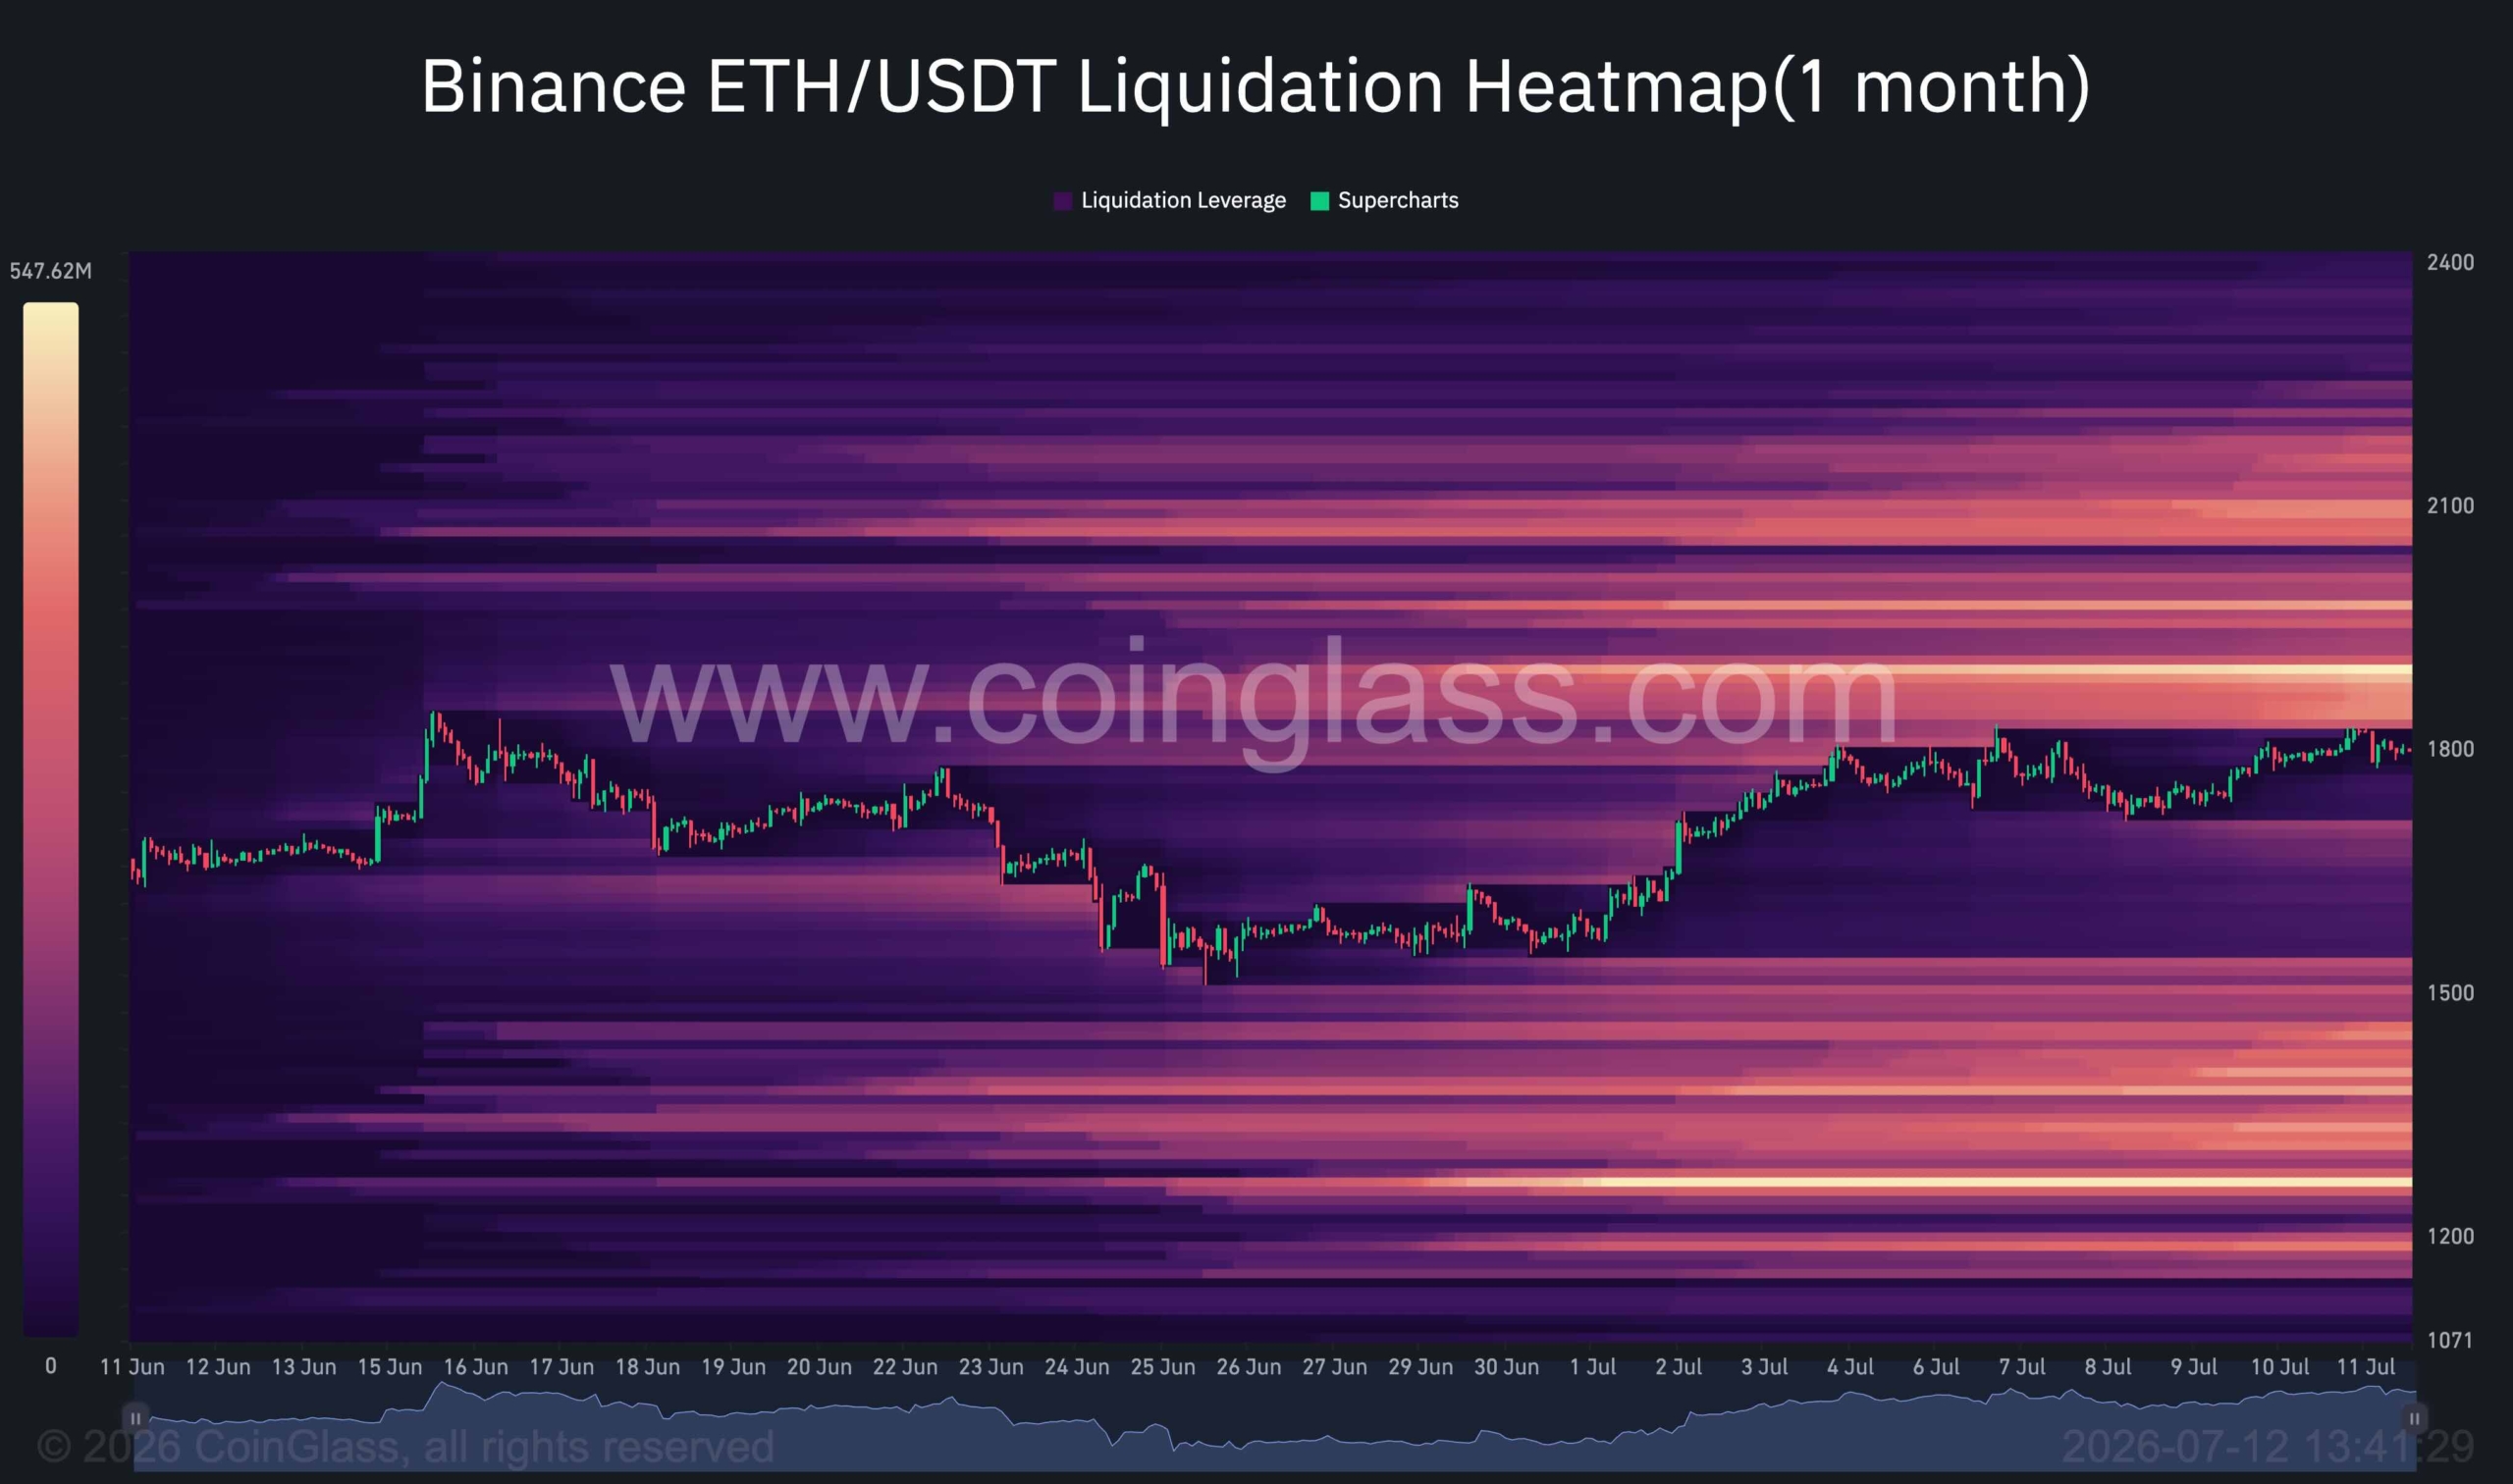
The liquidation heatmap highlights a large concentration of short liquidations positioned above the current market, with the most notable liquidity cluster sitting around the $1.95K-$2K region.
Importantly, this liquidity pool aligns closely with the key technical resistance visible on both the daily and 4-hour charts. The cluster sits directly beneath the higher-timeframe supply zone around $2K-$2.15K and near the descending trendline, creating a strong confluence between derivatives positioning and technical resistance.
This alignment increases the probability that Ethereum could first stage an upside liquidity grab into the $1.95K-$2K area to sweep leveraged short positions before facing renewed selling pressure from the overhead supply zone. A decisive breakout through both the liquidity cluster and the daily resistance would invalidate this scenario and instead strengthen the case for a broader bullish reversal.
Fundstrat’s Tom Lee has stated that Ethereum is set to benefit from the artificial intelligence boom, publishing his case on Friday, July 17, the same day a global rout in chip stocks erased over $3.3 trillion in market value and pushed semiconductors to the edge of a bear market.
Lee, who founded the Ether treasury company Bitmine Immersion Technologies (NYSE: BMNR) and is the current chairman, called Ethereum “a key AI downstream story” in a post on X.
Lee added that AI systems will need guardrails, and consumers are unlikely to trust governments, big technology firms, or banks to protect them.
In a chairman message released on July 16, under the title “ETH is the Cure for the Uncanny Valley of Wealth,” Lee spoke on two exponential tailwinds for Ethereum and also mentioned that crypto’s headwinds of 2026 are ending. He also said that Bitmine is primed for the next bull cycle.
The Philadelphia Semiconductor Index fell by 4.8% on Friday, extending a month-to-date drop of about 20% that carried it into technical bear-market territory.
Other reports put the scale of the damage at around $3.3 trillion wiped from global chip stocks since June 22, with the index sitting less than 1% above the level that would confirm a 20% decline from its June high.
Nvidia fell by 3.7%, with Apple reclaiming its title as the world’s most valuable company. Arm dropped 7%, and Advanced Micro Devices (AMD) fell 7.8%.
TSMC also dropped by 7.29%. Netflix fell more than 9% after disappointing forecasts, while Japan’s Nikkei 225 shed 4.03% and South Korea’s KOSPI slid 6.37% before its market closed. Traders say that the crash was triggered by fading conviction that the AI-driven rally will hold.
Crypto did not escape the risk-off mood. Bitcoin traded near $63,200 on Friday, down about 2%.
What is Lee actually selling?
Lee’s Ethereum thesis rests on a view that has support beyond Bitmine’s own marketing. BlackRock’s CEO Larry Fink has called Ethereum “the toll road to tokenization,” a line his former head of crypto Joseph Chalom repeated in March, pointing to the network’s role in moving traditional assets on-chain.
This week, SBI, one of Japan’s largest financial groups with 78 million customers, chose Ethereum to issue JPYSC, described as Japan’s first trust-based yen stablecoin, built with Startale Group.
Apollo Global Management’s Torsten Sløk warned that a mistimed pullback by AI hyperscalers “would risk tipping the economy into recession and the S&P 500 into a correction.”
However, not everyone is bearish. UBS Wealth Management’s Charlie Anderson forecast the S&P 500 would reach 7,900 by year-end, saying that the market has shifted from macro headlines to company fundamentals.
Bitmine’s own numbers cut against the pitch
Bitmine holds 5.77 million ETH, about 4.8% of the total supply and 96% of the way to its stated goal of owning 5%, Cryptopolitan reported. But with ETH trading around $1,840, which is well below the firm’s average cost of roughly $3,997 per token, Bitmine is carrying an unrealized loss of about $9 billion.
BMNR has traded near 52-week lows, and the company’s market value has fallen below the worth of the ETH on its balance sheet.
The company is leaning on staking to bridge the gap. Bitmine has staked about 4.92 million ETH, which is 85% of its position, earning a 2.7% annualized yield that Lee projects will generate around $242 million a year. This is enough to cover the 9.5% dividend on the preferred stock it issued in June.
The Ethereum (ETH) price broke out of a descending trendline that had capped it since the all-time high, while futures open interest climbed to $19.8 billion. ETH trades near $1,928, up 5.2% in the last 24 hours.
Derivatives positioning, liquidation data, and long-term chart structure now point in the same bullish direction. However, one missing ingredient still keeps the breakout unconfirmed.
Futures Traders Return as Open Interest Nears $20 Billion
Glassnode data shows Ethereum futures open interest across all exchanges spiked to $19.8 billion on July 14. That is the highest reading since June 3, when a market-wide deleveraging event reset positioning.
Open interest measures the total value of outstanding futures contracts. Rising open interest alongside a rising price suggests new capital is entering the market rather than shorts simply covering.
The metric had collapsed to approximately $15.5 billion in late June. Its sharp recovery indicates traders are returning to ETH derivatives with conviction. Elevated positive funding on Ethereum supports the same reading.
Whale trader Machi Big Brother reportedly opened a $24.3 million ETH long at 25x leverage, with liquidation set at $1,833.
Machi Big Brother has opened a $24,300,000 $ETH long with 25x leverage.
A drop back below the June range would flip this signal and suggest the new positioning was short-lived.
Long Liquidations at a Yearly Low of 4% Point to a Short Squeeze
The composition of recent liquidations strengthens the bullish case. Ethereum futures long liquidations dominance fell to 4%, its lowest level in a year, according to Glassnode.
In plain terms, only 4% of liquidated positions were longs. The remaining 96% were short traders forced out as the price pushed higher.
Still, squeeze-driven rallies carry a caveat. Forced short covering can exaggerate upside moves, as the June 3 liquidations cascaded to exaggerate the downside. Spot demand must follow for the move to hold.
A return of dominance above 50% would indicate that longs are absorbing damage again and would weaken the momentum signal.
Ethereum Price Holds the Trendline From the 2022 Bottom
The weekly chart shows why the current level matters so much. An ascending trendline drawn from the June 2022 bottom, respected throughout the previous bull market, held near $1,600 once again.
The bounce also occurred inside a long-term green demand zone that has served as support four times since early 2023. Moreover, the area coincides with the 0.786 Fibonacci retracement of the entire cycle at $1,754.
This triple confluence of trendline, horizontal support, and Fibonacci level makes the zone a structural line in the sand. The next major resistance sits far above, at the 0.618 Fibonacci retracement of $2,438.
ETH Price Prediction as the $2,000 Test Looms
On the daily chart, Monday’s 6.5% green candle broke above a descending trendline in place since the all-time high. That line had rejected the ETH price five times before this breakout.
The daily Relative Strength Index (RSI) confirms the shift in momentum. It broke out of its own descending trendline, drawn from July 2025, and now sits just below 65.
One warning sign remains. Volume has been declining during the recovery, so the breakout lacks confirmation from participation. Analysts watching the ETH/BTC ratio see early signs of a broader Ethereum comeback that could fill the missing demand.
Immediate resistance lies between $1,900 and $2,000. A confirmed daily close above that zone on rising volume could open the way toward $2,438, nearly 30% above the current price.
On the downside, $1,754 is the critical support. Losing it would expose the trendline near $1,600, and a weekly close below that level would invalidate the bullish structure entirely.
Either volume arrives to validate the breakout, or ETH returns to the zone that has saved it four times already.
Ethereum Research Thread Puts Sybil Resistance Back In Focus For Decentralized Networks is a useful reminder that crypto coverage is not only about token prices. Sometimes the more important story is the infrastructure, regulation, security, or product layer sitting underneath the market noise.
The immediate point is straightforward: an Ethereum Research post examines Sybil risks in the AUCIL framework. That gives readers something concrete to work with, rather than another vague sentiment update.
TL;DR
An Ethereum Research post examines Sybil risks in the AUCIL framework.
The discussion focuses on how duplicate identities can distort decentralized systems.
It adds to the broader security debate around validator and node-level trust.
Why This Matters Now
The timing matters because Ethereum is already part of a wider conversation across the market. Traders want to know whether the development changes liquidity or risk. Builders want to know whether it changes what can be deployed. Compliance teams want to know whether it changes how platforms operate.
In that sense, the story is bigger than one headline. It sits inside the ongoing shift from speculative crypto cycles toward more practical questions: who can use these systems, how safe are they, and whether the underlying incentives actually work.
The best way to read it is with discipline. It is not a guarantee of immediate upside, and it should not be treated as one. But it does add a fresh data point to the way the market is thinking about Ethereum.
The Ethereum Angle
For Ethereum, the important part is the specific mechanism. If this is a security issue, the risk sits in dependencies and user protection. If it is a listing or product launch, the question is access and liquidity. If it is a governance or research proposal, the question is whether the idea can survive implementation.
That is where this update becomes useful. It is not just a label attached to a trend. It gives readers a way to understand what might actually change if the development gains traction.
Crypto has a habit of turning every announcement into a broad market claim. This one deserves a narrower read. The value is in seeing how it affects the users, developers, institutions, or traders closest to the issue.
The Risk Side
There is also a caution attached. Source material can confirm that a development exists, but it cannot prove that adoption will follow. A proposal still needs support. A product still needs users. A chart still needs confirmation. A compliance tool still needs integration.
That is why the responsible reading is not to oversell the story. The stronger takeaway is that this adds to a pattern. The crypto market is steadily becoming more professional, more technical, and more sensitive to real operational details.
Readers should also watch for follow-up signals. That could mean developer feedback, exchange support, regulatory response, wallet adoption, liquidity data, or simply whether market participants continue reacting after the first headline fades.
What Comes Next
The next stage will decide whether this remains a narrow update or becomes part of a larger market theme. In crypto, that difference matters. Plenty of stories look important for a few hours and then disappear. The ones that last usually show up again through usage, liquidity, enforcement, governance, or developer adoption.
For now, this gives the market another piece of information to weigh. It is specific enough to be useful, but still early enough that readers should keep the caveats in view.
That makes it worth covering without pretending it settles anything. The story is a signal, not a final verdict.
The key is not to confuse coverage with certainty. Ethereum stories can move quickly, especially when they touch security, regulation, listings, infrastructure, or price levels. The useful approach is to track the next confirming detail rather than assume the first update carries the whole market story. That is how traders avoid chasing noise and how readers separate a genuine development from another passing headline.
This report is based on information from ethresear.ch.
This article was written by the News Desk and edited by Samuel Rae.
NFT Skill Registry Proposal Gives ERC-721s A More Active Role In On-Chain Automation is a useful reminder that crypto coverage is not only about token prices. Sometimes the more important story is the infrastructure, regulation, security, or product layer sitting underneath the market noise.
The immediate point is straightforward: an Ethereum Magicians proposal explores executable skills bound to ERC-721 identities. That gives readers something concrete to work with, rather than another vague sentiment update.
TL;DR
An Ethereum Magicians proposal explores executable skills bound to ERC-721 identities.
The idea links ownership with specific on-chain actions or abilities.
It could expand how NFTs are used inside automation and agent systems.
Why This Matters Now
The timing matters because Ethereum is already part of a wider conversation across the market. Traders want to know whether the development changes liquidity or risk. Builders want to know whether it changes what can be deployed. Compliance teams want to know whether it changes how platforms operate.
In that sense, the story is bigger than one headline. It sits inside the ongoing shift from speculative crypto cycles toward more practical questions: who can use these systems, how safe are they, and whether the underlying incentives actually work.
The best way to read it is with discipline. It is not a guarantee of immediate upside, and it should not be treated as one. But it does add a fresh data point to the way the market is thinking about Ethereum.
The Ethereum Angle
For Ethereum, the important part is the specific mechanism. If this is a security issue, the risk sits in dependencies and user protection. If it is a listing or product launch, the question is access and liquidity. If it is a governance or research proposal, the question is whether the idea can survive implementation.
That is where this update becomes useful. It is not just a label attached to a trend. It gives readers a way to understand what might actually change if the development gains traction.
Crypto has a habit of turning every announcement into a broad market claim. This one deserves a narrower read. The value is in seeing how it affects the users, developers, institutions, or traders closest to the issue.
The Risk Side
There is also a caution attached. Source material can confirm that a development exists, but it cannot prove that adoption will follow. A proposal still needs support. A product still needs users. A chart still needs confirmation. A compliance tool still needs integration.
That is why the responsible reading is not to oversell the story. The stronger takeaway is that this adds to a pattern. The crypto market is steadily becoming more professional, more technical, and more sensitive to real operational details.
Readers should also watch for follow-up signals. That could mean developer feedback, exchange support, regulatory response, wallet adoption, liquidity data, or simply whether market participants continue reacting after the first headline fades.
What Comes Next
The next stage will decide whether this remains a narrow update or becomes part of a larger market theme. In crypto, that difference matters. Plenty of stories look important for a few hours and then disappear. The ones that last usually show up again through usage, liquidity, enforcement, governance, or developer adoption.
For now, this gives the market another piece of information to weigh. It is specific enough to be useful, but still early enough that readers should keep the caveats in view.
That makes it worth covering without pretending it settles anything. The story is a signal, not a final verdict.
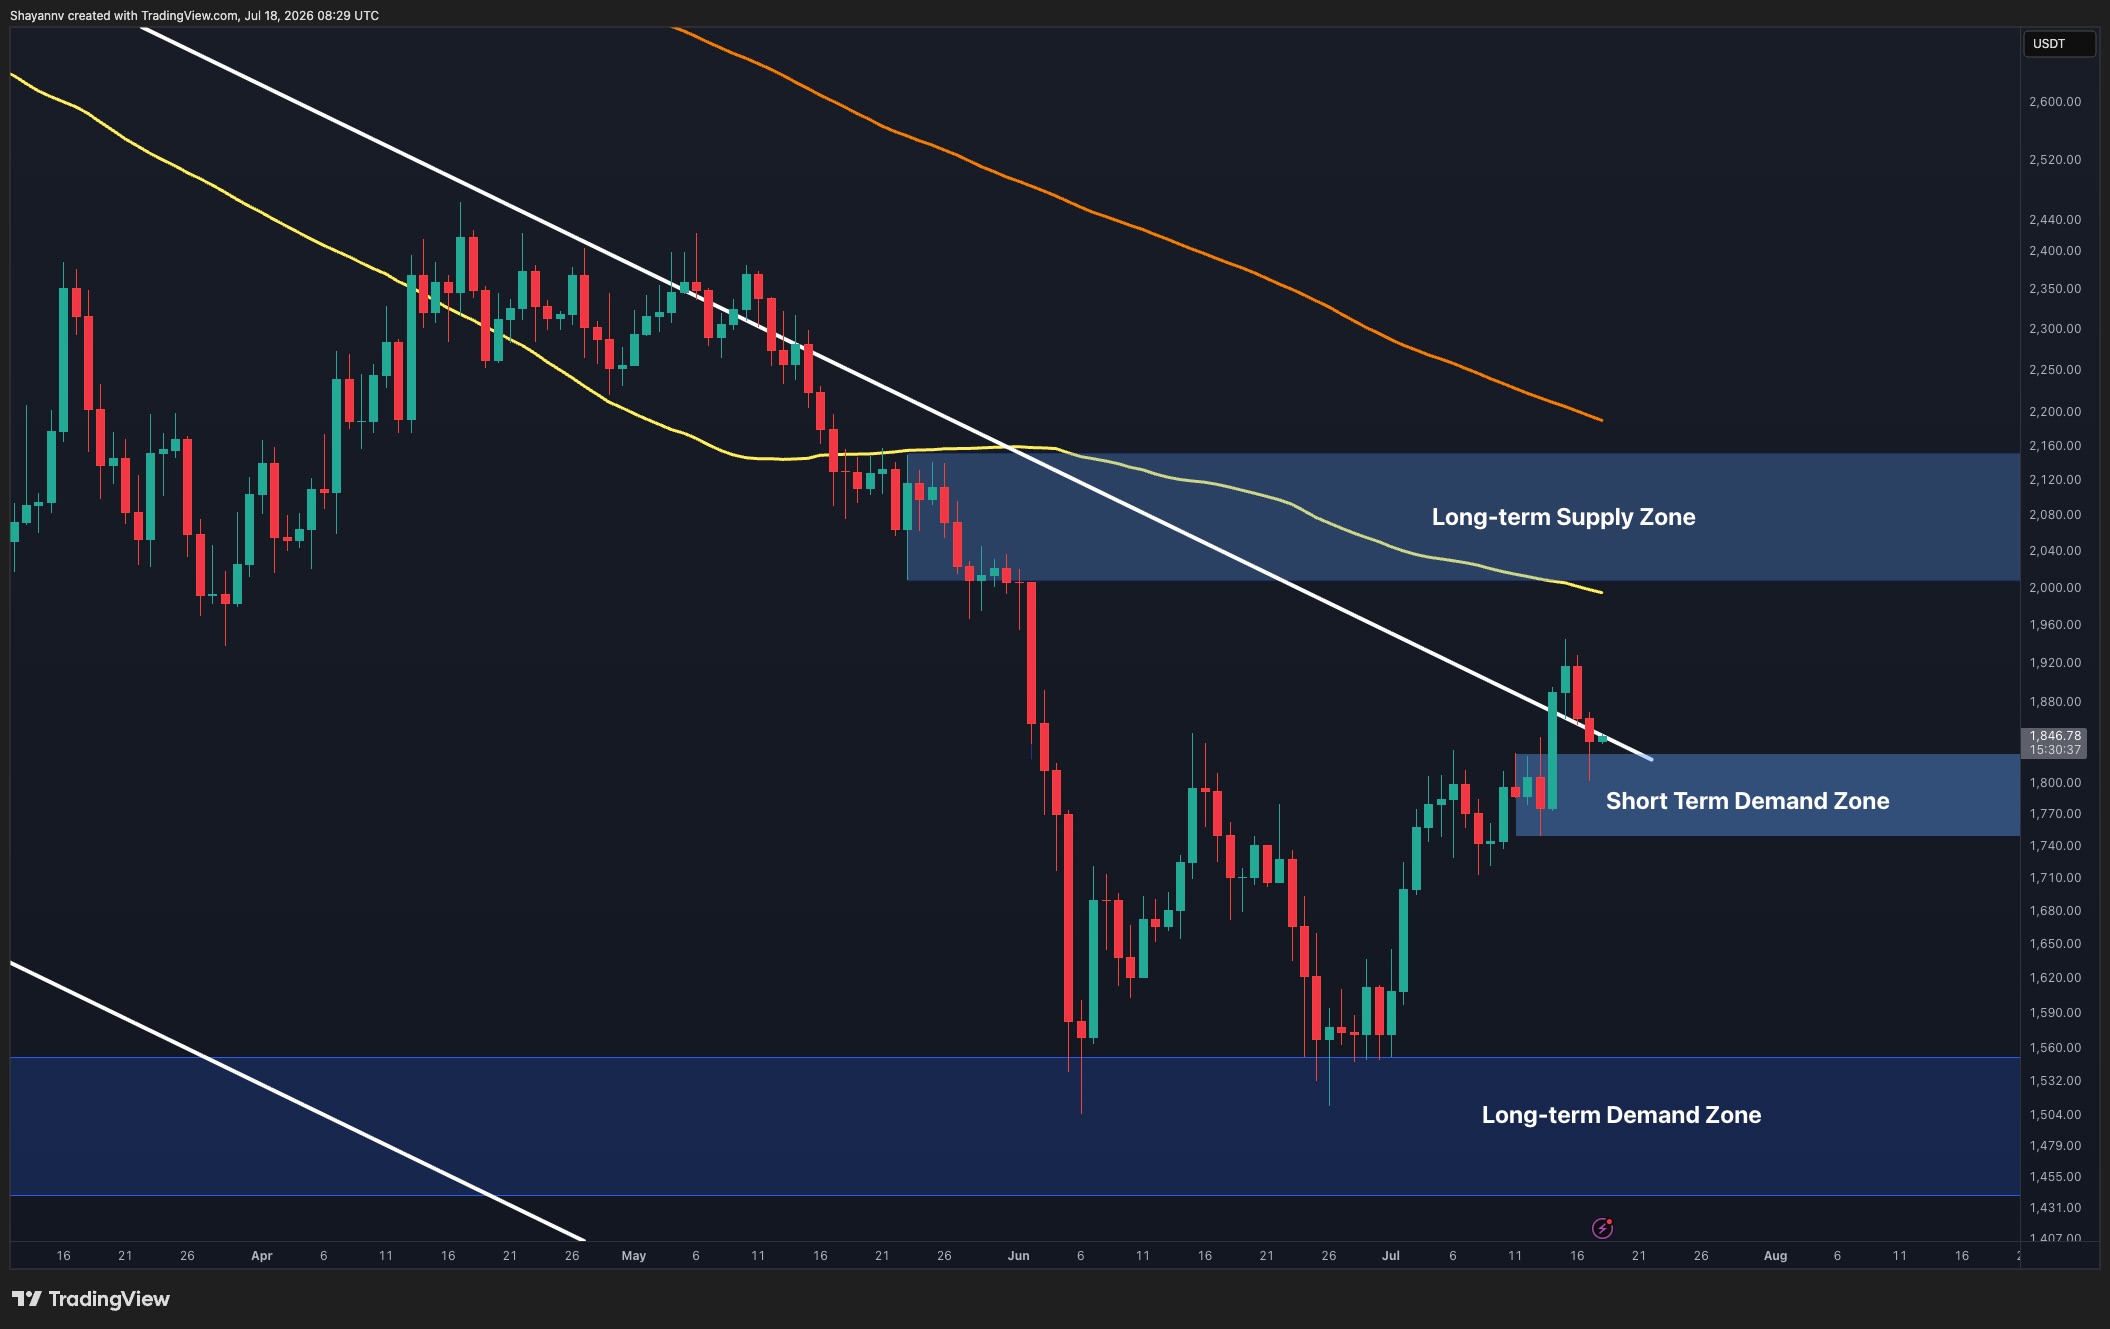
Ethereum has continued its recovery from the June lows and is now approaching a major technical inflection point. While the recent rally has improved short-term sentiment, the asset is still trading beneath a confluence of long-term resistance levels.
Interestingly, the liquidation landscape aligns closely with these technical barriers, suggesting that ETH could first target overhead liquidity before the market decides whether a larger trend reversal is underway or another corrective leg lower remains ahead.
Ethereum Price Analysis: The Daily Chart
On the daily timeframe, ETH remains within a broader descending structure in place since the beginning of the year. It has recovered strongly from the major demand zone around $1.45K-$1.55K and is currently testing the key resistance region around $1.80K-$1.85K.
This area is particularly significant because it coincides with the descending trendline that has capped price action since May. The level also represents a major horizontal resistance that previously acted as support before the June breakdown.
Despite the recent strength, ETH remains below the 100-day and 200-day moving averages, both of which continue to trend lower. The 100-day MA is positioned around the $2K-$2.1K resistance zone, while the 200-day MA remains considerably higher near $2.2K, reinforcing the broader bearish market structure.
As long as ETH remains below the descending trendline and the $1.80K-$1.85K resistance zone, the current move can still be viewed as a recovery rally within a larger downtrend. A decisive breakout above this area would shift focus toward the next major resistance at $2K-$2.1K.
ETH/USDT 4-Hour Chart
The 4-hour chart highlights a clear ascending structure that has developed since the late-June low. Price has respected the rising channel boundaries while forming higher highs and higher lows, reflecting improving short-term momentum.
The market has already reclaimed the $1.62K-$1.64K demand zone and subsequently established another support area around $1.72K-$1.74K. These zones have repeatedly attracted buyers during pullbacks and continue to define the short-term bullish structure.
However, the rally is now approaching the upper boundary of the channel and the major resistance band around $1.83K-$1.85K. This creates a natural area where profit-taking and seller activity could emerge.
From a structural perspective, ETH remains constructive above the $1.72K-$1.74K support region. Losing this level would be the first sign that bullish momentum is fading and could expose the lower channel boundary and the broader support zone around $1.55K.
Sentiment Analysis
The Binance ETH/USDT liquidation heatmap provides an important clue regarding the next likely move.
The most significant concentration of short-side liquidity sits above the current market price, particularly within the $1.95K-$2.1K region. This cluster aligns remarkably well with the daily chart resistance zone, the 100-day moving average, and the broader supply area visible on the higher timeframe.
Meanwhile, substantial liquidity pools remain below the market around the $1.45K-$1.55K region, which corresponds closely with the major daily demand zone that has supported ETH throughout the recent recovery.
The alignment between the liquidation map and the technical structure suggests that the market may first be drawn toward the overhead liquidity cluster. A move into the $2K-$2.1K area would effectively sweep a large concentration of short liquidations while simultaneously testing one of the most important resistance zones on the chart.
The reaction at that region will likely determine the next major directional move. If buyers manage to reclaim the $2K-$2.1K resistance area and establish acceptance above it, the recovery could evolve into a broader bullish trend reversal. However, if the liquidity sweep is followed by strong selling pressure and rejection from resistance, ETH could enter another notable decline, potentially targeting the large liquidity pools resting beneath the market around the $1.45K-$1.55K support zone.
SPX6900 may reach $0.5078 by the end of 2026, according to the forecast.
By 2028, SPX could peak at $0.7917, with an average price near $0.7006.
SPX6900’s long-term outlook places its 2032 target between $1.44 and $1.87.
SPX6900 (SPX) operates mainly on the Ethereum network and was initially created as an entertainment-focused meme token. The project has no direct connection to stocks, equities, or securities, with its value largely influenced by community engagement, social media activity, and market speculation.
The token attracts traders through spot markets, speculative activity, and perpetual contracts on centralized and decentralized exchanges. However, leveraged trading carries significant risks due to meme coins’ high volatility and is generally unsuitable for inexperienced traders. SPX can be stored through wallets such as Trust Wallet, Bitget Wallet, and hardware wallets including Ledger Nano S Plus.
SPX6900 is traded across multiple platforms, with Bybit among the leading exchanges by trading volume for the token. The meme coin currently has a circulating supply of 930.99 million SPX, matching its total supply, while its maximum supply is capped at 1 billion tokens.
Although launched as a non-serious meme project, SPX6900 gained attention after becoming one of the notable-performing meme tokens in 2024. The token recorded a sharp rally of nearly 9,000% within a month, attracting continued interest from traders as the market looks ahead to SPX6900’s price outlook for 2026 and beyond.
Overview
Cryptocurrency
SPX6900
Token
SPX
Price
$0.3690
Market Cap
$347.98M
Trading Volume (24-hour)
$7.94M
Circulating Supply
930.99M SPX
All-time High
$2.28 (July 28, 2025)
All-time Low
$0.000002634 (August 16, 2023)
24-hour High
$0.3933
24-hour Low
$0.3674
SPX6900 price prediction: Technical analysis
Metric
Value
Price Prediction
$ 0.2781 (-25.13%)
Price Volatility
9.40% (High)
50-Day SMA
$ 0.3479
200-Day SMA
$ 0.3715
Market Sentiment
Bearish
Fear & Greed Index
20 (Extreme Fear)
Green Days
15/30 (50%)
14-Day RSI
59.65 (Neutral)
SPX6900 price analysis
SPX6900 trades under pressure as sellers dominate after the token fails to sustain its recent recovery attempt.
The price remains between key support and resistance zones, with buyers watching the daily low for potential stabilization.
Short-term momentum weakens on the 4-hour chart as SPX struggles to regain its previous upward trend.
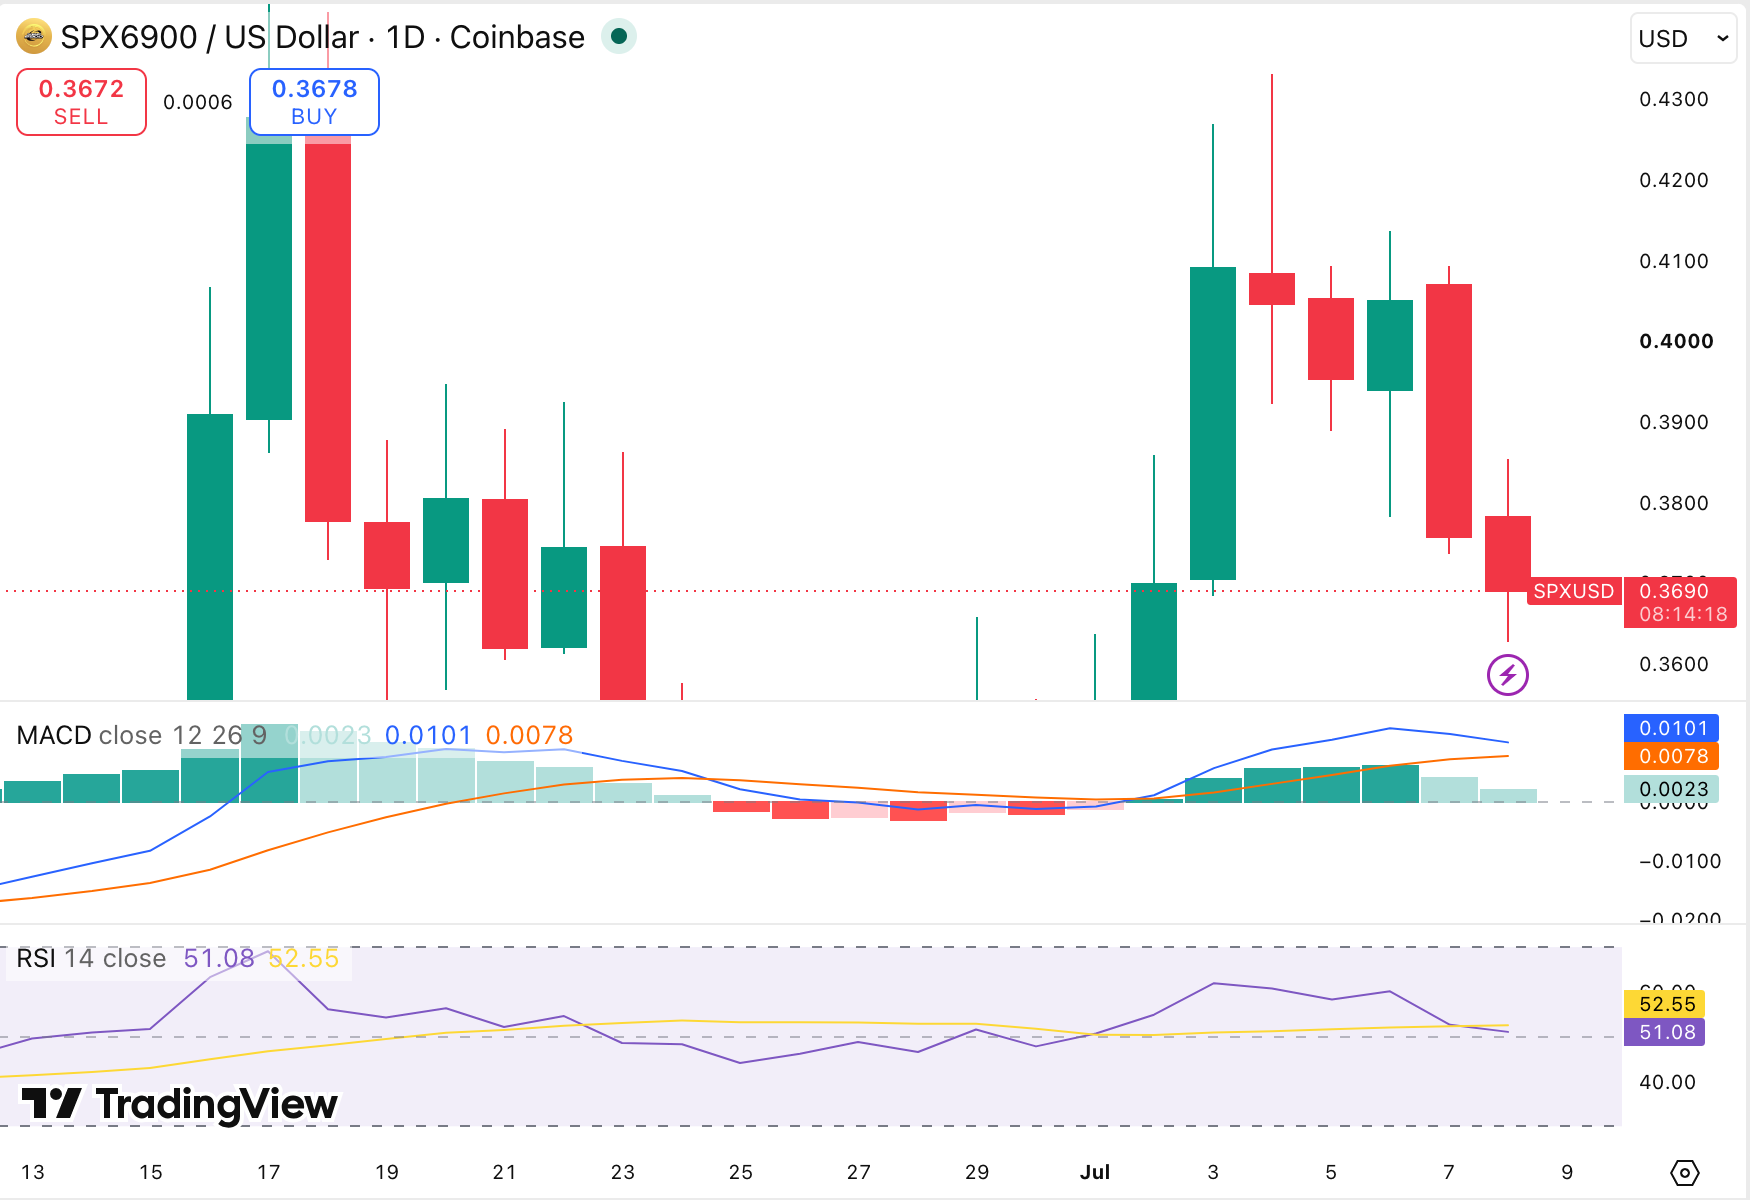
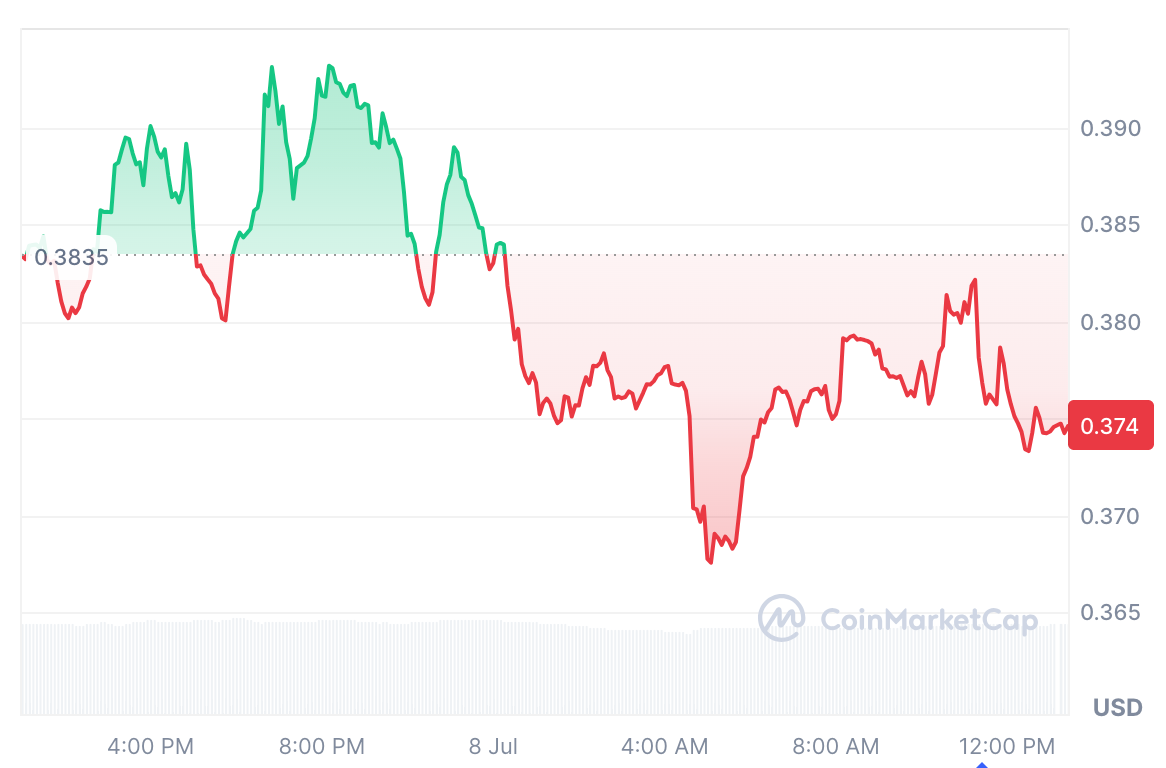
On July 8, 2026, the price of SPX6900 (SPX) is trading at $0.3690, marking a 1.76% decline in the last 24 hours. The most significant support level is at $0.3674, while the immediate resistance is at $0.3933.
SPX6900/USD analysis on the 24-hour timeframe
The daily chart shows SPX6900 starting with early buying strength before sellers regain control near the upper trading range. The token fails to maintain its upward momentum, creating a lower-high pattern as price gradually moves toward the lower end of the session range.
The price of SPX6900 (SPX) is currently trading at $0.3690 on the daily chart, where sellers are starting to gain the upper hand following a recent bounce in the token. RSI 14 is at 51.08, which is a neutral market state with a balance between buyers and sellers.
The MACD is still positive as the MACD line is 0.0101 above the signal line and the histogram is declining, indicating weakening bull market momentum. If SPX is to turn up the heat and get some upward momentum, it may require more buying pressure in the short-term.
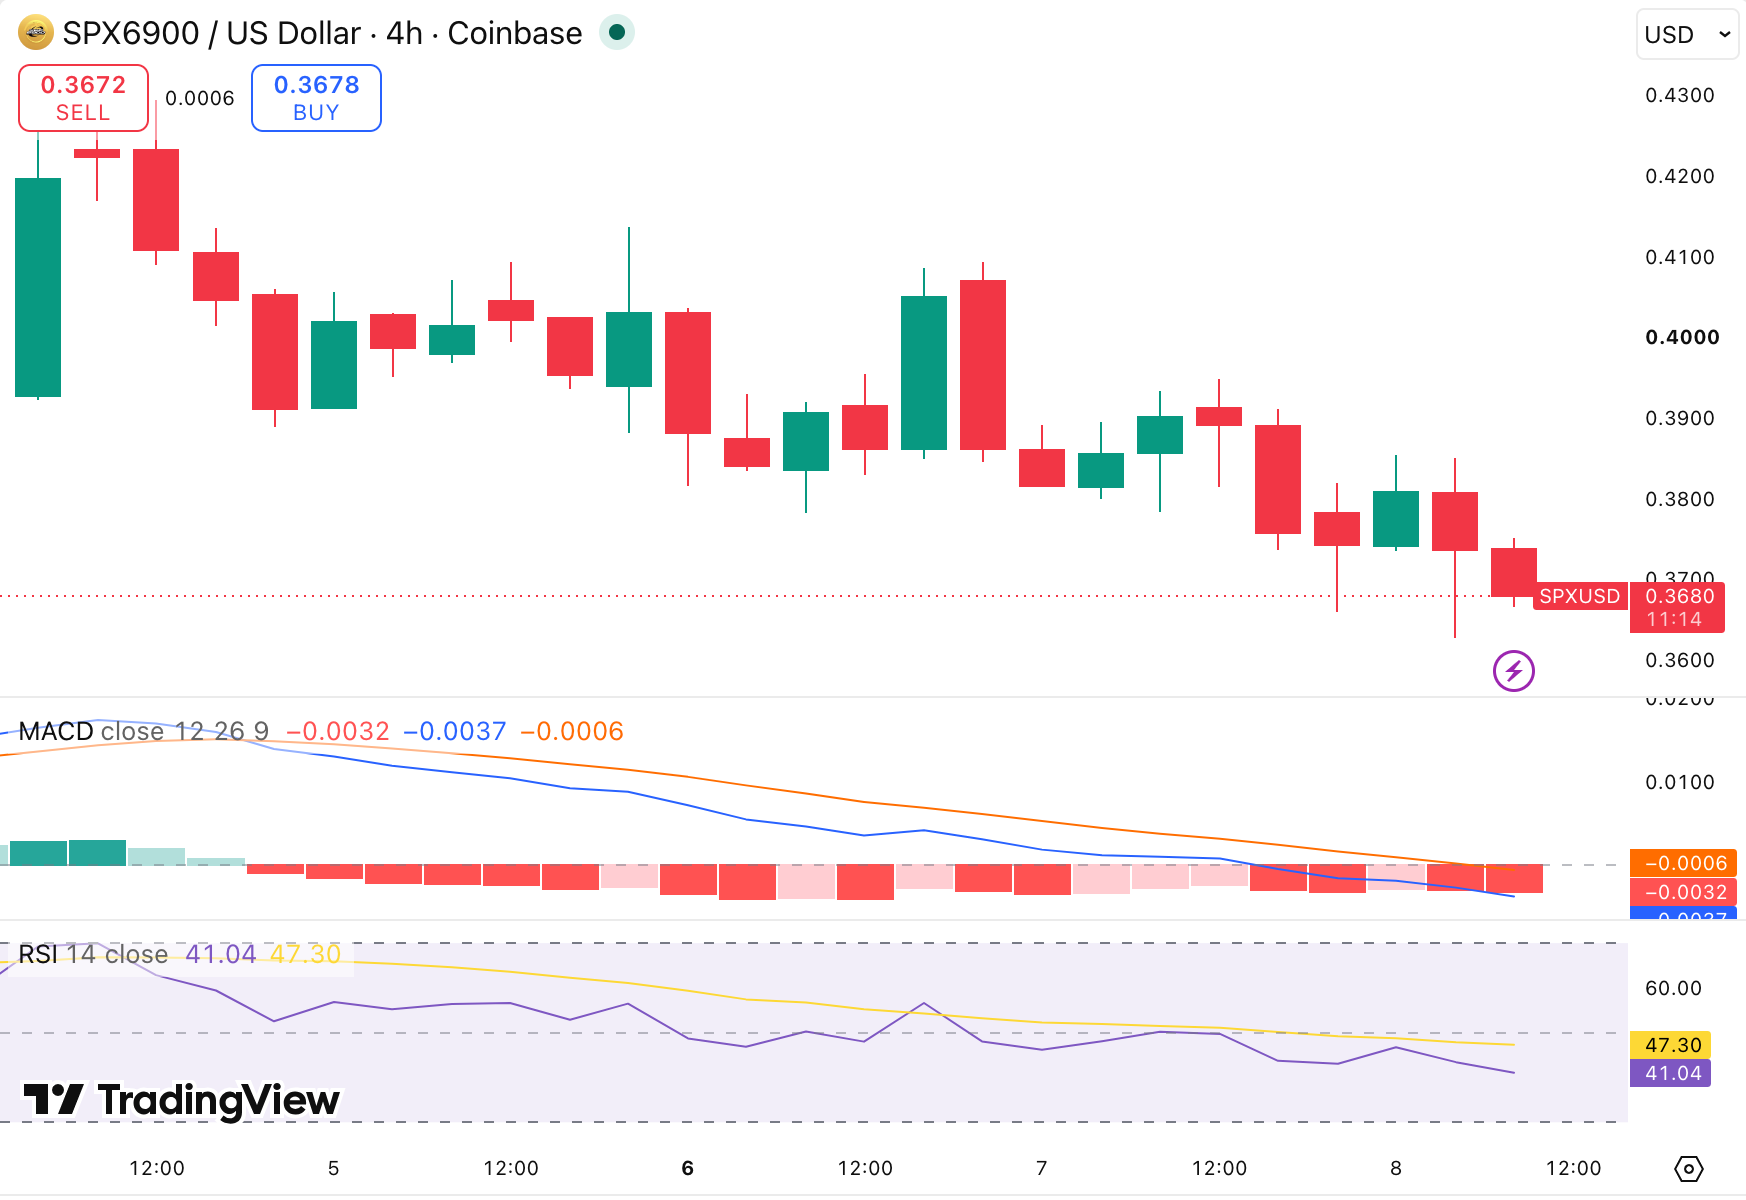
SPX6900 analysis on the 4-hour chart
The 4-hour structure suggests sellers still have the upper hand as the SPX6900 breaks out of the previous recovery zone. The token has to gain buying momentum in order to make a comeback and make it better in the short term.
On the 4-hour chart, SPX6900 (SPX) is still under selling pressure, as the token has fallen below its previous recovery levels. RSI 14 levels have fallen to 41.04, which is below the oversold level but still not strong momentum, implying that sellers still dominate and buyers are trying to level the market.
The MACD indicator continues to be bearish, with the MACD line remaining below the signal line, indicating a downward trend. Red bars are the current trend of waning purchasing power, and unless it turns around, SPX could continue to move lower.
SPX6900 technical indicators: Levels and action
Daily simple moving average (SMA)
Period
Value
Action
SMA 3
$ 0.4011
SELL
SMA 5
$ 0.3968
SELL
SMA 10
$ 0.3705
BUY
SMA 21
$ 0.3673
BUY
SMA 50
$ 0.3479
BUY
SMA 100
$ 0.3514
BUY
SMA 200
$ 0.3715
BUY
Daily exponential moving average (EMA)
Period
Value
Action
EMA 3
$ 0.3988
SELL
EMA 5
$ 0.3924
SELL
EMA 10
$ 0.3792
SELL
EMA 21
$ 0.3659
BUY
EMA 50
$ 0.3576
BUY
EMA 100
$ 0.3638
BUY
EMA 200
$ 0.4570
SELL
What to expect from SPX6900 price analysis?
SPX6900 is still trying to work out if buyers are able to hold the current support zone following the recent breakdown. If the token recovers well, it may test higher resistance levels, and if the selling pressure continues, SPX will be heading towards lower price levels.
The near-term picture will rely on whether buyers gain control and bring about a reversal in the positive trend. If SPX maintains its price range, then the token might try to rally again, but without finding new buying interest, it could continue to be under pressure for the short term.
Why is SPX down?
SPX6900 is trending down because those who are selling take over control while the token is unable to sustain its recent recovery rally. The price is under selling pressure as buyers are unable to hold onto higher price levels, causing a reversal down to the lower end of the trading range.
The weakness also indicates lower short-term demand, as traders remain more conservative as a result of the slow momentum in the market. Once the first bounce off the wall fades, SPX begins to consolidate and puts buyers to the test to avoid additional bear market pressure.
Is SPX6900 a good investment?
SPX6900’s future value could benefit from its limited supply and growing market interest, as scarcity can influence demand over time. However, price movements remain uncertain and depend on market conditions, investor sentiment, and broader crypto trends.
Investors should consider the risks associated with volatile assets and conduct thorough research before making investment decisions. Only allocate funds that match individual risk tolerance and financial circumstances.
Will SPX reach $5?
SPX6900 would require a substantial increase in both price and market capitalization to reach the $5 level. While achieving this target is challenging, it remains possible if the token experiences strong adoption and market growth. Current projections suggest SPX could approach this range after 2032, supported by a significantly higher market valuation.
Will SPX6900 reach $10?
SPX6900 is not expected to reach the $10 price level based on current prediction models. According to the forecast algorithm, the token’s highest projected value could reach approximately $8.06 by 2046, suggesting a long-term growth trajectory that falls below the $10 milestone.
Does SPX6900 have a good long-term future?
Long-term forecasts suggest a gradual increase in SPX6900’s value, with projections indicating stronger upward momentum toward 2029. By 2032, SPX is expected to trade above $1.3, with a projected fully diluted valuation (FDV) of around $427.33 million.
SPX6900’s growth is primarily driven by community support, meme culture, and market speculation rather than traditional utility. The token is a satirical project that uses phrases like “scientific utilization” to parody finance and crypto concepts, while its S&P 500 references highlight its humorous approach to market valuation.
SPX6900 price prediction July 2026
SPX is projected to trade within a range this month, with a potential high of $0.3980, an average price of $0.3720, and a minimum trading level of $0.3590.
SPX6900 price prediction
Minimum price
Average price
maximum price
SPX6900 price prediction July 2026
$0.3590
$0.3720
$0.3980
SPX6900 price prediction 2026
SPX6900 is expected to reach a minimum price of $0.4690 in 2026 based on price projections and technical analysis. The SPX price could rise to a maximum of $0.5078, with an average trading price of around $0.4760.
SPX6900 price prediction
Minimum price
Average price
maximum price
SPX6900 price prediction 2026
$0.4690
$0.4760
$0.5078
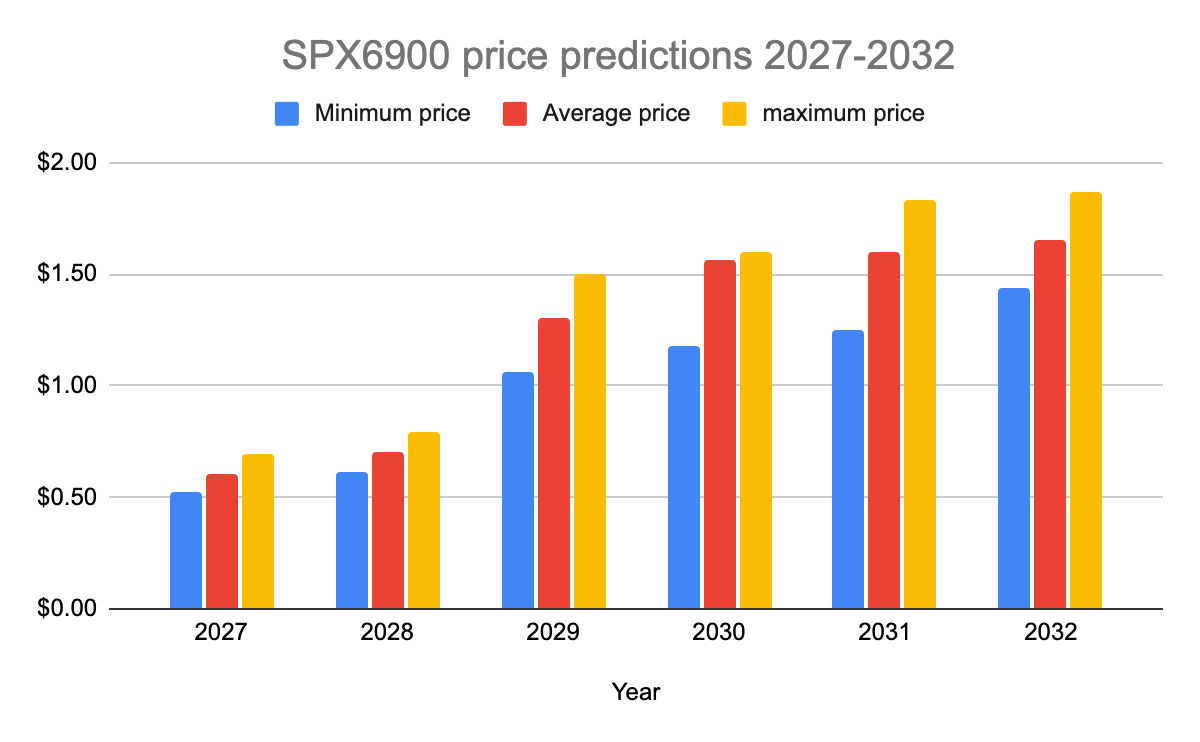
SPX6900 price predictions 2027-2032
Year
Minimum price
Average price
maximum price
2027
$0.522
$0.6069
$0.6919
2028
$0.6095
$0.7006
$0.7917
2029
$1.06
$1.30
$1.50
2030
$1.18
$1.56
$1.60
2031
$1.25
$1.60
$1.83
2032
$1.44
$1.65
$1.87
SPX6900 price prediction 2027
SPX6900 is expected to trade at a minimum price of $0.522 in 2027, with a maximum projected value of $0.6919 and an average trading price of $0.6069.
SPX6900 price prediction 2028
SPX6900 is projected to reach a minimum price of $0.6095 in 2028, with a potential maximum price of $0.7917 and an average trading price of around $0.7006 throughout the year.
SPX6900 price prediction 2029
SPX6900 is projected to trade at a minimum value of $1.06 in 2029, with the potential to reach a maximum price of $1.50. The average trading price during the year is estimated at around $1.30.
SPX6900 price prediction 2030
SPX6900 is projected to reach a minimum price of $1.18 in 2030, with the potential to climb to a maximum value of $1.60 and an average trading price of $1.56 throughout the year.
SPX6900 price prediction 2031
SPX6900 is expected to reach a minimum price of $1.25 in 2031, with a potential maximum value of $1.83 and an average trading price of around $1.60 throughout the year.
SPX6900 price prediction 2032
SPX6900 is projected to reach a minimum price of $1.44 in 2032, with a potential maximum level of $1.87 and an average trading price of around $1.65 based on technical analysis of historical price data.
SPX is projected to reach a high of $0.5078 by the end of 2026. In 2027, the token could trade between $0.522 and $0.6919, while the 2032 outlook places SPX within a range of $1.44 to $1.87, with an average price of $1.65. These estimates may change based on market conditions, and investors should conduct their own research and due diligence before making decisions in the volatile crypto market.
SPX6900 was launched in August 2023 by its primary creators with an opening price of $0.003 but remained under the radar for over a year.
In October 2023, SPX’s value spiked to $0.023 under bullish control, which was a considerable growth trajectory, but it still remained far from market attention.
December of 2023 saw a low price of $0.008, which was quite low compared to the price in October, as per crypto market historical data.
SPX6900 saw a stagnating price movement from January to May 2024, only to rise periodically to $0.015.
In September 2024, SPX6900 gained an enormous 5600% from September 12 to October 14, reaching $0.913, resulting in a massive market capitalization.
The token made higher spikes till November 7, 2024, adding significantly to its market cap; however, the token’s price has deteriorated afterwards.
On November 21, SPX6900 stooped to $0.450, losing 50% of its value, which made holders cautious. However, the token regained its lost value and ended the year at $0.856.
The meme token entered January 2025 with a price tag of $0.866, but it soon jumped to $1.55 as its circulation and acceptance increased.
It corrected strongly in search of support at the start of February, attaining an average price of $0.66, but came down to the 0.46 range in March.
In April, the coin was trading near $0.386 on the lower side, while in May, it saw a fabulous recovery, peaking at $1.11 along with some other cryptocurrencies.
On June 11, the meme coin attained its all-time high of $1.73, and on July 28, it marked another ATH at $2.27.
SPX maintained a trading range of $1.06 to $2 in August under complete bullish dominance, proving itself a reliable asset, and was trading at an average price of $1.16 in September.
In October 2025, SPX6900 was trading near $1.6, and in November, it fell to $0.78 after losing 50% of its value. In December, the downtrend continued as the token touched $0.63.
At the start of January 2026, SPX6900 was trading near $0.648, but in March, it slipped to $0.336.
In April, SPX6900 was trading near $0.28, and in May it increased to $0.42, but it decreased to $0.316 again in June, as the current market sentiment turned bearish to neutral.
According to the latest data, SPX is trading near $0.3770 as July begins, reflecting its current market position at the start of the month.
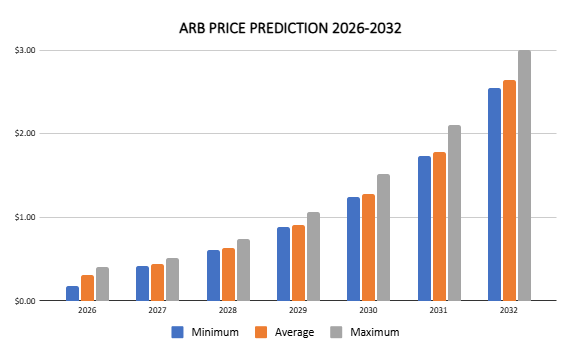
Our ARB predictions anticipate a high of $0.31 in 2026.
In 2028, the range is expected to be between $0.61 and $0.74, with an average price of $0.63.
In 2030, it will range between $1.24 and $1.52, with an average price of $1.28.
Arbitrum price prediction points to a modest near-term outlook and a stronger long-term move: our ARB forecast sees a high of $0.31 in 2026, with the token potentially reaching between $1.24 and $1.52 by 2030 and averaging $1.28, which suggests it could reclaim and move past $1 by the end of the decade.
Layer 2s have generated considerable buzz for their efficiency, and the Arbitrum network is in the top 5 pack, with a total value locked (TVL) of $1.24 billion. Arbitrum is an Optimistic Rollup solution that shifts network operations away from the Ethereum mainnet while maintaining Ethereum-level security.
For crypto investors, traders, and enthusiasts weighing ARB’s upside, this analysis examines Arbitrum’s current price action, technical indicators, market trends, competition, historical sentiment, and the key factors shaping its forecasts from 2026 to 2032. Is Arbitrum a good investment? Will it go up? Where will it be in 5 years? Let’s answer those questions with a data-driven Arbitrum price prediction to help you make more informed decisions in a volatile market.
Overview
Cryptocurrency
Arbitrum
Current Arbitrum price
$0.07930
Market cap
$504.43M
Trading volume
$42.92M
Circulating supply
6.36B
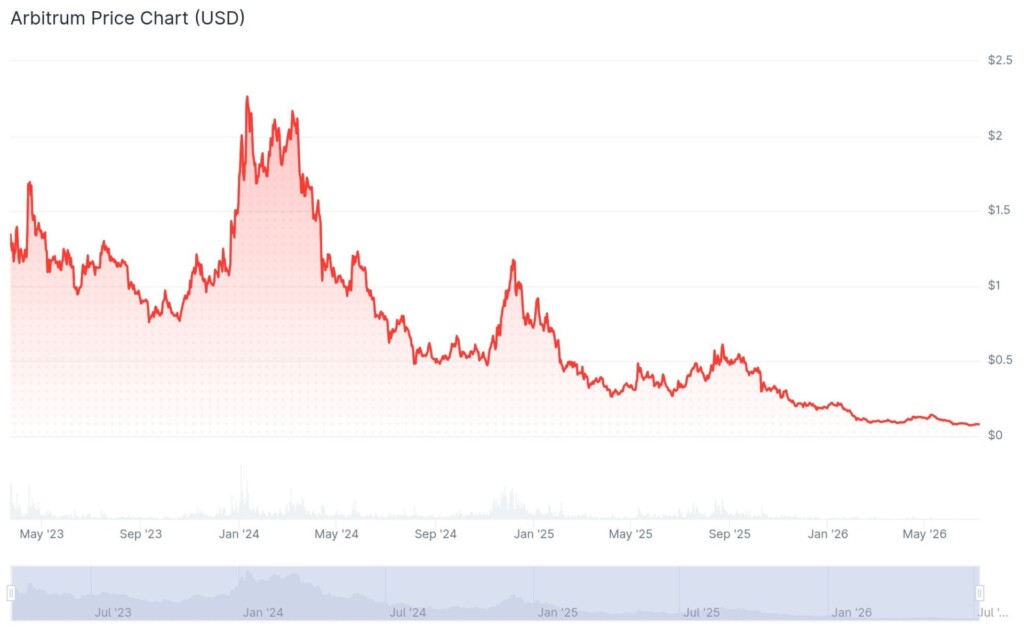
All-time high
$2.40 on Jan 12, 2024
All-time low
$0.07067 on Jun 26, 2026
24-hour high
$0.08141
24-hour low
$0.07757
Arbitrum price prediction: Technical analysis
Metric
Value
Volatility (30-day variation)
4.99% (Medium)
50-day SMA
$0.08892
200-day SMA
$0.1233
Sentiment
Bearish
Green days
15/30 (50%)
Fear and Greed Index
27 (Fear)
Arbitrum price analysis
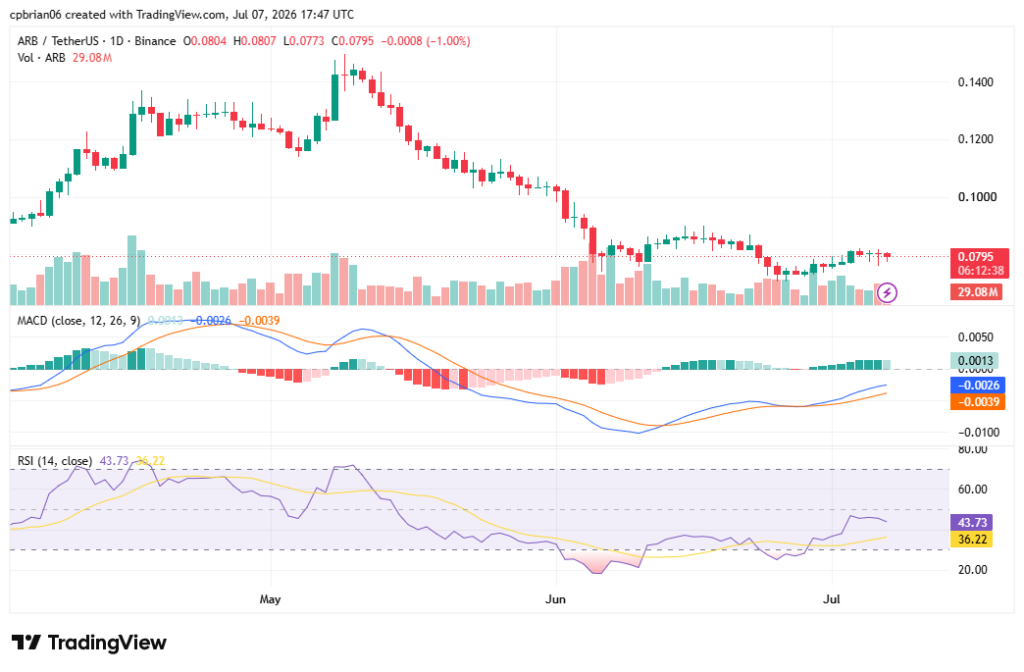
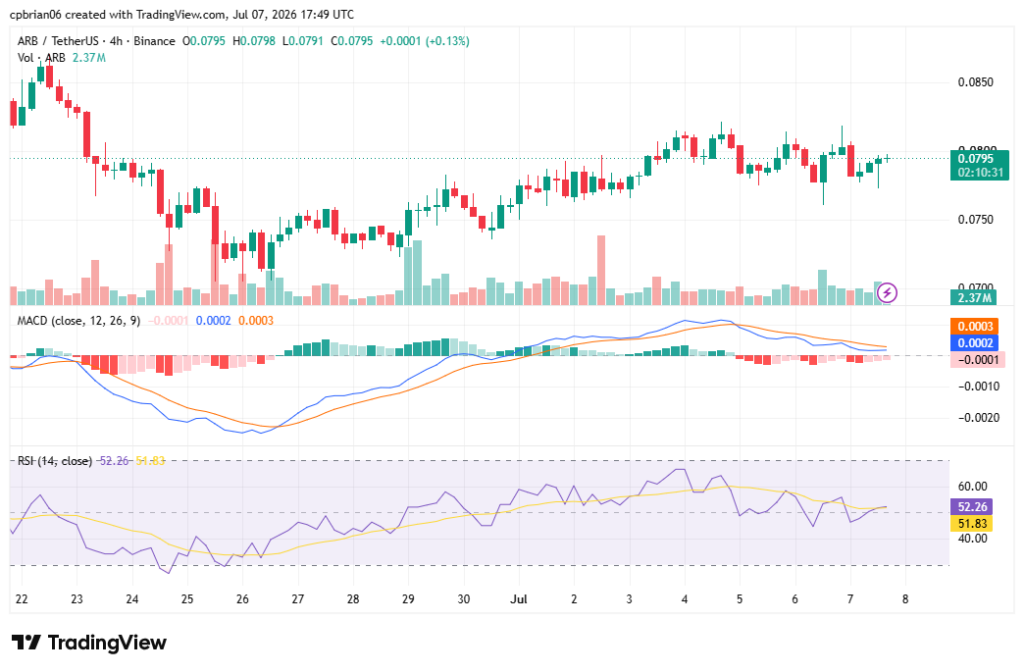
On July 7, Arbitrum’s price fell 0.78% over 24 hours and 3.16% over the last 30 days. The drop reflected recent ARB price action, accompanied by waning trading volume (-15.59%). Broader cryptocurrency markets and ETH prices can shape short-run sentiment, influence Layer 2 activity, and drive ARB price movements as market conditions shift.
ARB has consistently traded lower, reflecting a short-term bearish trend. The drop tracked the broader altcoin rally, driven by capital rotation from the sector — reflected in a declining Altcoin Season Index. ARB now has support at $0.073, and traders watch such low prices as potential support floors for buying interest in the week ahead.
ARB registered a new all-time low (ATL) of $0.071 last month. The chart highlights ARB run following the drop. With its Relative Strength Index at 51,83, it is neutral. Psychological resistance around $0.08 could cap any rebound, though the selected time frame may change how traders interpret that signal, as bearish pressure persists.
Arbitrum technical indicators: Levels and action
Daily simple moving average (SMA)
Period
Value ($)
Action
SMA 3
0.07991
SELL
SMA 5
0.07951
SELL
SMA 10
0.07723
BUY
SMA 21
0.07902
BUY
SMA 50
0.08892
SELL
SMA 100
0.1035
SELL
SMA 200
0.1233
SELL
Daily exponential moving average (EMA)
Period
Value ($)
Action
EMA 3
0.07970
SELL
EMA 5
0.07922
SELL
EMA 10
0.07853
BUY
EMA 21
0.08000
SELL
EMA 50
0.08855
SELL
EMA 100
0.1020
SELL
EMA 200
0.1412
SELL
What to expect from the ARB price analysis next?
Arbitrum is moving downwards on the shorter timeframes, with moving averages still leaning bearish. Analysts use technical indicators to predict near-term price movements over the next week and next month.
Why is Arbitrum down?
ARB’s price remains below major moving averages, confirming the bearish trend structure. The RSI14 at 36.22 in neutral territory. Volume fell, indicating the move lacks conviction but also shows no urgency to buy the dip.
Does Arbitrum have a future?
As a Layer-2 scaling solution for the Ethereum network, Arbitrum uses optimistic rollups to process transactions off-chain and submit proofs back to Ethereum; high adoption is crucial to Arbitrum’s long-term success and sustainability. Arbitrum’s performance in this regard is a positive sign for its future prospects despite price declines. The ARB token is a governance token, and ARB holders use it to govern the Arbitrum DAO through protocol upgrades, treasury management, and ecosystem grants. It is not used to pay transaction fees on the network. As an L2 network, its growth also depends on Ethereum upgrades, rollup-focused development, and the broader ecosystem supporting the base layer. Rising active addresses, transaction volume, and dApp expansion can signal growth across the DeFi ecosystem, where Arbitrum supports over 575 protocols and holds about 45.53% of Layer 2 TVL, while remaining a leading chain among Layer 2s with strong transaction-fee revenue.
Recent news
A scheduled unlock of 14.4M ARB tokens, valued at $1.1 million, is set for July 7. Such events often create anticipatory selling pressure as the market prices in the potential dilution from newly liquid tokens, and further token unlocks later in 2026 add to that overhang.
ARB price prediction July 2026
The Arbitrum price forecast for July is estimated at a range of $0.0750 to $0.1001, and this monthly outlook is one of several short run price predictions investors may track. The average price for the month will be $0.0809.
Month
Potential low ($)
Potential average ($)
Potential high ($)
July
0.0750
0.0809
0.1001
Arbitrum price prediction 2026
For 2026, ARB’s price will range between $0.06 and $0.31. The average price for the period will be $0.21. Other market analysis projects 2026 between $0.08574 and $0.251, with an average of $0.1683.
Year
Potential low ($)
Potential average ($)
Potential high ($)
2026
0.0608
0.2122
0.3109
Arbitrum price prediction 2027-2032
Year
Potential low ($)
Potential average ($)
Potential high ($)
2027
0.4207
0.4364
0.5134
2028
0.6123
0.6341
0.7447
2029
0.8807
0.9124
1.06
2030
1.24
1.28
1.52
2031
1.73
1.78
2.10
2032
2.55
2.64
3.00
Arbitrum price prediction 2027
Arbitrum market price prediction climbs even higher into 2027. Some external forecasts place ARB’s price in a much more bullish $5.00 to $8.00 range across 2027-2028. Some crypto analysts place 2027 in a wider comparative range of $0.157 to $0.446, with an average near $0.3015. According to arbitrum’s price forecast, ARB’s price will range from $0.42 to $0.51, with an average of $0.44.
Arbitrum coin price prediction 2028
Our analysis indicates a further acceleration in ARB’s price. It will trade between $0.61 and $0.74 and an average price of $0.63.
Arbitrum price prediction 2029
According to the 2029 Arbitrum forecast, ARB’s price will range from $0.88 to $1.06, with an average of $0.91.
ARB price prediction 2030
The ARB price prediction for 2030 is $1.24-$1.52, with an average of $1.28. Broader 2030 projections place ARB between $2.46 and $5.78, with an average of $4.12. In a bullish scenario, some forecasts extend toward $12.00, though the long-term impact depends on several factors, including on-chain metrics, market conditions, Layer-2 adoption, Ethereum scaling upgrades, TVL, and competition.
Arbitrum price prediction 2031
The Arbitrum price forecast for 2031 is a high of $2.10. It will reach a minimum price of $1.73 and an average price of $1.78.
Arbitrum ARB price prediction 2032
The year 2032 will also be bullish. Our analysis estimates a price range of $2.55 to $3.00, with an average price of $2.64. A conservative model suggests ARB could be around $0.13 by 2036 and $0.26 by 2051.
This table compares analyst market analysis on the price of Arbitrum across leading platforms and acts as a simple price prediction tool for reviewing outside analyst forecasts.
Cryptopolitan’s arbitrum price forecast indicates that ARB will reach a high of $0.31 in 2026, and whether it looks like a good buy depends on your risk tolerance and timeframe. At its current price below $1, ARB would need a 1000% surge to reach $10. Any path there faces potential short-term constraints from supply growth and market sentiment, so it would likely take several years even in favorable conditions. Since its launch, ARB has peaked at $2.40, so a $10 target at the current price level seems highly implausible. In 2028, the range is expected to be between $0.61 and $0.74, with an average of $0.63. In 2030, the range is likely to be between $1.24 and $1.52, with an average of $1.28. Do your own research and invest at your own risk.
The Arbitrum airdrop snapshot occurred on Feb 6, 2023, and eligible participants, including early users, started claiming ARB tokens on Mar 23, 2023. The claiming period ended on Sep 24, 2023.
The airdrop granted 11.5% of the total supply to eligible users, 1.1% to DAOs operating in the Arbitrum ecosystem, and 44% to employees and Offchain Labs investors. The 44% is subject to lock-up periods and a vesting schedule, while whales control 57.13% of the supply, which can influence price movements when large holders reposition. The rest was sent to the Arbitrum DAO treasury.
ARB is the native token of the network, with a total supply capped at 10 billion, annual inflation of 2%, and 12.75% of the supply initially distributed to eligible users and DAOs.
A significant share of supply remains locked and is released gradually into circulation, potentially creating selling pressure if demand does not keep pace.
On Sep 11, 2023, it fell to its all-time low at $0.7453.
Bitcoin’s halving and the hype around crypto ETFs helped the coin recover from its October slump. By the end of the year, it had risen to $1.4.
The run continued into 2024. On Jan 12, it reached its all-time high at $2.40.
According to CoinMarketCap data, ARB fell below its listing price in June 2024.
On August 5, 2024, it registered a new all-time low of $0.4317
It then recovered in September, reaching a high of $0.67.
The bullish run continued into November, reaching $1.12 in December.
The Arbitrum network includes Arbitrum One for dApps that need stronger security and Arbitrum Nova for high-throughput use cases such as gaming and social apps; for example, this structure lets more security-sensitive DeFi apps stay on One while lighter social activity can run on Nova.
The coin entered 2025 trading at $0.72 before entering a bear run, falling to a low of $0.40 in February.
It recovered later and crossed into October, trading at $0.45. The trend later reversed, and by date 11, it had fallen to $0.136.
In December, it traded at $0.20.
ARB then entered a bear market in 2026, and on Mar 30, 2026, it hit an all-time low of $0.08653.
It later began to recover, and by May it had crossed above $0.12. The trend reversed in June, trading at $0.08. It maintained the level into July.
Competition from other blockchain projects remains a key factor for ARB, and Arbitrum faces competition from Optimism and zkSync, as well as Ethereum L2 rivals such as Base.