Skip to content
MCAP $2.18T ▼-8.45%
BTC $63,889 ▼-6.43%
ETH $1,758 ▼-8.93%
BNB $580.80 ▼-7.93%
XRP $0.930 ▼-8.08%
SOL $70.01 ▼-10.27%
DOGE $0.0575 ▼-11.08%
ADA $0.148 ▼-11.92%
TRX $0.3073 ▼-1.59%
LINK $8.88 ▼-9.89%
AVAX $7.06 ▼-14.32%
HYPE $64.60 ▼-10.15%
DOT $0.704 ▼-13.87%

Crypto Coin Show News Team

About Crypto Coin Show News Team

https://cryptocoinshow.com

The Crypto Coin Show News Team covers digital assets, blockchain infrastructure, markets and policy. Crypto Coin Show has been running for more than 12 years, with 1,500+ interviews with founders, investors and builders.

Posts by Crypto Coin Show:

ouinex-article-thumbnail
DeFi

Ouinex Launches Multi-Asset Exchange Merging Crypto and Traditional Finance Infrastructure

Ouinex Launches Multi-Asset Exchange Combining Crypto and TradFi Infrastructure

Ouinex Launches Multi-Asset Exchange Merging Crypto and Traditional Finance Infrastructure

The Swiss-based platform lets traders use Bitcoin and USDT as collateral to trade stocks, forex, commodities, and indices — with liquidity drawn from TradFi infrastructure rather than crypto perpetuals.

Ouinex, a live and regulated multi-asset exchange, is positioning itself as the first platform to give crypto-native traders direct access to global financial markets — stocks, indices, forex, commodities, and gold — using their existing crypto holdings as collateral, without converting to fiat or opening a separate brokerage account.

The Fragmented Trader Problem

For the past decade, active traders have been forced to maintain parallel accounts across multiple platforms: a crypto exchange for spot and perpetuals, a traditional broker for equities and forex, and increasingly, separate apps for commodities and indices. Every transfer between platforms introduces friction, cost, and delay — particularly damaging during fast-moving market events.

Ouinex CEO Ilies Larbi, who spent 20 years in traditional finance before founding the exchange, identified this fragmentation as the core problem in 2022. “The user journey was super fragmented,” Larbi noted. “At the end of the day, it’s all trading. The question was whether you could build a product that merges the two.”

The result is a platform that handles spot crypto trading alongside derivatives on traditional financial assets — all within the same account, using the same collateral pool.

₿
Crypto Spot
BTC, ETH, altcoins
∞
Crypto Perps
Leveraged perpetuals
📈
Equities
NASDAQ, DAX, Dow
€
Forex
EUR/USD, GBP/JPY+
🛢
Commodities
Oil, gold, and more
◈
Indices
S&P 500, global

Why TradFi Infrastructure Changes the Liquidity Equation

The central technical distinction between Ouinex and competitors entering the multi-asset space is its decision not to build traditional financial products on top of crypto perpetual infrastructure — the approach taken by platforms like Hyperliquid, Binance, and others rolling out stock or commodity perps.

When crypto exchanges offer gold or forex exposure via perpetuals on a central limit order book, they are starting from scratch on the liquidity side. Market makers must be recruited specifically for each instrument, pricing is inefficient in the early stages, and the result is wider spreads and shallower order books compared to the established TradFi equivalents.

Ouinex routes its TradFi instrument trading through existing financial market infrastructure — the same pipes that have underpinned institutional currency and commodities trading for decades. The consequence, according to the company, is measurably better execution for retail traders.

“We’re about seven times cheaper and approximately 100x deeper in liquidity on instruments like Euro Dollar — versus platforms using the crypto perpetual approach. That’s not small. They’re a billion-dollar company. We’re barely a startup.”
Ilies Larbi — CEO and Founder, Ouinex

On the EUR/USD order book specifically, Ouinex claims its top five layers hold approximately $10 million in available liquidity, compared to roughly $500,000 on competing crypto-native platforms offering the same instrument as a perpetual. The spread advantage, the company states, is around seven times in the trader’s favour.

Metric Crypto-Native Perp Approach Ouinex TradFi Infrastructure
EUR/USD liquidity (top 5 layers) ~$500k ~$10M
Spread vs TradFi benchmark ~7x wider At par
Commission on TradFi instruments Variable Zero
Collateral accepted USDT / stablecoins USDT, USDC, BTC+
Max leverage (EUR/USD) Up to 100x Up to 500x

The 500x maximum leverage figure, while striking, applies specifically to low-volatility instruments like major forex pairs. Larbi has been explicit that volatility-adjusted risk on a 500x EUR/USD position is materially lower than a 100x position on a cryptocurrency perpetual, where daily price swings can easily exceed the margin threshold.

Crypto Collateral for Global Markets

A key feature of the Ouinex architecture is the ability to use crypto assets as collateral for TradFi positions without liquidating those holdings into fiat. Currently, traders can deposit USDT and USDC to fund their margin accounts. A forthcoming update will extend this to native crypto assets including Bitcoin.

The practical implication is that a trader holding Bitcoin during a period of low crypto volatility — or wanting to hedge their exposure — can use that same BTC as margin to take a position in oil, forex, or an equity index. The capital does not need to leave the crypto ecosystem at any point, and no traditional bank wires or card deposits are required.

This removes one of the primary structural barriers to crypto traders participating in TradFi markets: the friction of fiat on-ramps, which typically involve delays, fees, and banking system dependencies that crypto-native users are specifically trying to avoid.

$9M+ Raised from community
5,000+ Investor base
0 VC investors
37 Full-time team

Community-Funded, Zero Venture Capital

Ouinex has raised over $9 million from more than 5,000 retail investors — a deliberate strategy to avoid venture capital entirely. The company ran a multi-phase community pre-sale of its $OUIX token, using each round to demonstrate ongoing product delivery before asking investors to commit further capital.

The decision to exclude VCs is structural rather than ideological. Larbi has been direct about the mechanics: VC token allocations often come fully unlocked, creating immediate incentive to liquidate at listing. The result is a predictable pattern of sell pressure that disproportionately affects retail buyers who entered on the back of the project’s hype at launch.

“The crypto industry is mature enough now to understand what VCs do. We’ve seen those wicks. We know how it happens. There was also no need — we had a community ready to believe in the product.”
Ilies Larbi — CEO and Founder, Ouinex

Ouinex applied the same logic to its market maker relationship, opting for a retainer model rather than granting a token allocation. Under the retainer structure, the market maker has no inventory of $OUIX to sell, eliminating one of the most common vectors for token price manipulation in new listings. The exchange itself serves as the primary listing venue, meaning no tokens need to be surrendered to a tier-one exchange as a listing fee.

Regulated in
5+ Jurisdictions EU Compliant Active Licenses Full KYC/AML

The $OUIX Token and Exchange Flywheel

Ouinex is approaching its token generation event (TGE), set for mid-June 2026, with $OUIX priced at $0.1334. The token serves several functions within the exchange ecosystem: reduced trading fees, cash back on derivatives volume credited in USDT every 24 hours, enhanced APY on the platform’s earn offering, and improved allocation access through the Ouinex launchpad.

A buy-and-burn mechanism allocates a percentage of exchange revenue to repurchasing and destroying $OUIX tokens, creating a deflationary supply dynamic that ties token value directly to platform trading volume. Critically, this revenue stream is drawn from every asset class on the platform — crypto, forex, stocks, commodities, and indices — giving $OUIX a broader revenue surface than exchange tokens tied purely to crypto trading.

TGE Price

$0.1334

TGE Date

Mid-June 2026

Already Staked

50%+

Staking Cliff

3 Years

Revenue Sources

Crypto · Forex · Stocks · Commodities · Indices

Mechanism

Buy & Burn

More than 50% of the total token supply is already staked under a three-year cliff — an unusually strong signal of long-term holder conviction ahead of listing. For context, the three-year cliff means the majority of current token holders cannot sell for at least three years from their staking date, structurally constraining near-term sell pressure beyond the typical lock-up periods seen in comparable exchange token launches.

Investors in the community pre-sale fall into two categories: token holders, who participated in the $OUIX pre-sale, and equity shareholders, who took a direct stake in the operating company. The dual structure gives the project both a token-aligned community and a cap table of shareholders with economic interest in the underlying business.

Market Context: Why Now

The timing of Ouinex’s launch aligns with a visible shift in how major crypto exchanges approach traditional financial assets. Binance has introduced stock tokens; HyperLiquid has added an S&P 500 instrument; MexC and BitMEX have made similar moves. The direction of travel is clear — the largest exchanges are converging on multi-asset coverage.

The distinction Ouinex draws is one of infrastructure: building on top of proven TradFi liquidity rails rather than adapting crypto perpetual infrastructure to handle instruments it was not originally designed for. Whether that architectural choice translates into sustained competitive advantage will depend on execution at scale — but the early benchmarks on spreads and order book depth suggest the model is functioning as intended.

High commodity volatility in 2026 — driven by geopolitical events including Iran-related oil market movements — has also provided near-term validation. Ouinex has reported that oil has overtaken EUR/USD as its highest-volume instrument in recent periods, a cross-sell pattern that demonstrates traders are actively using the multi-asset functionality rather than treating it as a secondary feature.

“Bitcoin is consolidating around the 70s. But look at the oil market — amazing opportunities, lots of movement. Volatility means opportunity. The platform exists precisely for that moment.”
Ilies Larbi — CEO and Founder, Ouinex

The platform is live, regulated across five or more jurisdictions, and accepting users globally. US access is available for most features. The team consists of 37 full-time staff, and the company is accepting platform feedback directly — with confirmed rewards for bug reports and feature suggestions submitted via the platform.

Watch
Blockchain Interviews: Ilies Larbi, CEO of Ouinex — Full Interview with Ashton Addison
thg_merck_dpp_thumbnail
Blockchain

The Hashgraph Group and Mercjnk Introduce EU Digital Product Passport on Hedera for Regulated Supply Chains

The Hashgraph Group and Merck Introduce EU Digital Product Passport on Hedera
Press Release

The Hashgraph Group and Merck Introduce EU Digital Product Passport on Hedera for Regulated Supply Chains

Date: 9 June 2026 Location: Zurich, Switzerland Sector: Supply Chain · Blockchain · Compliance

The Hashgraph Group (THG) has announced a strategic collaboration with science and technology company Merck that extends its TrackTrace Digital Product Passport (DPP) platform. Built on the Hedera network and designed to support compliance requirements for the global supply chain industry, the collaboration aims to meet the EU’s incoming product transparency regulations — ensuring product trust, quality, and improved sustainability across physical goods from first mile to last.

A Single Trust System for Physical and Digital Proof

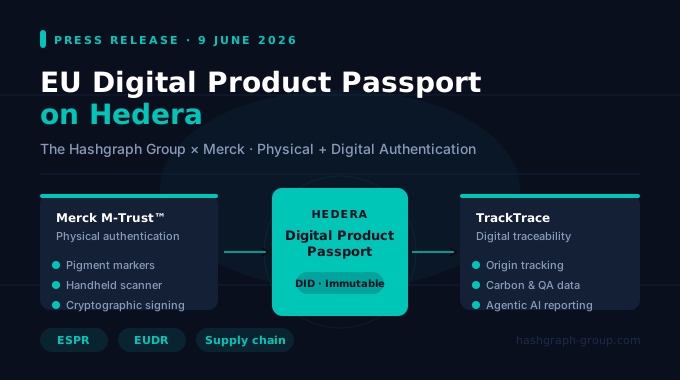
The technical integration brings together THG’s Hedera-powered digital traceability infrastructure with Merck’s M-Trust™ physical authentication technology system. The combined architecture provides the global supply chain ecosystem with a unified proof framework: proof of quality, proof of traceability, proof of authenticity, and proof of value transfer — all anchored to Hedera as a single source of truth.

Where TrackTrace creates tamper-proof digital records of a product’s origin and lifecycle, Merck’s M-Trust™ technology adds the layer digital systems alone cannot deliver: verification that the physical product in your hand is the real thing, not a counterfeit.

Chain of Proof Architecture

Physical Authentication — M-Trust™

Invisible security markers embedded into the product and packaging using Merck’s patented pigment technology. Verified at any point in the supply chain via M-Trust™ handheld scanner.

Cryptographic Signing & On-chain Recording

Each physical verification is cryptographically signed and recorded on the Hedera network, creating a permanent and immutable entry in the product’s Digital Product Passport.

Digital Traceability — TrackTrace

Real-time tracking of origin, ethical sourcing, carbon emissions, and quality assurance data. Every tracked process is issued a decentralised identifier (DID) as a verifiable, immutable record.

Independent Audit & Agentic AI Reporting

Any authorised third party can independently audit a product, process, or claim without relying on a central authority. Integrated Agentic AI automates reporting workflows end to end.

An initial supply chain pilot has already been demonstrated, with a full announcement forthcoming. The combined solution is designed to function across any sector where authenticity, provenance, and regulatory compliance are non-negotiable — from foods and pharmaceuticals to luxury goods and industrial components.

Regulation Is Raising the Bar

New EU rules are tightening what companies must prove about the products they sell. The collaboration between THG and Merck is designed to support the entire supply value chain in meeting these requirements, with traceability and authentication built into the trust system from the ground up.

ESPR — Ecodesign for Sustainable Products Regulation

Requires Digital Product Passports via QR code detailing a product’s origin, composition, sustainability credentials, and full lifecycle. Taking effect from 2026 onwards.

EUDR — EU Deforestation Regulation

Requires importers of commodities including cocoa, coffee, and timber to provide verified, farm-level traceability data — with deforestation-free certification that can be independently audited.

Reliable product traceability also underpins sustainability commitments, ethical sourcing, carbon reporting, and consumer trust. The consequences of weak traceability are already visible: in 2026, cocoa and food fraud risks have risen sharply due to high commodity prices and strict new regulations, leading to increased adulteration and falsified sourcing documentation.

In Their Own Words

“Digital records alone are not sufficient for high-stakes supply chains. Enterprises need to prove the physical product is genuine, not just the paperwork. This unique integration with M-Trust covers all layers from the first mile to the last mile — physical authentication through Merck’s technology and digital verification through TrackTrace — creating the foundation for trusted Digital Product Passports across any industry.”
Stefan Deiss — CEO and Co-Founder, The Hashgraph Group
“Product authentication has always required bridging the physical and digital worlds. Integrating M-Trust’s verification with TrackTrace’s digital traceability creates exactly the kind of end-to-end trust infrastructure that enterprises and regulators are asking for. This is what product authentication looks like when it is built for the scale and complexity of modern supply chains.”
Dr. Thomas Endress — Executive Director, Head of M-Trust, Group Science & Technology Office, Merck

A Rapid Sequence of Milestones

The Merck collaboration is the latest in a series of platform launches and deployments for The Hashgraph Group as it positions Hedera-based infrastructure for enterprises and governments navigating complex regulatory environments.

Aug 2025
IDTrust self-sovereign identity platform launched.
Dec 2025
EcoGuard carbon credit platform launched — now deployed with government institutions in India and the Philippines.
May 2026
BrandBoost product launched.
Jun 2026
TrackTrace × M-Trust™ integration announced, with EU Digital Product Passport compliance at its core.

With EU Digital Product Passport deadlines approaching and global demand for verifiable supply chain data intensifying, THG is positioning its enterprise Web3 suite for further integrations and sector-specific deployments throughout 2026 and beyond.

About The Hashgraph Group

The Hashgraph Group (THG) is a Swiss-based Web3 and AI technology engineering company operating within the Hedera ecosystem. Specialised in the design, development, and deployment of enterprise-grade solutions on Hedera, THG focuses on building business without barriers by converging agentic intelligence and workflow automation with decentralisation and trusted data infrastructure.

Visit www.hashgraph-group.com to learn more.

Media Enquiries: [email protected]
Bitcoin Recovery Needs This To Happen, Glassnode Analyst Reveals
Bitcoin

Bitcoin Recovery Needs This To Happen, Glassnode Analyst Reveals

BitcoinJune 8, 2026·5 min read

Glassnode’s lead analyst identifies a structural barrier to Bitcoin’s sustained recovery: nearly 495,000 BTC purchased between $80,000 and $126,000 remains underwater, creating selling pressure that capped the May rally. For institutional investors sizing entry positions, understanding this supply overhang is critical to timing accumulation, as a transition of these coins to new buyers at lower cost basis levels appears necessary before a durable bull move can establish.

  • 495,000 BTC purchased in the $80k, $126k range now sits underwater as price trades below break-even levels established during 2025’s bull market run.
  • Cost Basis Distribution shows supply density above $80,000 exceeds clusters below that level, indicating weak hands may capitulate before recovery gains traction.
  • Glassnode analyst forecasts deeper correction or bear market continuation needed to force migration of trapped coins to new buyers’ hands at lower levels.
  • 495,000 BTC Purchased between $80k, $126k, currently held at substantial unrealized loss
  • $59,000 Bitcoin low last week versus $63,200 opening price on recovery Monday
  • $80,000 Threshold below which supply density shifts materially versus zones above it

Bitcoin’s short-term recovery potential hinges on a fundamental on-chain reality that institutional investors cannot ignore: a massive wall of supply held by buyers who entered near cycle highs now represents an overhang that historically impedes sustained rallies.

According to Glassnode lead research analyst CryptoVizArt, the Cost Basis Distribution metric reveals approximately 495,000 BTC clustered in the $80,000 to $126,000 range, all purchased at or near the peak levels reached during 2025’s bull market advance.

This concentration of underwater positions created measurable selling pressure during May’s recovery attempt, capping upside and reinforcing the notion that Bitcoin cannot simply rally past entrenched resistance without first resolving the supply imbalance at hand.

Glassnode Maps 495,000 BTC Overhang Blocking Recovery Above $80,000

The Cost Basis Distribution heatmap functions as a precise on-chain inventory of every bitcoin’s break-even price point, aggregating coins by their purchase levels throughout Bitcoin’s entire trading history.

What CryptoVizArt’s analysis reveals is a stark asymmetry: supply zones above $80,000 remain significantly more dense than clusters below that threshold, a structural imbalance that reflects how aggressively buyers accumulated during the asset’s rise toward $126,000 and above.

The visualization shows that while some coins have traded hands at lower prices during the February consolidation and subsequent weakness, the weight of accumulated supply at elevated cost basis levels has not yet meaningfully dispersed.

Holders of these nearly 495,000 BTC are all sitting on material unrealized losses as Bitcoin trades in the low $60,000s.

This distribution matters operationally because underwater investors behave predictably: they sell near their break-even prices, hoping to recover losses and exit positions. When Bitcoin rallied in May, this cohort of break-even sellers likely activated as price approached $70,000 and higher, creating the exact selling pressure that prevented sustained momentum.

The analyst’s observations align with historical patterns where dense supply clusters at prior cycle highs function as temporary caps on bull runs until either those positions liquidate at deeper losses or new buyers accumulate at lower levels, fundamentally shifting the ownership structure of the outstanding supply.

May Rally Stalled as Break-Even Sellers Met Fresh Demand

Bitcoin’s inability to sustain its May recovery above the low $70,000s was not accidental; it reflected the mechanical friction created when price climbs toward levels where significant supply purchased during the prior bull run reaches break-even.

CryptoVizArt noted that the zones near $126,000 were historically even denser than current readings, but as the cryptocurrency declined, some of that supply changed hands at lower prices, gradually weakening those extreme clusters. However, the $80,000, $126,000 band remains dominant relative to anything below $80,000, indicating the transition has been only partial and incomplete.

For institutional traders managing execution strategy, this means that any rally attempt that pushes Bitcoin back toward $80,000 and higher will encounter material selling from trapped holders seeking exit liquidity near break-even.

The effect has been to create a structural price cap that does not require new fundamental weakness to enforce, it is purely a function of supply positioning and underwater holder psychology.

Previous cycles have shown that this dynamic can persist for extended periods, particularly if price does not fall far enough to force capitulation or rise steadily enough to wash out weak hands before new demand can establish itself.

The analyst’s interpretation underscores why May’s rally fizzled: the supply overhang acted as a natural ceiling rather than requiring new bearish catalyst.

Deeper Correction Needed to Migrate Coins Into Stronger Hands

CryptoVizArt’s prescription for a durable recovery is direct: the Cost Basis Distribution’s underwater supply must “gradually migrate into new buyers’ hands at lower cost basis levels.” This transition does not happen through price appreciation alone; it requires price action sufficiently severe that trapped holders either capitulate to losses or new investors accumulate aggressively at lower levels, fundamentally altering the ownership makeup of the supply.

The analyst stated that achieving this shift will likely require “deeper correction and/or bear market continuation,” signaling that the current price action around $59,000, $63,200 may not yet represent the bottom necessary to force meaningful supply migration.

From an institutional perspective, this framework provides clarity on timing accumulation. The key inflection point arrives when the Cost Basis Distribution shows visible softening of the $80,000, $126,000 supply band and corresponding buildup of underwater positions at lower levels. Until that happens, any technical recovery faces friction from break-even sellers.

Glassnode’s analysis suggests this is not a matter of waiting for bullish news or on-chain adoption metrics; it is a structural supply problem that resolves through price discovery and forced capitulation on the part of weak hands holding coins purchased during the prior cycle peak.

The timeline for this transition remains uncertain. Previous cycles have shown the process can take months, and Bitcoin’s consolidation since February has allowed trapped supply to remain stubbornly in place rather than forcing resolution.

The question now is whether ongoing weakness will accelerate the migration or whether Bitcoin will stabilize at current levels, leaving the overhang in place to resurface at the next rally attempt.

The analyst’s framework suggests watching for evidence that the high-cost basis clusters are finally weakening and that new supply is accumulating at lower levels, the sign that the structural barrier has begun to dissolve.

Institutional investors should monitor Glassnode’s Cost Basis Distribution updates for evidence of supply migration out of the $80,000, $126,000 range into new buyers’ hands below $70,000; until that shift becomes visible on the heatmap, sustained recovery attempts face a mechanical supply ceiling that only deeper price discovery can resolve.

Get this in your inboxThe Crypto Coin Show newsletter covers the policy and market moves institutional crypto investors are pricing in.

Subscribe

Solana Crash Post-Mortem: 3 On-Chain Metrics Reveal the Damage
Solana

Solana Crash Post-Mortem: 3 On-Chain Metrics Reveal the Damage

BlockchainJune 8, 2026·5 min read

Solana’s 17% price decline this past week masked deeper structural damage: capital fled the ecosystem, long-term holders capitulated, and on-chain trading activity collapsed. For institutional investors, these metrics signal whether the bounce from $60 represents genuine accumulation or a fragile dead-cat rebound vulnerable to fresh selling pressure.

  • Solana DeFi TVL fell 9.55% in one week to $4.87 billion, indicating capital withdrawal rather than price depreciation alone
  • Long-term hodler net position dropped from 3.27 million SOL to 2.36 million SOL in six days, showing conviction among patient holders broke
  • DEX dominance slid to 22.6% from a 30.4% high on June 4, indicating structural capital rotation away from Solana’s trading infrastructure
  • -9.55% Solana DeFi TVL decline over one week versus longer-term ecosystem stability
  • 2.36M Long-term holder SOL position, down from 3.27 million SOL in six days
  • 22.6% Current DEX dominance, down from 30.4% high on June 4 this month

Solana’s decline from recent highs has followed the familiar pattern of crypto pullbacks at first glance: prices fell roughly 17% over seven days, volatility spiked, and leverage unwound on centralized exchanges. But three separate on-chain metrics reveal the selloff carried conviction that price action alone does not capture.

Capital genuinely left the network, not just existing positions lost notional value. Long-term holders, investors with positions older than 155 days, sold into the weakness, signaling broken confidence rather than typical speculation. And trading activity on decentralized exchanges shifted away from Solana toward rival networks.

Together, these signals suggest any bounce from the $60 low faces structural headwinds that remain unresolved.

Solana DeFi TVL Falls 9.55% in One Week as Users Pull Real Capital

The clearest sign of ecosystem stress sits in total value locked, the dollar sum of assets deposited across all of Solana’s decentralized finance protocols. TVL fell to $4.87 billion, excluding liquid staking tokens, marking a 9.55% decline over a single week and a steeper 15% drop across 30 days.

The distinction matters to institutional observers because a TVL decline reflects actual capital withdrawal, not merely mark-to-market losses on existing positions. If users were holding deposits through the price decline, TVL would fall only to the extent of token price depreciation.

Instead, the data shows users actively removing liquidity from lending protocols, automated market makers, and other DeFi primitives.

This pullback raises a sharper question: who exactly was selling, and what does their identity tell us about the nature of the selloff?

The TVL exodus points to a loss of confidence at the application layer. Solana’s DeFi ecosystem, Marinade Finance, Magic Eden, Raydium, and other marquee protocols, depends on consistent liquidity provision to function. When users remove deposits at scale, it reduces borrowing capacity, narrows bid-ask spreads, and raises execution costs for traders.

The effect compounds: higher costs deter marginal participants, which further reduces available liquidity and widens spreads further. This feedback loop is how ecosystem damage persists even after immediate price pressure eases.

Institutional investors evaluating Solana as a platform for derivative trading or yield strategies must account for this deteriorating liquidity conditions, not just spot price recovery.

Long-Term Holders Capitulated, Dropping Net Position by 910,000 SOL

The most decisive evidence of structural weakness appears in holder behavior data tracked by on-chain analytics firms. Hodler net position change, a metric measuring whether investors holding positions for 155 days or longer are accumulating or reducing holdings, fell sharply as the price declined.

The figure dropped from approximately 3.27 million SOL on May 31 to roughly 2.36 million SOL by June 6, a loss of roughly 910,000 SOL in just six days. When the most patient capital holders in a network sell into weakness rather than accumulate, it signals conviction has genuinely broken, not merely speculative interest reversing.

When the most patient holders sell into weakness, it shows conviction broken, not just speculative interest.

On-chain analysis, Glassnode data

This metric carries particular weight because long-term holders represent the most rational segment of any network’s investor base. They have already endured multiple cycles of volatility and drawdowns, suggesting they hold for perceived fundamental value rather than momentum.

Their capitulation during this selloff therefore suggests something material shifted in their assessment of Solana’s prospects, whether technical security concerns, deteriorating application performance, or competitive pressure from other Layer 1 networks.

Institutional asset managers tracking smart money behavior use hodler net position change as a leading indicator of whether retail capitulation will reverse or continue.

The timing compounds the signal’s strength. The 910,000 SOL exodus occurred precisely during the period when prices reached their $60 low, meaning long-term holders were not selling gradually into strength but rather liquidating into the sharpest downside moment.

This behavior contrasts markedly with typical accumulation patterns during genuine capitulation, where patient holders gradually increase positions as prices fall.

DEX Dominance Collapsed to 22.6% as Trading Volume Rotated Away From Solana

Beyond capital departures and holder capitulation, the selloff’s structural nature appears in decentralized exchange trading data. Solana’s DEX dominance, its share of total decentralized exchange volume across all blockchains, fell to 22.6%, below its 60-day average of 23.3% and sharply lower than the 30.4% high recorded on June 4, just days earlier.

This represents a loss of nearly 8 percentage points of market share in less than a week, indicating that capital rotated not merely away from SOL the token but away from Solana’s on-chain trading infrastructure entirely.

This distinction separates token weakness from platform weakness. A price decline that leaves market share intact suggests traders still prefer Solana’s execution environment and speed, even at lower token prices. Falling dominance, by contrast, signals traders are actively choosing rival platforms, potentially Ethereum, Arbitrum, Base, or other competitors.

For institutional market makers and algorithmic traders, DEX dominance shifts indicate changes in where liquidity concentrates and where execution slippage occurs. Lower dominance typically correlates with wider bid-ask spreads on Solana itself, making it costlier to trade in and out of positions on the network.

Centralized exchange volume data adds to this narrative. SOL spot volume on venues like Binance, Coinbase, and Kraken peaked at $7.03 billion on June 6, the height of the panic selling, then retreated sharply as the immediate pressure eased.

The elevation of CEX volume during the crash, rather than on-chain volume, suggests most of the selling pressure came from institutional and retail exit positions using centralized rails, not from sophisticated traders arbitraging on-chain markets. This pattern indicates less conviction among informed participants willing to take technical risk through decentralized venues.

Tentative Bounce Shows Long-Term Holders Resuming Purchases, But At Fragile Levels

One early positive signal has emerged since Solana rebounded roughly 13% from its $60 low.

Hodler net position change turned positive again as prices stabilized, suggesting long-term holders began resuming purchases once the selling pressure abated. This shift, though modest, contrasts with the prior week’s capitulation and hints that the most patient capital has begun to differentiate between panic-driven selling and genuine value. However, institutional investors must treat this early signal with skepticism. The magnitude of the rebound remains small relative to the decline, and none of the three metrics have returned to pre-crash levels. TVL remains 9.55% below its starting point for the week, DEX dominance sits below both 30-day and 60-day averages, and hodler position, while rising, remains well

Get this in your inboxThe Crypto Coin Show newsletter covers the policy and market moves institutional crypto investors are pricing in.

Subscribe

Load More

CCS Insider · free, twice a week

The crypto news that matters, twice a week

Bitcoin and market analysis, founder interviews and the week's key stories from CCS Insider.

Readers in 160+ countries. No spam, unsubscribe anytime.