Ship traffic through the Strait of Hormuz jumped almost 400% in two weeks. The report landed on Saturday, with oil markets shut. Monday is the first chance traders get to price it.
On the surface, that should ease supply fears and pull crude lower. More ships means more oil. Yet the shipping data carries a catch that argues the drop may never arrive.
Hormuz Traffic Recovers But Stays Far Below Pre-War Levels
The surge is real, and it is easy to check. UK Maritime Trade Operations (UKMTO), the British naval body that tracks merchant shipping in the Gulf, publishes a weekly transit count.
In the week to August 7, it logged 39 full transits. A week later, 151. In the week to August 21, 192, according to its latest report. That is a rise of 392% in 14 days, so the headline number holds up.
hormuz-transits
The baseline is another matter. Before the war, roughly 20.9 million barrels a day moved through the strait, EIA figures show. That is close to a fifth of everything the world burns.
Today’s traffic sits about 90% below that mark, by UKMTO’s own reckoning. Going from almost nothing to slightly more than almost nothing still produces a spectacular percentage.
Most of the returning ships hug Oman’s coast, on a corridor backed by Washington and rejected by Tehran, which cannot levy a toll on it.
The arrangement has a precedent. In 1987 the US reflagged 11 Kuwaiti tankers and sent the Navy to escort them through the same water. The first convoy sailed on July 22. Two days later the tanker Bridgeton struck a mine.
“It increasingly looks like Iran has at least partially lost control of the strait,” Homayoun Falakshahi, head of crude oil analysis at Kpler, told CNN.
Start with how the count is made. UKMTO tracks vessels by their transponders, and in a war zone many captains simply switch them off.
Windward, a maritime data firm, recorded nine ships crossing the southern corridor dark overnight on August 21. It called that the largest single night on record.
So part of the 400% is not new ships at all. It is old ships turning their signals back on. The count has risen faster than the cargo, a gap earlier analyst timelines for Hormuz had already flagged.
Barrels tell the sober version. Energy Secretary Chris Wright puts outflows near 9 million a day. Rory Johnston, who writes the Commodity Context newsletter, reckons the peak is closer to 7 million.
Here’s what I wrote in Oil Context Weekly today on this exact topic:
“Let’s begin with the 9 million barrels a day figure. According to our analysis using tanker tracking data from Kpler, the recent peak—over the past week or so—in confirmed Hormuz transits is roughly 7.5 MMbpd… https://t.co/0KtQtQ24KU
Either way, the strait is running at under half its pre-war norm.
Refined fuel is tighter still. The US diesel crack spread, the margin refiners earn turning crude into diesel, hit an all-time high of $102.20 on August 17, Reuters reported. In calmer periods it sits in the teens or low twenties.
That squeeze, rather than any shortage of crude itself, is what has been setting Brent crude prices.
Both benchmarks gained about 5% across the week, so crude enters Monday with momentum behind it rather than against it.
WTI and Brent Test the May Downtrend Before Monday
US crude spot settled at $87.57 on Friday, up 0.43%. UK crude spot closed at $92.40, up 0.75%. Both are spot contracts, the series these charts track, and they run a little under the front-month futures.
US (WTI) and UK (BRENT) Crude Oil Spot Prices. Source: TradingView
Those are the levels Monday opens from. Each sits just below a descending trendline drawn from the May highs. Brent has already breached its line, while WTI trades a fraction beneath its own.
Futures reopen on Sunday evening in New York, which makes Monday the first full session. It opens with a policy headline attached.
Treasury Secretary Scott Bessent has called a Monday press conference to unveil new Iran sanctions. Mohsen Rezaei, who runs Iran’s Supreme National Security Council, has warned Tehran will strike at the interests of any country that joins in.
Speaking in South Carolina on Friday, President Donald Trump restated his claim on the waterway.
“We don’t even know if we won, because I view the Strait of Hormuz as an American territory right now,” Trump, quoted by UPI.
So which way does Monday cut? Sanctions restrict supply, and that argues for higher prices rather than lower ones.
For oil to break lower, the package would have to land softer than trailed, or carry a hint that talks are back on.
A rejection at the trendline would be the first confirmation. It keeps May’s pattern of lower highs alive and puts $71.25 on WTI and $77.78 on Brent back in view.
A close above the line does the opposite. It would mark the first genuine break since the war began, and every Brent price forecast built on that downtrend would need rewriting.
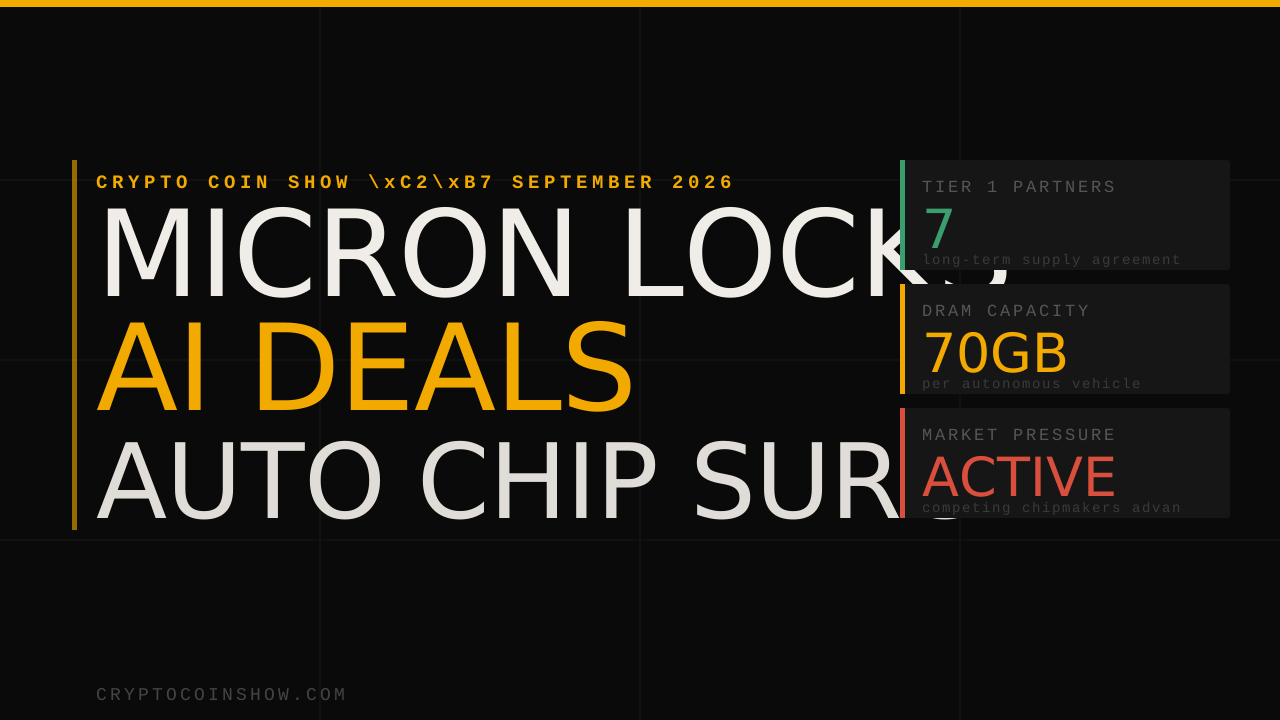
Micron Technology locked in long-term supply deals with Qualcomm and six other automotive suppliers on Thursday, moving to secure memory and storage capacity for an automobile industry that is starting to consume chips at a scale rivaling data centers.
The company said the Strategic Customer Agreements cover seven Tier 1 suppliers, which include Qualcomm, Visteon, HARMAN, JOYNEXT, DENSO, Astemo and Hyundai Mobis.
According to Micron, the signed contracts set terms for supply commitments and pricing, and give the chipmaker earlier visibility into how much automobile memory its partners will need for upcoming vehicle programs. Micron mentioned the agreements during its fiscal third-quarter 2026 earnings call.
Modern cars require huge memory
Reports state that a high-end car working with an autonomous-driving computer’s memory requirements can approach 70GB of DRAM, a figure that rivals a laptop. For reference, the infotainment system on the Mercedes-Benz MB.OS platform uses 4 to 12GB, while the cockpit computer in BMW’s new iX3 electric SUV runs with 16 to 24GB of memory.
Micron CEO Sanjay Mehrotra said vehicles with L2+ or higher autonomous capability need more than five times the memory and storage of a standard car. He estimated that such intelligent vehicles will make up more than 20% of sales in 2026 and go past 40% by 2030.
Market research firm TrendForce expects prices for car-grade SLC NAND flash, used in electronic control units and driver-assistance systems, to climb between 120% and 170% in the second half of 2026.
Micron wants to tie down its customers
Samsung Electronics’ automotive memory share reached an estimated 40% last year, edging past Micron’s 36% for the first time, according to an S&P Global Mobility report. SK Hynix has also been chasing the top functional-safety rating, ASIL-D, for its automotive LPDDR5X.
Micron’s reaction to these moves is to retain its customers. The company has already signed long-term deals with General Motors and Ford, and Mehrotra said in June that Micron had reached 16 strategic customer agreements in total. Micron is also the only chipmaker producing HBM (high bandwidth memory) in the United States, and its parts can pair with Nvidia AI processors.
Mehotra also said “The next phase of automotive innovation will depend on the strength of the ecosystem behind it,” adding that the agreements would help advanced vehicle platforms get the memory needed for “richer, safer and more intelligent experiences.” Qualcomm CEO Cristiano Amon claimed the collaboration gives automakers and Tier 1 suppliers “the strong technology foundation they need as vehicles become more intelligent and connected.”
Hyundai Mobis CEO Lee Gyu-suk said his company’s work with Micron is meant to support future driver-assistance systems and software-defined vehicle architectures.
VeChain price projection suggests a peak price of $0.008402 by 2026.
Traders can expect a minimum price of $0.018272 and a maximum price of $0.033129 by 2029.
By 2032, VeChain’s price could potentially surge to $0.075150.
VeChain initially marketed itself as a blockchain network to provide transparency and efficiency to real-world applications enhancing customer trust, providing real-time tracking of goods and items across supply chains and preventing counterfeiting. The main focus of the chain was to track products from their creation to their delivery to the end-consumer as well as provide verification. However, as any good tool, VeChain and its aim have evolved since its launch in 2018.
With global trends shifting towards a greener, a more environment friendly future, VeChain has expanded its focus towards the same. VeChain now offers sustainability incentives, a digital identity as well as rewards environmental friendly actions through its programs. To prove its dedication to the cause, it introduced VeBetter, a Web3-powered ecosystem that rewards users with B3TR tokens for engaging in eco-friendly habits. VeBetter acts as a DAO-governed marketplace for sustainability-focused apps.
With growing optimism around the VeChain ecosystem, especially following recent collaborations with Walmart and other major partners, VeChain is positioning itself as one of the leading blockchain networks for real-world utility and sustainability-focused innovation.
VeChain overview
Cryptocurrency
VeChain
Symbol
VET
Price
$0.004377(-3.6%)
Market Cap
$400.16 Million
Trading Volume (24-h)
$14.24 Million
Circulating Supply
85.98 Billion VET
All-time High
$0.2782, Apr 17, 2021
All-time Low
$0.001678, Mar 13, 2020
24-h High
$0.004544
24-h Low
$0.004328
VeChain price prediction: Technical analysis
Market Sentiment
Bearish
50-Day SMA
$0.00609
200-Day SMA
$0.00820
Price Prediction
$0.00401 (-5%)
Fear & Greed Index
22.64 (Extreme Fear)
Green Days
8/30 (27%)
14-Day RSI
38.65 (Neutral)
VeChain price analysis: VET falls to $0.004370
TL;DR Breakdown:
VeChain price analysis shows fall to $0.004370
Cryptocurrency lost 3.6% of its value in 24 hours
VeChain coin finds support at $0.004370
VeChain (VET) current price analysis for 30 June shows strong bearish movement across the last few days as the price fell below the $0.00440 mark.
VeChain 1-day price chart: VET falls to $0.00437
VeChain (VET) price action shows a bearish week as the price dropped from the highs of $0.004500 mark to the $0.004370 mark where it trades at press time.
The Relative Strength Index (RSI) falls to 29.67, with the slope showing rising momentum as the price moves back towards $0.004300. The indicator leaves low room for volatile movement in downwards direction. Meanwhile, the Bollinger Bands suggest rising volatility, with the bands diverging across the past few days.
VeChain 4-hour price chart: VET shows neutral momentum
VeChain (VET) live price trades at $0.004377 on the 4-hour chart, showing slight recovery in recent hours.
The Relative Strength Index (RSI) stands at 38.42, showing a bearish market sentiment as VET hovers around $0.004370. The Bollinger Bands are converging and show support and resistance levels at the $0.004332 and $0.004666 levels respectively.
Vechain price analysis showed a sharp decline across the past few days as the price failed to rise past the $0.00460 mark and crashed. VET found support at the $0.004500 mark, before it crumbled causing a decline to the $0.004370 mark.
Overall, Vechain suggests that the price may fall towards $0.004200 as it fails its attempts to climb towards the $0.005600 mark. However, if the bulls are able to hold the $0.004350 level and establish support above $0.004700 mark, VET may rise to the $0.005000 level.
Is Vechain a good investment?
VeChain, as a notable blockchain project, stands out among crypto tokens in cryptocurrency because it focuses on supply chain management and enterprise solutions, which is not considered financial advice. VeChain operates on a dual-token model with two tokens: VET and VTHO. VET tokens are used for staking and governance, while VTHO is used to pay for transaction fees and smart contract execution. Users expend VET to participate in the network, and writing data to the blockchain is managed through VTHO, separating the cost of data submission from the value of VET. Smart contracts play a crucial role in automating business processes and enhancing trust, increasing transparency and efficiency in global trade.
With partnerships with major companies and a strong emphasis on real-world applications, many believe VeChain is a good buy due to its significant growth potential. Its innovative use cases and practical implementations appeal to businesses seeking operational improvements, making it an attractive option for informed investors.
However, it is advised to do your own research and conduct experts opinion before investing in the volatile market.
Why is VET down?
VeChain (VET) price shows that the bulls were rejected at $0.004500 and the rejection caused a crash to the current $0.004370 mark.
Will VeChain recover?
VeChain has experienced a notable selloff in the last thirty days, with the price falling from near the $0.03 mark to its highest price of the period to the current $0.021 level. However, industry analysts suggest that this downturn in the financial markets may not be long-term, a sentiment shared by many VET holders. Most projections indicate that VeChain could regain strength as market conditions improve, with expectations for the asset to potentially close the year between the $0.035 and $0.05 price levels.
Will VeChain reach $0.05?
Analysts suggest VeChain could attain $0.05 by 2031, as the minimum price is projected to be $0.0434 and the average price at $0.0500, as per the VET price prediction 2031. with a potential peak of $0.0585.
Will VeChain reach $0.10?
VET is expected to trade above $0.10 by 2035.
Does VET have a good long-term future?
VET has a good long-term future due to its strong use cases, growing on chain activity, and active development team at the Vechain Foundation.
Recent news/opinion on Vechain
Vechain’s recently revealed its Roadmap for 2026 including key information regarding planned developments including full Ethereum compatibility.
Our 2026 roadmap just dropped & the vision for $VET has never been bigger.
VeChain lived through four ‘chapters’ with a key thesis: trust is its own asset class.
Business needs it, individuals need it, & soon, billions of AI agents will, too.
In June 2026, the price of VeChain is anticipated to reach a minimum of $0.00410. The VET price can be expected to peak at $0.00620, maintaining an average of $0.00510 by the end of the month.
Month
Minimum Price ($)
Average Price ($)
Maximum Price ($)
June
0.00410
0.00510
0.00620
VeChain price prediction 2026
In 2026, the price of the VeChain coin is anticipated to touch a minimum of $0.003831, reflecting the current VeChain sentiment. The VET price might peak at $0.008402, maintaining an average of $0.005317 by the end of the year.
Year
Min. Price ($)
Average Price ($)
Maximum Price ($)
2026
0.003831
0.005317
0.008402
VeChain price prediction 2027-2032
Year
Min. Price ($)
Average Price ($)
Maximum Price ($)
2026
0.003831
0.005317
0.008402
2027
0.010044
0.011049
0.012153
2028
0.013674
0.016546
0.025592
2029
0.018272
0.028151
0.033129
2030
0.023265
0.036511
0.050684
2031
0.027701
0.055753
0.068318
2032
0.030117
0.062107
0.075150
VeChain Price Prediction 2027
For 2027, VeChain (VET) is expected to reach a minimum price of $0.010044. It could potentially climb to a high of $0.012153, averaging around $0.011049.
VeChain Price Prediction 2028
By 2028, VeChain price prediction suggests VET could trade at a minimum value of $0.013674. It might surge to a high of $0.025592, with an average price of $0.016546.
VeChain Price Prediction 2029
VeChain price prediction estimates VET to trade at a minimum of $0.018272 in 2029. It might reach a maximum of $0.033129, with an average value of $0.028151.
VeChain Price Prediction 2030
In 2030, VeChain’s price will likely hit a floor of $0.023265. Based on analysis, it could peak at $0.050684, with an average closing price of $0.036511.
VeChain Price Prediction 2031
The VeChain price prediction for 2031 projects a minimum price of $0.027701, a maximum price of $0.068318, and an average trading price of $0.055753.
VeChain Price Prediction 2032
In 2032, VeChain forecast suggests VET could trade at minimum and maximum prices of $0.030117 and $0.075150, respectively. The price might maintain an average of $0.062107
Vechain price prediction 2026-2032
Vechain Price Forecast: By Analysts
Firm
2026
2027
Coincodex
$0.01498
$0.01274
DigitalCoinPrice
$0.0208
$0.0291
Cryptopolitan’s VeChain (VET) price prediction
Cryptopolitan’s market analysis predictions show that VeChain will achieve a high of $0.008402 in 2026. In 2028, it will range between $0.013674 and $0.025592, with an average of $0.016546. In 2032, it will range between $0.030117 and $0.075150, with an average of $0.062107. Note that these predictions are not investment advice. Seek independent professional consultation or do your own research.
VeChain historic price sentiment
VeChain Price History
VeChain began in 2015 as a private consortium chain for blockchain applications. It transitioned to a public blockchain with the ERC-20 token VEN in 2017 and launched its mainnet as VET in 2018.
In 2018, VeChain partnered with DHL to develop blockchain solutions for logistics but saw a significant price correction, stabilizing at lower levels.
The price remained relatively stable in 2019 and 2020, with occasional spikes as VeChain continued developing technology and forming partnerships.
In 2021, VeChain’s price surged to an all-time high of $0.20 in May but dropped to $0.070 by December.
In 2022, VeChain attempted to recover but remained below $0.10, with continued volatility throughout the year and into early 2023.
Towards the end of 2023, the price saw a slight uptick, stabilizing around $0.020 by early 2024.
In 2024, VeChain’s price fluctuated, recovering to $0.025 by mid-March but dropping due to bearish trends, reaching a low of $0.019 by August.
It traded around $0.021 in September but ended the month above the $0.024 mark. The price remained mostly stable in October, with the occasional bearish movement causing a decline from the $0.02400 level to start November at the $0.02100 price level.
The asset closed November at a high level, with prices near the $0.04600 mark and a strong bullish outlook. However, the bulls only took the price higher in December, as the $0.0500 resistance was crushed swiftly.
As of January 2025, VET traded around the $0.04300 mark as it started and closed the month around the same level.
In February, the price fell towards the $0.03000 mark as bears took over, ending the month at $0.02800. In March, the net movement was low, but the volatility was very high, as the price fell to $0.02200 where it closed the month.
In April the price saw an initial crash but observed sharp recovery ending the month above the $0.02600 mark. In May the price dwindled again ending the month around $0.0250. In June the price continued to struggle as it dropped to $0.0200 to end the month.
July saw a sharp rise to the asset’s volatility with VET crossing the $0.02800 mark. However, the price could not be maintained and VET ended the month around the $0.02200 level. In September, the price saw high volatility reaching as high as $0.0260 but failed to stay at the level and ended the month below the $0.02200 mark.
In October, the price declined further and ended the month below the $0.01500 mark as bears dominated the crypto markets during the later half of the month. in November, the downtrend continued with VET ending the month below the $0.0130 mark. In December, the price continued to move downwards ending the year at $$0.0122.
In January, the trend continued with VET falling below the $0.0100 mark and ended the month below the $0.0080 level. In February the trend continued with the price ending the month below the $0.0070 mark. In March, the trend continued with VET closing the month at the $0.00677 mark.
By the end of April, VET price hovered around $0.007. a trend that did not continue into May as the price saw rapid decline in the month ending below the $0.0050 mark.
The Hashgraph Group (THG) has announced a strategic collaboration with science and technology company Merck that extends its TrackTrace Digital Product Passport (DPP) platform. Built on the Hedera network and designed to support compliance requirements for the global supply chain industry, the collaboration aims to meet the EU’s incoming product transparency regulations — ensuring product trust, quality, and improved sustainability across physical goods from first mile to last.
The Integration
A Single Trust System for Physical and Digital Proof
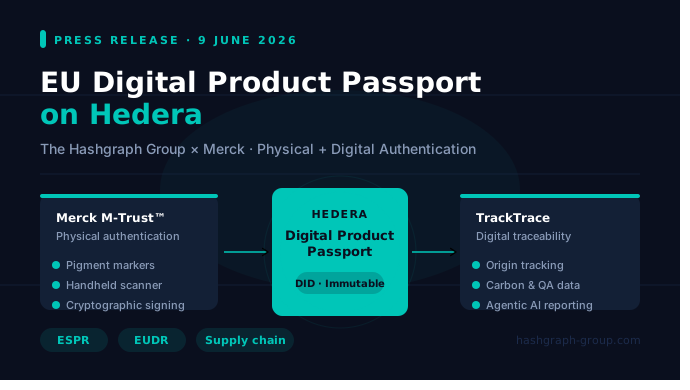
The technical integration brings together THG’s Hedera-powered digital traceability infrastructure with Merck’s M-Trust™ physical authentication technology system. The combined architecture provides the global supply chain ecosystem with a unified proof framework: proof of quality, proof of traceability, proof of authenticity, and proof of value transfer — all anchored to Hedera as a single source of truth.
Where TrackTrace creates tamper-proof digital records of a product’s origin and lifecycle, Merck’s M-Trust™ technology adds the layer digital systems alone cannot deliver: verification that the physical product in your hand is the real thing, not a counterfeit.
Chain of Proof Architecture
Physical Authentication — M-Trust™
Invisible security markers embedded into the product and packaging using Merck’s patented pigment technology. Verified at any point in the supply chain via M-Trust™ handheld scanner.
Cryptographic Signing & On-chain Recording
Each physical verification is cryptographically signed and recorded on the Hedera network, creating a permanent and immutable entry in the product’s Digital Product Passport.
Digital Traceability — TrackTrace
Real-time tracking of origin, ethical sourcing, carbon emissions, and quality assurance data. Every tracked process is issued a decentralised identifier (DID) as a verifiable, immutable record.
Independent Audit & Agentic AI Reporting
Any authorised third party can independently audit a product, process, or claim without relying on a central authority. Integrated Agentic AI automates reporting workflows end to end.
An initial supply chain pilot has already been demonstrated, with a full announcement forthcoming. The combined solution is designed to function across any sector where authenticity, provenance, and regulatory compliance are non-negotiable — from foods and pharmaceuticals to luxury goods and industrial components.
Regulatory Context
Regulation Is Raising the Bar
New EU rules are tightening what companies must prove about the products they sell. The collaboration between THG and Merck is designed to support the entire supply value chain in meeting these requirements, with traceability and authentication built into the trust system from the ground up.
ESPR — Ecodesign for Sustainable Products Regulation
Requires Digital Product Passports via QR code detailing a product’s origin, composition, sustainability credentials, and full lifecycle. Taking effect from 2026 onwards.
EUDR — EU Deforestation Regulation
Requires importers of commodities including cocoa, coffee, and timber to provide verified, farm-level traceability data — with deforestation-free certification that can be independently audited.
Reliable product traceability also underpins sustainability commitments, ethical sourcing, carbon reporting, and consumer trust. The consequences of weak traceability are already visible: in 2026, cocoa and food fraud risks have risen sharply due to high commodity prices and strict new regulations, leading to increased adulteration and falsified sourcing documentation.
Leadership
In Their Own Words
“Digital records alone are not sufficient for high-stakes supply chains. Enterprises need to prove the physical product is genuine, not just the paperwork. This unique integration with M-Trust covers all layers from the first mile to the last mile — physical authentication through Merck’s technology and digital verification through TrackTrace — creating the foundation for trusted Digital Product Passports across any industry.”
Stefan Deiss — CEO and Co-Founder, The Hashgraph Group
“Product authentication has always required bridging the physical and digital worlds. Integrating M-Trust’s verification with TrackTrace’s digital traceability creates exactly the kind of end-to-end trust infrastructure that enterprises and regulators are asking for. This is what product authentication looks like when it is built for the scale and complexity of modern supply chains.”
Dr. Thomas Endress — Executive Director, Head of M-Trust, Group Science & Technology Office, Merck
Building Momentum
A Rapid Sequence of Milestones
The Merck collaboration is the latest in a series of platform launches and deployments for The Hashgraph Group as it positions Hedera-based infrastructure for enterprises and governments navigating complex regulatory environments.
EcoGuard carbon credit platform launched — now deployed with government institutions in India and the Philippines.
May 2026
BrandBoost product launched.
Jun 2026
TrackTrace × M-Trust™ integration announced, with EU Digital Product Passport compliance at its core.
With EU Digital Product Passport deadlines approaching and global demand for verifiable supply chain data intensifying, THG is positioning its enterprise Web3 suite for further integrations and sector-specific deployments throughout 2026 and beyond.
About The Hashgraph Group
The Hashgraph Group (THG) is a Swiss-based Web3 and AI technology engineering company operating within the Hedera ecosystem. Specialised in the design, development, and deployment of enterprise-grade solutions on Hedera, THG focuses on building business without barriers by converging agentic intelligence and workflow automation with decentralisation and trusted data infrastructure.
Business activity picked up in April, but Americans are paying more for almost everything, and most say things are only getting worse.
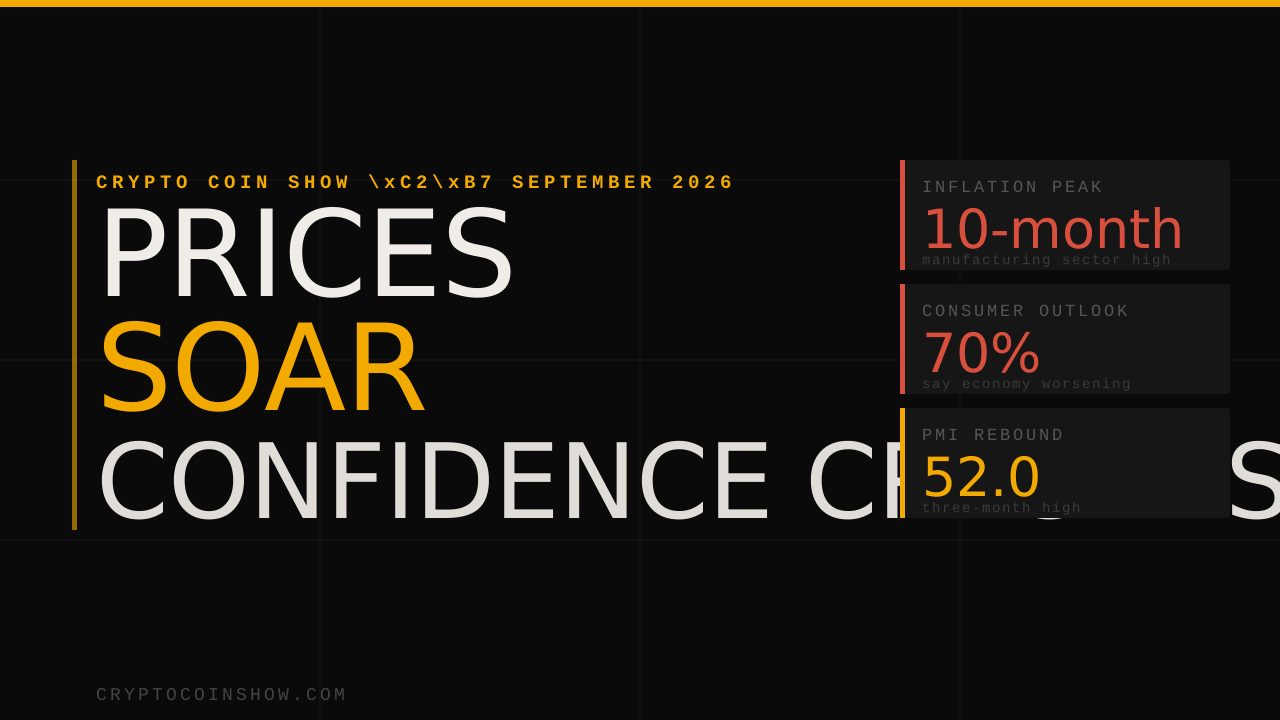
The U.S. composite PMI is at 52.0 this month, a three-month high that suggests a slight recovery following a sluggish March, according to new data from S&P Global.
However, the average price of goods and services increased at its quickest rate since July 2022, a signal that should concern both consumers and legislators.
However, economists advise being cautious. Much of that growth came not from people actually buying more, but from companies rushing to stock up before prices climb further or supply chains buckle.
Surveys were filled with phrases like “panic buying” and “emergency buying,” language that points to fear, not confidence.
Services told a quieter story. The services PMI edged up to 51.3, but that is still the second-lowest reading of the past year. New orders barely grew.
Businesses and households across tourism, financial services, and other sectors are holding back spending. People are waiting to see what happens next, weighed down by geopolitical tensions and stretched budgets.
Supply chains under pressure
Supply chains are showing real strain. Delays from factory suppliers in April were the worst since August 2022.
Shipping difficulties related to continuing hostilities overseas account for a portion of that.
A portion of it stems from businesses purchasing excess inventory just to be safe, which further restricts supply and drives up costs.
The report’s pricing information is uncomfortable to read. Inflation in manufacturing products reached a ten-month high. The service sector’s price rises hit a 45-month high.
Input costs rose at their fastest rate in 11 months. Taken together, the inflation picture is getting harder to dismiss.
Regular Americans are feeling it. A new Fox poll found that 70% of respondents believe the economy is getting worse, up sharply from 55% a year ago.
Only 26% said conditions have improved. The pessimism cuts across party lines. Even among Republicans, 56% described the state of the economy as bad.
The consumer price index rose 3.3% in March, slightly above the level when he took office.
Roughly one in four Americans approves of how he is handling the cost of living. One major driver of that frustration is energy costs, pushed higher by the ongoing conflict with Iran.
That conflict is also shaping what comes next for the broader economy.
The prospect of gasoline hitting $5 a gallon is now a real concern for both the White House and the Federal Reserve.
For the Fed, the situation is getting harder to navigate.
Chris Williamson, chief business economist at S&P Global, said that if inflation keeps moving in the direction the PMI data suggests, it becomes much harder for the central bank to make a case for cutting interest rates.
The gap between what the numbers show and what people feel is hard to ignore. A manufacturing PMI of 54.0 normally signals solid growth.
However, rather than being motivated by actual customer demand, this reading is being driven by defensive actions taken by businesses to create buffers against uncertainty.
There might not be enough actual demand to sustain the trend when stockpiling eventually decreases.
For the time being, the Fed is torn between an economy that appears to be doing well and inflation that is being driven up more by fear than by growth.
Any discussion of rate cuts will remain firmly on hold until that changes.
The US is set to announce the findings of a national security investigation into semiconductor imports, with the results expected within two weeks.
Commerce Secretary Howard Lutnick announced the move on Sunday after a high-level meeting between President Donald Trump and European Commission President Ursula von der Leyen.
Known as a Section 232 investigation, the inquiry examines whether the US government’s heavy dependence on foreign-made semiconductors threatens national security. If the findings bear out those risks, the White House will likely slap new tariffs on imported chips, potentially redrawing the global tech supply chain.
The move is part of a continuing effort by President Trump to use tariff policy aggressively as both an economic and political weapon in his second term. Former President Joe Biden hoped to draw manufacturers back by offering federal subsidies through the CHIPS and Science Act. Still, Trump is pursuing protectionist endeavors to repatriate chipmaking to American shores.
Europe eases pain with a new trade pact
The semiconductor probe is not just a house matter — it has international ripple effects. However, the European Union, cognizant of the potential blowback, quickly engaged in last-minute trade talks with Washington to shield itself from any blowback.
Shortly after their meeting, President Trump and the EU Commission President Ursula von der Leyen revealed a new framework trade deal. The agreement includes a 15% generic rate on all EU imports to the US, and a 25% rate on European autos.
The ongoing semiconductor investigation motivated the European Union to pursue a swift trade agreement with the United States. European leaders aimed to address several pressing trade issues simultaneously, with semiconductor tariffs a top priority.
The US administration used the investigation as a strategic advantage in negotiations. European Commission President took steps to avoid potential chip-related tariffs through diplomatic engagement, though similar outcomes may not be guaranteed for other trading partners.
US prepares to announce more tariffs
The semiconductor probe is just the latest part of a broader effort by the Trump administration to overhaul US trade policy. And since returning to office in January, Trump has reinstituted a number of these 232 investigations, not only for chips, but also for pharmaceuticals, copper, and lumber; an investigation into automobiles remains open.
These sectors are considered critical to national security, particularly in light of global supply disruptions caused by the COVID-19 pandemic and rising geopolitical tensions. The administration argues that bringing production back to the United States will enhance the country’s economic resilience and strategic strength.
Already, the administration has placed a 10% tariff on most imports, and rates are scheduled to surge after August 1 for some of America’s largest trading partners, including China, South Korea, and parts of Latin America. A fresh round of duties could soon cover more electronics, industrial machinery, and rare earths categories.
His supporters say these are policies aimed at restoring American industrial muscle. Critics say they drive up consumer prices and risk retaliation from friends and foes.
Analysts are watching Taiwan closely. The island is responsible for over 60% of the world’s semiconductors and almost 90% of advanced chips used in smartphones, servers, AI, and defense systems. An abrupt duty on Taiwanese chips could increase production costs across industries, including automotive, military, and other sectors, and foment diplomatic tension.
At the same time, domestic chipmakers like Intel, GlobalFoundries, and Texas Instruments have been increasing their US manufacturing capabilities. Industry leaders, however, say the process will take years and sustained government support.
Building domestic semiconductor capacity is a long-term challenge. Industry leaders note that cutting chip imports abruptly is unrealistic, as constructing fabrication plants takes years, requires substantial financial investment, and depends on a highly skilled workforce.
Full results of the investigation will be released before mid-August. It could be a first step toward broader decoupling from global supply chains.
Your crypto news deserves attention – KEY Difference Wire puts you on 250+ top sites
China has released its first set of rare earth mining quotas for 2025 quietly, marking a move to tighten state control over an industry vital to everything from electric cars to military hardware.
Reuters reported that Beijing issued the initial quotas just last month, without any formal announcement or public notice. Companies granted permission to mine and process these critical minerals were asked to keep the figures confidential, reportedly for security. Neither the volume nor the specific breakdown of mining versus smelting allowances has been disclosed.
For years, China’s Ministry of Industry and Information Technology has published its first quarterly quota on its website, usually in the opening months of the year. In contrast, this year’s decision came in silence, underlining Beijing’s growing caution about releasing data that reflects its grip on global supplies.
Analysts watch these quotas closely, as they signal how many rare earths, 17 metals essential to electric vehicles, wind turbines, robots, and missiles, will enter the market. China alone accounts for the lion’s share of global production. Delays to the usual spring announcement had fuelled speculation that authorities were reassessing how tightly to hold the reins.
When asked why the figures were not shared publicly this time, the Industry Ministry didn’t respond to requests for comments. Observers say the decision fits a broader trend of Beijing using rare earths as leverage in trade talks, notably with the United States and the European Union.
China issued two rounds of mining quotas last year, totalling 270,000 metric tons. That output allowance represented a slowdown in annual growth to 5.9 percent, down from a 21.4 percent increase in 2023. Smelting and separation permits for 2024 were also set in two batches, amounting to 254,000 tons, up 4.2 percent on the previous year.
China’s rare earth shipments to the US rebounded in June
In a related development, China’s shipments of rare earths and magnets to America rebounded sharply in June. The General Administration of Customs data shows exports climbed to 353 metric tons, a 660 percent jump compared with May’s 46 tons.
That surge followed late‑June agreements aimed at clearing a backlog of export licences for magnets and rare earths bound for U.S. customers. As part of the same talks, chipmaker Nvidia said it plans to restart sales of its H20 artificial intelligence processors in China.
Earlier this year, Beijing had added several rare earth items and related magnets to its export restriction list in early April, a response to American tariffs. The move stalled shipments in April and May, disrupting supply chains. Some overseas automakers reportedly scaled back production amid the squeeze.
Globally, China exported 3,188 tons of permanent rare earth magnets in June, up 157.5 percent from May’s 1,238 tons. Despite the rebound, June’s total remained 38.1 percent below the 5,158 tons shipped in June 2024.
Market watchers expect exports to climb further in July as more firms secure the necessary licences. Still, for the first half of 2025, China’s magnet exports were down 18.9 percent year‑on‑year, at 22,319 tons.
Your crypto news deserves attention – KEY Difference Wire puts you on 250+ top sites