Ethereum Price Analysis: ETH Reaches Its Biggest Obstacle on the Road to $2K
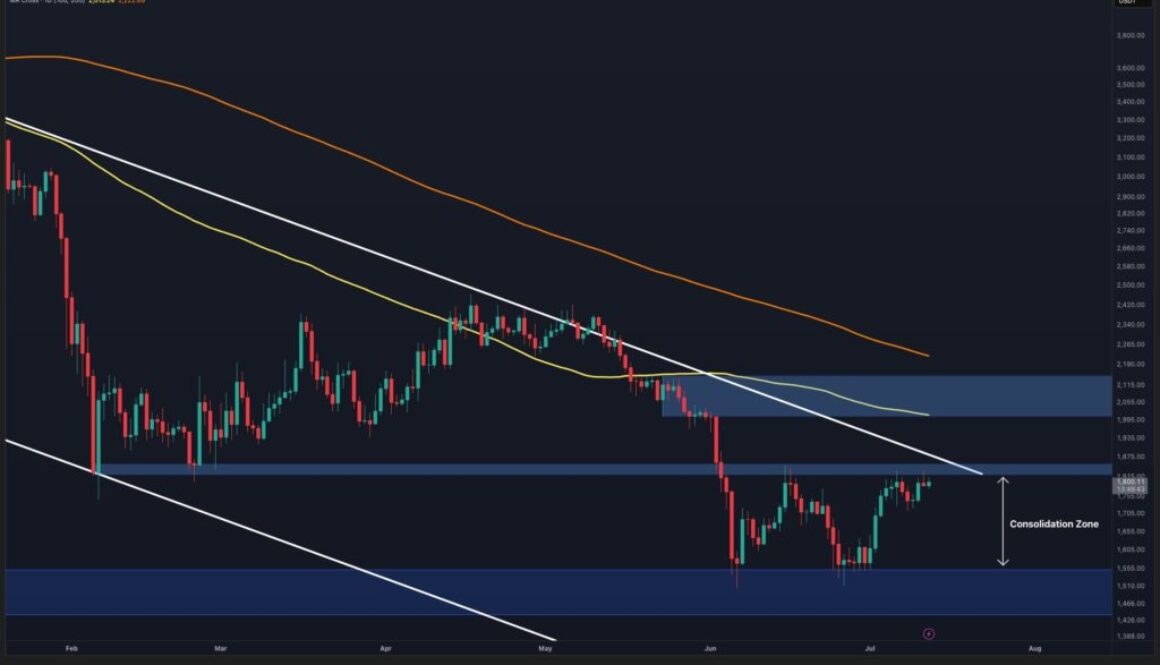
Ethereum is testing a critical resistance barrier at $1.80K-$1.85K that will determine whether the asset can sustain its recovery toward $2K or faces another downward correction. For institutional traders, this inflection point matters because it sits at the intersection of multiple technical obstacles, a descending trendline, horizontal resistance, and concentrated liquidation clusters, making it a high-probability decision point for the next directional move.
- ETH is testing $1.80K-$1.85K resistance after recovering from $1.45K-$1.55K lows, marking a potential break from its descending structure since January.
- The 100-day moving average sits at $2K-$2.1K and the 200-day MA at $2.2K, both still trending downward and capping any sustained rally attempt.
- Short-side liquidation clusters concentrated between $1.95K-$2.1K on Binance suggest the market has priced in seller defense at these exact resistance zones.
- $1.80K-$1.85K Current resistance zone where descending trendline and horizontal support convergence occur
- $2K-$2.1K 100-day moving average level and next major resistance target above current price
- $1.45K-$1.55K Major demand zone from which ETH has recovered to test current resistance levels
Ethereum is at a technical fork in the road. After stabilizing at the $1.45K-$1.55K demand zone in June, the asset has rallied into a confluence of resistance barriers that will likely determine whether institutional buying interest can sustain a move toward $2K or whether profit-taking forces another corrective leg lower.
The $1.80K-$1.85K zone represents the most immediate obstacle because it combines three separate technical signals: a descending trendline that has capped price action since May, a horizontal resistance level that previously acted as support before breaking down, and liquidation clusters that suggest professional traders have positioned for a reversal at this exact price region.
This convergence matters because it reduces ambiguity, the market has a clear yes-or-no question to answer at this level.
Descending Trendline Since January Remains Intact Above Current Rally
ETH has been confined within a descending structure since the beginning of the year, and the current rally, while materially stronger than the June lows, still remains beneath the fundamental trend constraint that has shaped price action for nine months.
The $1.80K-$1.85K resistance zone coincides precisely with the descending trendline that has capped every recovery attempt since May, making it a repeatable technical barrier that the market has respected multiple times already.
For institutional traders monitoring structure, this distinction matters. A recovery rally within a larger downtrend is not the same as a trend reversal. As long as ETH trades below the descending trendline and the $1.80K-$1.85K resistance cluster, any move higher can still be classified as a bounce within the downtrend rather than a fundamental shift in momentum.
Only a decisive breakout above both levels would signal that the downtrend may have exhausted itself and justify a shift in focus toward higher targets.
The broader daily moving average structure reinforces this bearish backdrop.
The 100-day moving average is positioned around $2K-$2.1K and continues to slope downward, while the 200-day MA sits considerably higher near $2.2K. Both averages remain above the current price, meaning that even if ETH breaks above $1.80K-$1.85K, it would still face major headwinds from downward-sloping medium-term momentum indicators before reaching the $2K target that many traders consider the psychological inflection point for a sustained trend change.
Short-Term Strength in 4-Hour Charts Masked by Structural Bearishness on Longer Timeframes
On the 4-hour timeframe, the picture is distinctly more constructive. ETH has established a clear ascending channel since the late-June lows, with price respecting the rising boundaries while consistently forming higher highs and higher lows.
The market has reclaimed the $1.62K-$1.64K demand zone and established a secondary support level around $1.72K-$1.74K that has repeatedly attracted buyers during intraday pullbacks. This structure reflects improving short-term momentum and suggests that institutional accumulation may be occurring within this defined range.
However, this short-term strength exists within the context of longer-term bearishness. The 4-hour rally is now approaching the upper boundary of its ascending channel, which aligns directly with the $1.83K-$1.85K resistance zone where profit-taking and seller activity are likely to emerge. Structurally, ETH remains constructive only as long as it holds above $1.72K-$1.74K support.
A breakdown below this level would signal that the intraday bullish structure has failed and would expose the lower channel boundary and the broader $1.55K support zone that acted as a floor during the June decline.
The tension between 4-hour strength and daily weakness creates the precise kind of environment where institutional traders use technical barriers to manage risk and position sizing.
Liquidation Clusters at $1.95K-$2.1K Define Likely Profit-Taking Zone
The Binance ETH/USDT liquidation heatmap provides a direct window into where professional traders have positioned their capital and where they expect resistance to emerge.
The most significant concentration of short-side liquidity sits above the current market price, with a dense cluster between $1.95K-$2.1K. This zone is not randomly distributed across the price spectrum, it aligns precisely with the daily chart resistance level, the 100-day moving average, and the descending trendline that has constrained the asset all year.
This alignment suggests that institutional traders have priced in a high-probability scenario where ETH encounters meaningful seller defense between $1.95K and $2.1K. The concentration of liquidation clusters in this region is functionally equivalent to a wall of sell orders that has been placed by sophisticated market participants who expect the rally to encounter resistance at these exact levels.
For a trader attempting to push ETH decisively above $2K, this liquidity cluster represents real friction that will require either sustained buying volume or a fundamental shift in market sentiment to overcome.
The liquidation landscape also provides a secondary implication: if ETH does break above the $1.80K-$1.85K initial resistance zone, the next phase of the rally would likely be defined by how it handles the $1.95K-$2.1K liquidation zone.
Success at that level would signal genuine institutional accumulation, while failure could trigger stop-losses that accelerate a move back toward the $1.72K-$1.74K support zone that has held firm during intraday pullbacks.
Path to $2K Requires Breaking Multi-Layered Resistance and Reversing Downward Moving Averages
For ETH to achieve a sustained move toward the $2K target that many traders consider a psychological inflection point, the asset must first overcome multiple sequential obstacles. The immediate hurdle is the $1.80K-$1.85K convergence zone, where the descending trendline, horizontal resistance, and initial liquidation clusters create the first decision point.
Even if that level breaks, the 100-day moving average at $2K-$2.1K remains positioned directly overhead, and the 200-day MA at $2.2K sits significantly higher.
What distinguishes a true trend reversal from a corrective bounce is whether moving averages flatten and reverse upward. Currently, both the 100-day and 200-day MAs continue to slope downward, indicating that the broader momentum structure remains bearish despite the recent recovery.
For institutional traders accustomed to using moving averages as regime indicators, the current downward slope of both medium-term averages signals that the tape is not yet ready for a significant reversal, even if short-term strength persists.
The $2K level matters psychologically and technically, but reaching