We will begin with the mandatory disclaimer, as we are well aware that historical performance does not guarantee similar moves in the future. However, history does tend to rhyme, and that’s what happened in July for BTC.
The question is: will August follow suit, as the month has not been kind to the largest cryptocurrency, especially the last four editions.
July Brought Some Gains
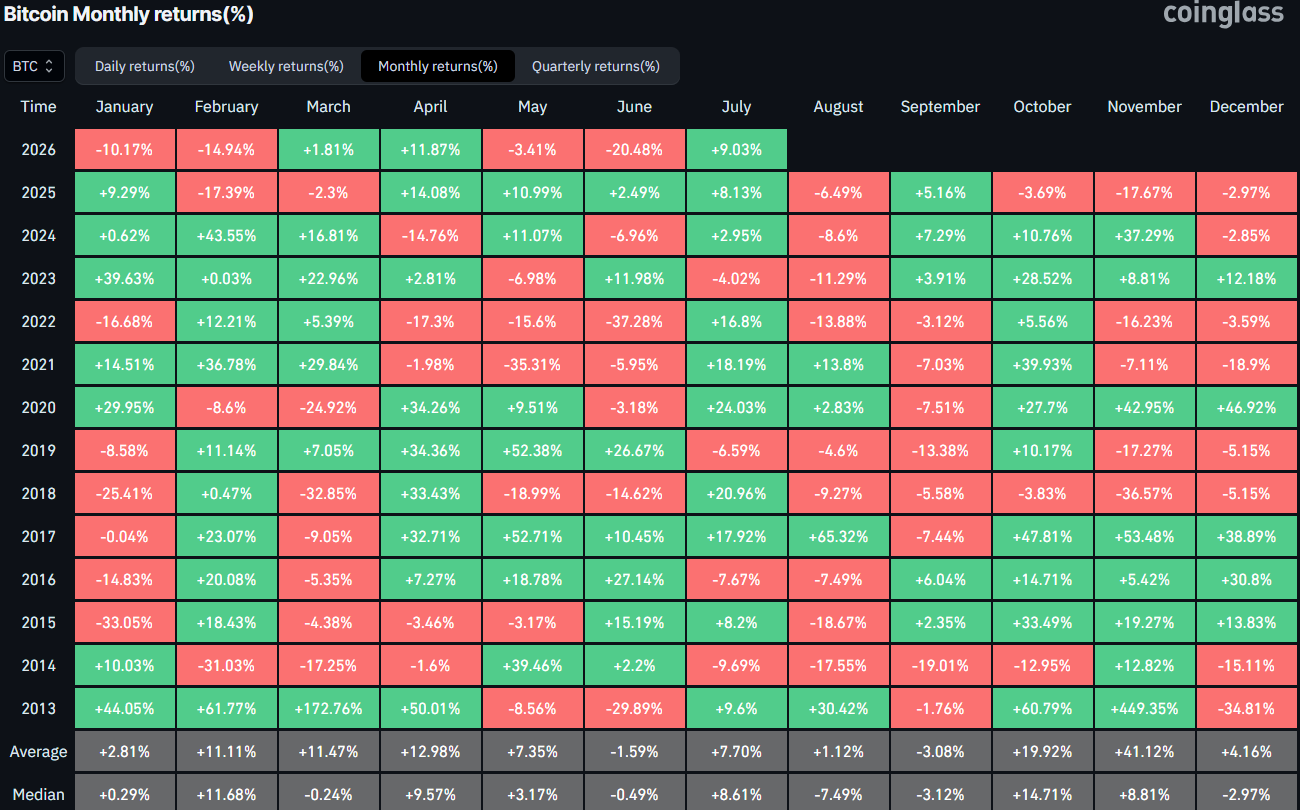
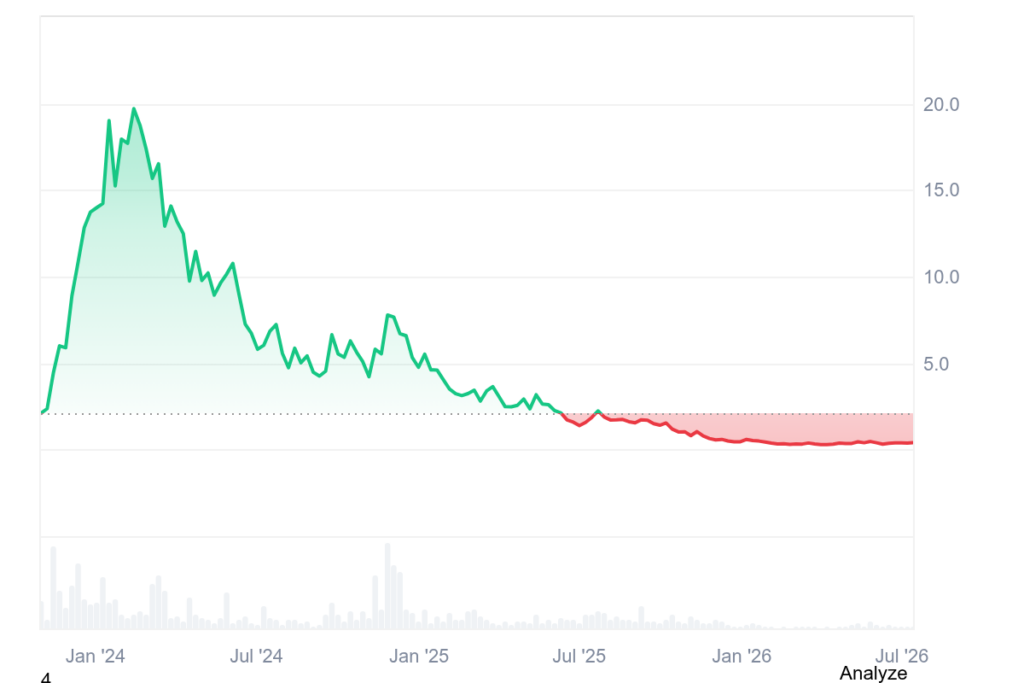
Before we explore what happened in July, here’s a brief outlook of the painful June, which set the stage for a rebound during the seventh month of the year. The 2026 edition of June became the most violent in terms of price moves for the cryptocurrency in precisely four years. It tumbled by 20.48% in 2026 compared to 37.28% in June 2022.
As such, it was almost expected that July would be a better month. History was also on BTC’s side as 9 out of the last 11 were in the green. However, the start was actually quite surprising as bitcoin dipped below $58,000 on July 1 for the first time in nearly two years.
The bears quickly lost control, though, and the asset reclaimed the coveted $60,000 level within a day or two. It wasn’t the most volatile of months, but BTC still managed to post some gains and peaked on July 21 at $67,000. This became its highest price tag in two months.
However, it was rejected there despite the softer-than-expected inflation data for June and the fact that the Fed refused to hike interest rates last week. Thus, bitcoin ended the month at under $64,000, which was still a 9% monthly increase.
Bitcoin Monthly Returns. Source: CoinGlass
Your Move, August
As popular analyst Ali Martinez put it yesterday: August hasn’t been kind to bitcoin. In fact, the last four have all been in the red, posting losses of 13.88%, 11.29%, 8.6%, and 6.49%, respectively. The silver lining is that the declines become less violent over time.
The broader August perspective is still deeply negative, though. Only three out of the last 12 editions have been in the green, with 2017 standing out as the most bullish one on record. At the time, BTC rocketed by over 65%, but it was a different time and a vastly different market phase.
For now, BTC enters August 2026 with lots of uncertainty not only within the industry itself, where interest has dwindled lately, but on a macro perspective as well. The war in the Middle East continues, and the one between Ukraine and Russia too, while inflation remains an issue, and Trump’s controversial actions tend to halt each breakout attempt in its tracks.
Most leading cryptocurrencies have headed south over the past 24 hours, yet Hyperliquid’s HYPE is among the few to defy the latest red wave.
While it has risen by a mere 1.5%, one analyst assumed it might be gearing up for a staggering 40% pump in the near future.
The Necessary Condition
Currently, HYPE trades at around $54.70, placing it above the lower boundary of an important channel depicted by Ali Martinez. He suggested that if the asset holds the $53 level, a move up to $75 is possible. Also speaking on the matter was Altcoin Sherpa, who claimed that HYPE’s current level is “a good spot for a bounce.”
“Expecting huge tradfi trading volumes to come over the next few days too, which helps,” the analyst added.
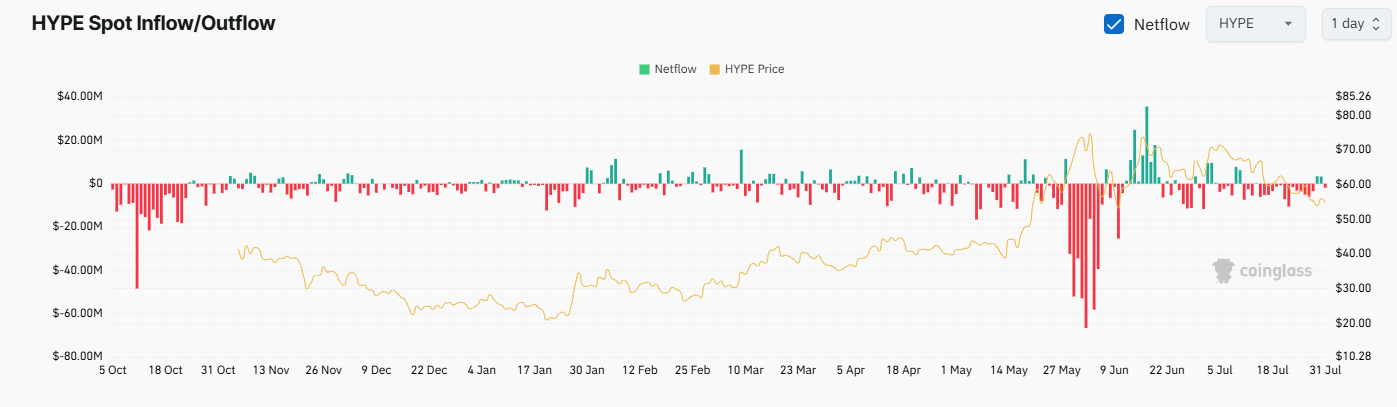
Some on-chain signals also suggest that the asset may post additional gains in the short term. CoinGlass’s data shows that exchange outflows have dominated over inflows in the last several days, meaning that investors have transferred their holdings from centralized platforms to self-custody solutions. This is considered a bullish factor since it reduces the immediate selling pressure.
HYPE Exchange Netflow, Source: CoinGlass
The Bearish Case
The number of pessimists, though, seems even more well-represented. X user Cut recently doubted HYPE’s potential, reminding of its inability to break its all-time high and wondering if its price would make a substantial decline. Ryker joined the discussion, projecting a plunge to $32 “soon.”
Cryptorphic also gave their two cents, arguing that HYPE is showing weakness after losing its long-term trendline and its price has broken below the key ascending support. They believe that if the $57-$58 range turns into resistance, the breakdown could confirm further downside, envisioning a possible crash under $30.
Meanwhile, the whales’ activity reinforces the pessimists’ outlook. Lookonchain disclosed that large investors keep selling HYPE, revealing the case of a market participant who purchased over one million tokens at an average price of $18 17 months ago and unstaked and deposited the stash into FalconX and Coinbase, perhaps with the intention to cash out.
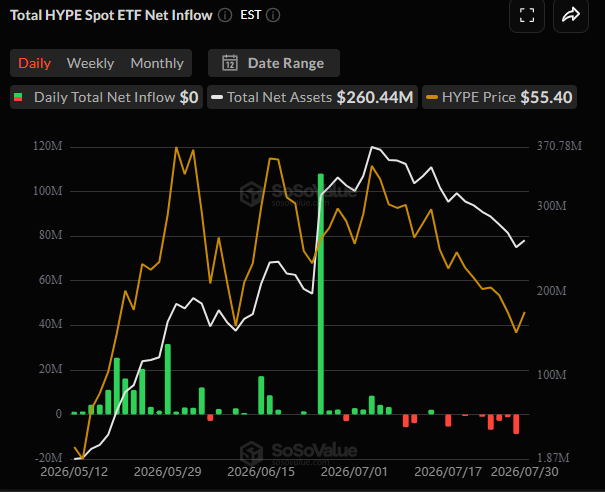
The waning institutional interest adds more weight to the bearish perspective. Spot HYPE ETFs, which attracted substantial capital in June, have not appealed to pension funds, hedge funds, and other conservative investors during most days of July, with outflows significantly dwarfing inflows.
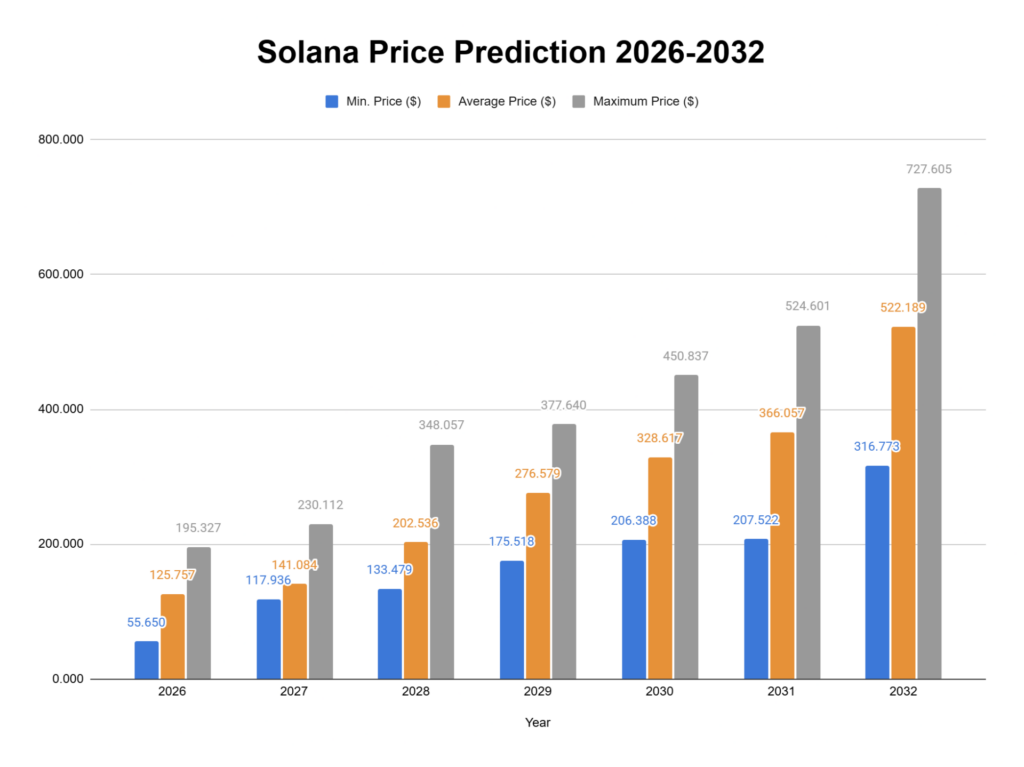
Our predictions show that SOL will achieve a high of $195.327 in 2026.
In 2029, it will range between $175.518 and $377.640, with an average price of $276.579.
By 2032, SOL is expected to trade between $316.773 and $727.605, with an average price of $522.189.
Despite occasional challenges for the Solana network ecosystem, including network congestion and competition from other blockchain platforms, the current sentiment shows that Solana demonstrates resilience and adaptability, despite the current price fluctuations, positioning itself as a leading player in the decentralized finance (DeFi) and Web3 landscape.
Overall, the prevailing sentiment regarding the current Solana price within the Solana community reflects the current sentiment of confidence and excitement among investors, driven by the growing interest in Solana with stakeholders eagerly anticipating the platform’s continued evolution and impact on the broader crypto ecosystem.
While uncertainties persist, Solana’s innovative approach, along with its low transaction fees and robust infrastructure instill optimism for its future price action, as indicated by the technical factors and technical analysis. In this article, we’ll explore Solana price prediction and market dominance, particularly when evaluated against momentum indicators. This brings the question “How high can SOL go in 2026 and beyond?” and we’ll try to answer that.
Overview
Cryptocurrency
Solana
Token
SOL
Price
$73.29(-1.85%)
Market Cap
$42.5 Billion
Trading Volume (24-hour)
$1.65 Billion
Circulating Supply
579.7 Million SOL
All-time High
$294.33 Jan 19, 2025
All-time Low
$0.5052, May 11, 2020
24-hour High
$75.11
24-hour Low
$72.81
Solana price prediction: Technical analysis
Market Sentiment
Bullish
50-Day SMA
$81.38
200-Day SMA
$100.29
Price Prediction
$82 (+5%)
Fear & Greed Index
28 (Fear)
Green Days
15/30 (50%)
14-Day RSI
62.91 (Neutral)
Solana price analysis: SOL falls to $73
TL;DR Breakdown:
Solana price analysis shows bearish pressure as SOL falls to $73
The altcoin lost 1.85% of its value in last 24-hours.
Support for SOL/USD is at $73
Today, on July 31, the Solana price analysis reveals bearish momentum as the price falls to the $73 mark.
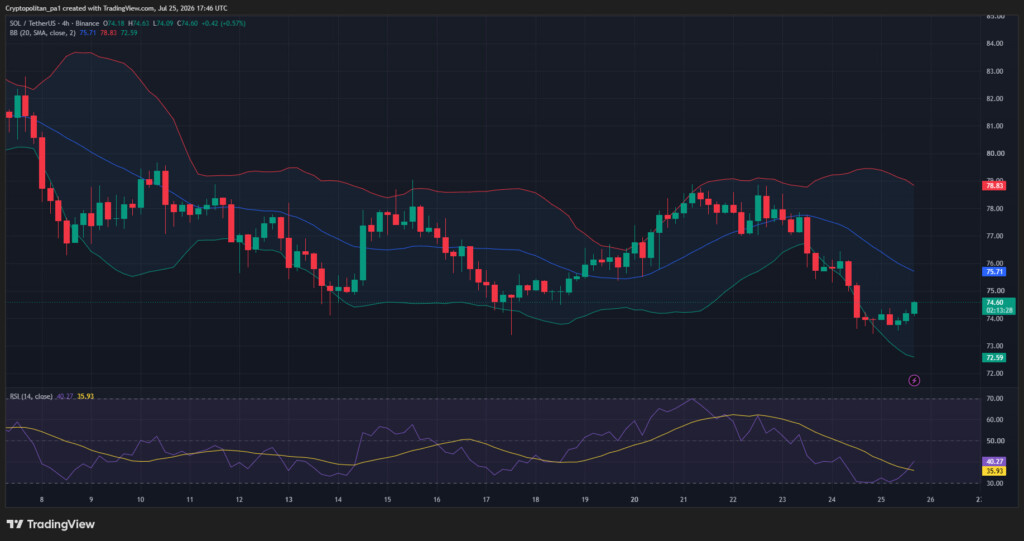
Solana price analysis 1-day chart: SOL falls to $73
The daily price chart shows a slow decline to the $73 mark where SOL finds short term support.
The distance between the Bollinger Bands defines the intensity of volatility. This distance between high and low bands is narrow, leading to increased volatility. Moving ahead, the upper limit of the Bollinger Bands indicator, acting as the resistance band, has shifted to $80.89. The indicator’s mean line, which shows a support level, has shifted to $72.60.
The Relative Strength Index (RSI) indicator is trading in the neutral region. The indicator’s value has increased to 78.80 in the last candle, and its curve suggests bearish market sentiment at the level. If buying activities continue to intensify, further volatility in the market can be expected. However, the short-term indicators suggests a further decline
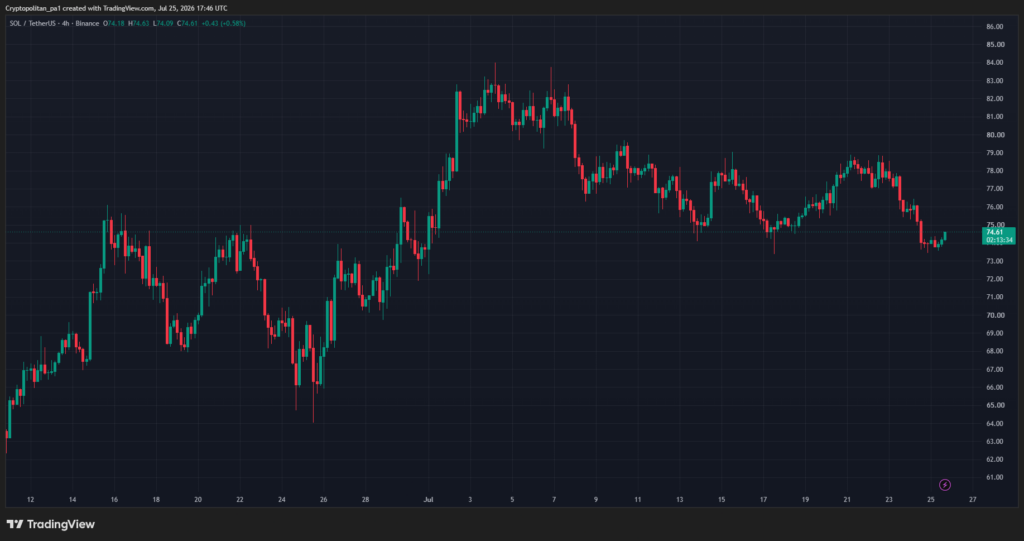
SOL/USD 4-hour price chart
The four-hour price analysis of the Solana shows the price observes bullish momentum in recent hours as price finds support at $73.
The Bollinger Bands are wide and show divergence, hinting at a falling volatility level. This level of volatility signifies decreased market unpredictability. Moving forward, the upper Bollinger Band has shifted to $74.94, securing the resistance point. Conversely, the lower Bollinger Band has moved to $72.71, indicating support.
The RSI indicator is in the overbought region. Currently at 43.91, the RSI’s position is showing bullish sentiment. The level of the index suggests low momentum with room for volatile movement across the short-term. The current slope suggests bullish pressure but we can only expect a rise back to the $79 mark if the bullish momentum is able to hold past $74.
The Solana price analysis suggests a bearish prediction based on ongoing market events for the day. The SOL/USD pair fell to the $73 mark from the highs of $79. SOL then recovered to $73.3 mark where it trades at press time.
Is SOL a good investment?
Solana is a high-performance blockchain platform known for its robust scalability and speed due to various technological advancements, particularly in the crypto space boasting a substantial Total Value Locked (TVL). The network continues to hit key development milestones. Despite a challenging month, price predictions indicate a more positive outlook, suggesting the potential for Solana’s growth and future growth.
Why is SOL down?
Solana failed to establish support at $75 and higher levels and the resulting breakdown caused a decline o $73 where it finds short-term support.
What is Solana going to be worth in 2026?
The Solana (SOL) price prediction for 2026 suggests a minimum value of $83.93 with an average price of $115.48, driven by fundamental factors in the market. The price could reach a maximum of $179.36 during the year.
Will SOL reach $1,000?
The price forecasts indicate that SOL could reach the $1000 mark by mid 2030s, influenced by trends in the broader crypto market. Given the bullish scenario and the projected positive market sentiment and growth trend, SOL might reach $1,000 within the next five years.
Can Solana reach $5,000?
Reaching $5,000 is plausible but would likely take several years beyond the current forecast period. However, a snowball in the asset’s adoption might bring the moment sooner.
Does SOL have a good long-term future?
Yes, Solana has a good long-term future, with a promising market capitalization and exciting potential ROI due to its high scalability, which makes Solana an attractive investment. Its growing adoption, strong developer community, and strategic partnerships further enhance Solana’s forecast of its potential for sustained growth.
Recent news/updates on Solana
Securitize is bringing its own stock onchain on Solana. The stock available on the New York Stock Exchange will be tokenized and available globally to Solana users
BREAKING: Securitize is bringing its own stock onchain on Solana.
The same $SECZ common stock listing on the NYSE. Issuer-sponsored, tokenized, available globally and to eligible US investors on day one. Live only on Solana. pic.twitter.com/4247WrQOo4
The SOL price prediction 2026 for July suggests a range of outcomes based on current market trends, greed index, and analysis. The forecast anticipates SOL to fluctuate between a minimum of $59.32 and an average of $81.99, and potentially attain a maximum of $98.25.
Month
Minimum Price ($)
Average Price ($)
Maximum Price ($)
July
59.32
81.99
98.25
Solana Price Prediction 2026
Solana (SOL) is predicted to reach a minimum of $55.65 in 2026. Experts suggest that future price movements indicate the coin could climb to a maximum of $217.03, with an average price around $139.73.
Year
Min. Price ($)
Average Price ($)
Maximum Price ($)
2026
55.65
139.73
217.03
Solana (SOL) price prediction 2027-2032
Year
Min. Price ($)
Average Price ($)
Maximum Price ($)
2027
117.936
141.084
230.112
2028
133.479
202.536
348.057
2029
175.518
276.579
377.640
2030
206.388
328.617
450.837
2031
207.522
366.057
524.601
2032
316.773
522.189
727.605
Solana Price Prediction 2027
In 2027, Solana’s price is forecast to trade at a minimum of $117.936, reflecting the continued growth of the Solana blockchain. The coin could reach a maximum value of $230.112, with an average trading price of $141.084.
Solana Price Prediction 2028
If bullish momentum continues into 2028, SOL may record a minimum price of $133.479, a maximum of $348.057, and an expected average of $202.536.
Solana Price Prediction 2029
Analysis indicates that Solana could maintain its upward trajectory in 2029, with the price potentially hitting a minimum of $175.518, a maximum of $377.640, and an average of $276.579.
Solana Price Prediction 2030
Based on projections for 2030, Solana may trade at a minimum of $206.388, with an average price of around $328.617 and a possible peak of $450.837.
Solana Price Prediction 2031
Solana’s price is expected to reach a minimum of $207.522 in 2031. Analysts forecast a maximum value of $524.601 and an average trading price of $366.057.
Solana Price Prediction 2032
In 2032, Solana is projected to trade at a minimum of $316.773, with an average price of $522.189, while the maximum price could reach $727.605 if favorable market conditions persist.
Solana price prediction 2027-2032
Solana market price prediction: Analysts’ SOL price forecast
FirmName
2026
2027
Changelly
$167
$248.
DigitalCoinPrice
$132.89
$162.57
Cryptopolitan’s Solana (SOL) price prediction
Our predictions show that SOL will achieve a high of $195.327 in 2026. In 2029, it will range between $175.518 and $377.640, with an average price of $276.579. By 2032, SOL is expected to trade between $316.773 and $727.605, with an average price of $522.189.
However, it is advised to do your own research and conduct expert opinion before investing in the volatile crypto market.
Solana (SOL) historic price sentiment
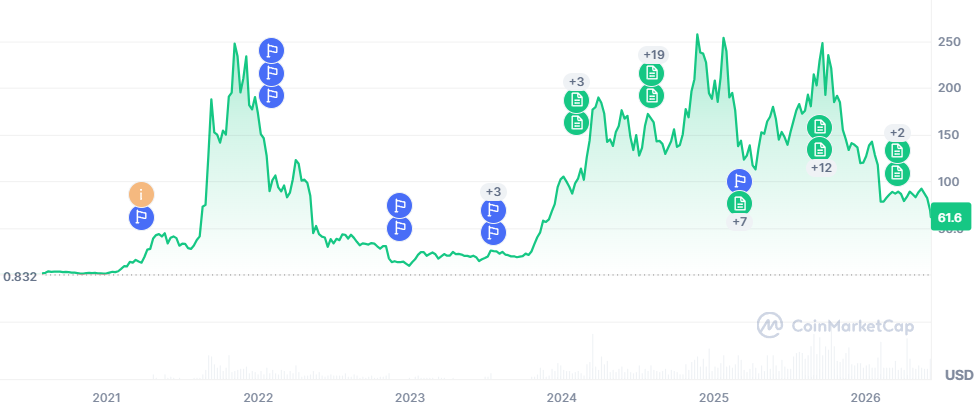
Solana Price History
Solana was launched in April 2020 and has gained popularity over the last 18 months. Its price surged from $0.75 to a high of $214.96 in early September.
Following NFT hype and growing demand in the DeFi community, the cryptocurrency Solana (SOL) price more than tripled during the summer of 2021. Solana (SOL) token became the fastest-growing cryptocurrency and is currently ranked fifth with a live market cap of nearly $66 billion.
2022 saw Solana leap to its all-time high of $260, but SOL failed to close the year anywhere near that high, as the price came crashing down to below $40 by June. The bearish markets were marked by high skepticism as trading volumes declined throughout the crypto markets.
The price continued to trade below the $40 level until November 2023, when Solana gained momentum and started a bullish rally again to close the year at $101.84.
In 2024, Solana (SOL) saw significant growth, with its price rising from $83.62 in January to a high of $202.87, fueled by its dominance in DeFi, NFTs, and decentralized exchanges. However, the price fluctuated through the year, retracing to $131 in September after struggling to maintain key levels.
October brought a positive rebound as SOL rose from $152 to close at $167, but early November started bearish, with the price dipping to $160.
However, Solana bounced back sharply and closed the month above the $230 mark. December, on the other hand, has observed a slow start as price volatility remains low.
Solana’s (SOL) price rose significantly in January 2025 from below the $190 level to close the month above $210. However, the latter half of the month saw the price decline from the $230 mark, a trend that continued through February ending the month below $150.
In March the price continued falling as the bears continued dominating the short to mid term markets ending the month below $125. In April the bearish rally has only continued as the price falls towards $100. However, the bulls bounced back in the middle of the month and ended the month around $150.
In May the price continued to rise and ended the month above the $165 price level, a trend that could not extend through June as the month saw a decline falling below the $150 price level to end the month.
July saw a sharp rise to the asset’s volatility with SOL crossing the $200 mark. However, the price could not be maintained and SOL ended the month below the $180 level. In August, on the other hand, SOL made strides and managed to close the month above the $205 mark.
In September, the volatility rose sharply as the price rose to the $250 price level but failed to maintain the level and ended the month at $230. In October, the decline increased sharply as SOL ended the month below $170. In November, and December the decline continued with SOL ending the year at the $125 mark.
In January, the trend continued with Solana crashing towards the $100 mark during the period. In February the decline continued as SOL declined below the $80 mark near the end of the month. In March, the trend continued for the first half but later made some recovery ending the month around the $78 mark.
In April, SOL saw volatility as price spiked to the $90 mark but ended up closing the month around the $83 mark. In May, the price recovered initially but declined again to end the month around the $80 mark.
In June, the trend continued with SOL ending the month around the $73 mark.
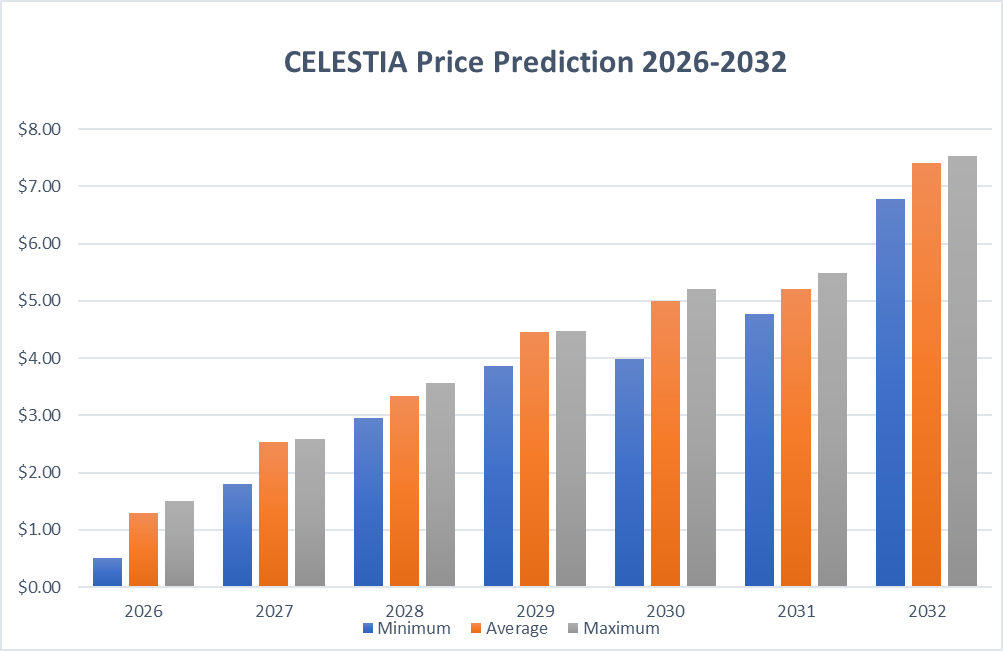
The Celestia price prediction for 2026 suggests a maximum price of $1.5.
By 2029, TIA could attain a maximum price of $4.48.
In 2032, the TIA price forecast expects a maximum price of $7.53.
Celestia generated significant interest before its October 2023 launch. This was largely due to the strong backing from major crypto exchanges from the outset and the intriguing technical concepts behind the Celestia modular blockchain network.
In this article, we’ll provide a Celestia price prediction, analyze the factors driving these projections, and explore what the Celestia modular blockchain network brings to the broader crypto landscape.
Overview
Cryptocurrency
Celestia
Token
TIA
Price
$0.31 (-4%)
Market cap
$289 million
Trading volume (24-hour)
$26 Million
Circulating supply
889 Million TIA
All-time high
$20.91; Feb 10, 2024
All-time low
$0.3166; Oct 11, 2025
24-hour high
$0.332
24-hour low
$0.309
TIA price prediction: Technical analysis
Metric
Value
Current Price
$0.31
Price Prediction
$ 0.3044 (-1.35%)
Fear & Greed Index
26 (Fear)
Sentiment
Neutral
Volatility
5.59% (High)
Green Days
16/30 (53%)
50-Day SMA
$ 0.3776
200-Day SMA
$ 0.3848
14-Day RSI
58.67 (Neutral)
TIA price analysis: TIA price faces bearish pressure toward $0.31
TIA price analysis shows bearish pressure toward $0.31
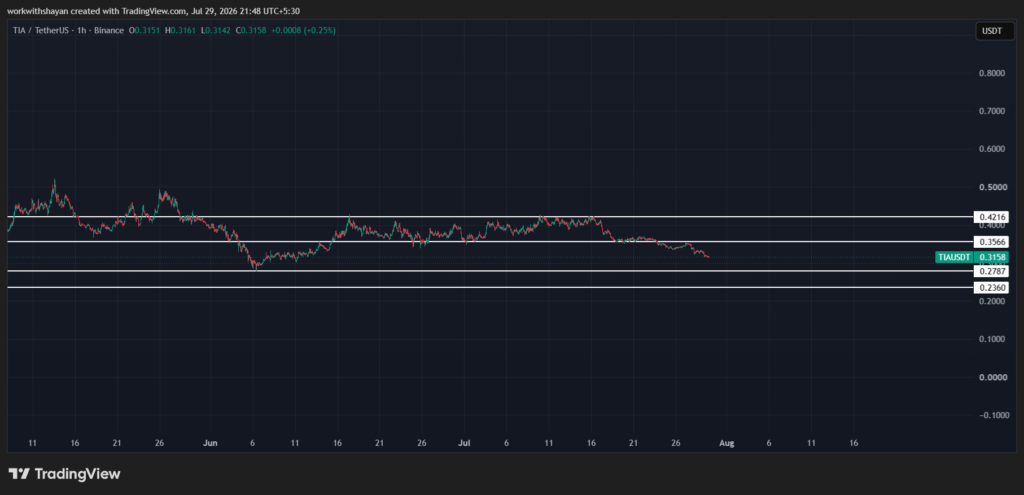
Resistance for TIA is present at $0.3566
Support for TIA/USD is present at $0.2787
The TIA price analysis for 29 July confirms that TIA is witnessing bearish volatility toward the $0.31 level. Currently, sellers are controlling the price chart as they push the price toward support channels.
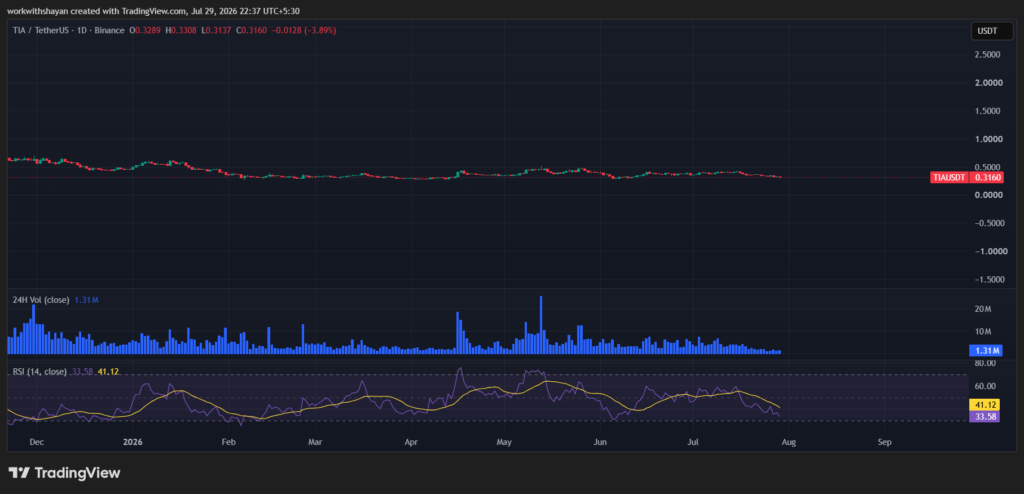
TIA price analysis 1-day chart: TIA price faces selling pressure toward $0.31
Analyzing the daily Celestia price chart, TIA price is facing rising selling momentum as sellers pushed the price toward $0.31 level. The recent selling pressure triggered strong liquidation among buyers today. The 24-hour volume surged to $1.31 million, showing a slight increase in trading activity today. TIA is trading at $0.31, declining by over 4% in the last 24 hours.
The RSI-14 trend line has dropped from its previous level and hovers around 33-level, showing that sellers are controlling the momentum. The SMA-14 level suggests lower volatility for the next few hours.
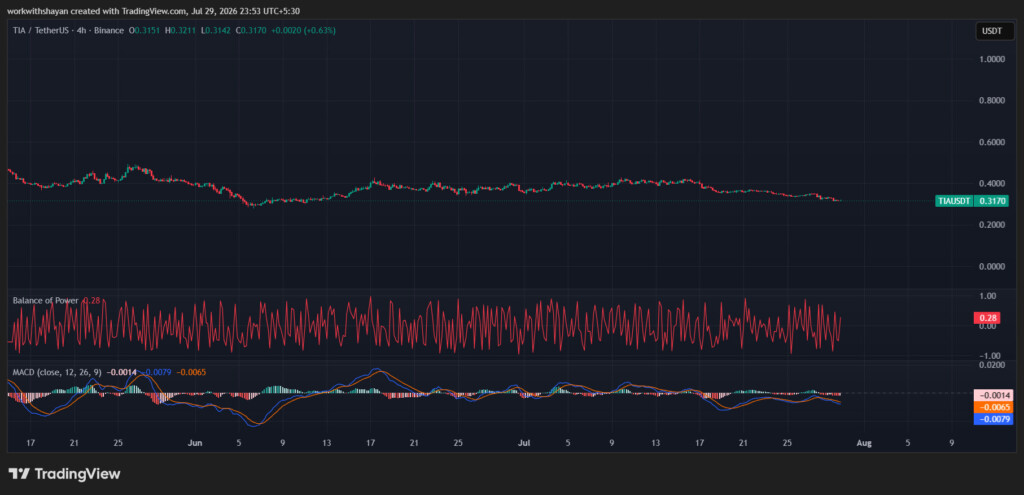
TIA/USD 4-hour price chart: Bears aim for a hold below moving averages
The 4-hour TIA price chart suggests TIA continues to experience bullish volatility around $0.31, creating a positive sentiment on the price chart. Currently, bears aim for a strong domination as the price prepares for a hold below EMA lines.
The BoP indicator is bullish at 0.28, suggesting that buyers are trying to build pressure near resistance levels and boost upward correction.
However, the MACD trend line has formed red candles above the signal line, and the indicator aims for positive momentum, strengthening buying positions.
Celestia price prediction: Levels and action
Daily simple moving average (SMA)
Period
Value
Action
SMA 3
$ 0.4022
BUY
SMA 5
$ 0.3935
BUY
SMA 10
$ 0.3881
BUY
SMA 21
$ 0.3800
BUY
SMA 50
$ 0.3771
BUY
SMA 100
$ 0.3717
BUY
SMA 200
$ 0.3846
BUY
Daily exponential moving average (EMA)
Period
Value
Action
EMA 3
$ 0.3993
BUY
EMA 5
$ 0.3964
BUY
EMA 10
$ 0.3905
BUY
EMA 21
$ 0.3829
BUY
EMA 50
$ 0.3779
BUY
EMA 100
$ 0.3851
BUY
EMA 200
$ 0.5113
SELL
What to expect from TIA price analysis next?
The hourly price chart confirms that bears are making efforts to prevent TIA prices from an immediate surge. However, if the TIA price successfully breaks above $0.3566, it may surge higher and touch the resistance at $0.4216.
If bulls cannot initiate a surge, the TIA price may drop below the immediate support line at $0.2787, resulting in a correction to $0.2360.
Is TIA a good investment?
Celestia and modular rollups enhance Ethereum‘s performance and expansion, impacting the competition among L1 public chains. Public chains like BNB Chain and Celo opt to integrate with Ethereum as L2 Rollups due to liquidity and cost advantages. Celestia’s scalability and user-friendly design make it an appealing choice for developers, offering additional scalability to the blockchain ecosystem.
Why is the TIA price down today?
TIA’s price is attempting to hold below $0.31 as sellers gain confidence, resulting in a downward push.
Will the TIA price reach $100?
Depending on the current market sentiment and buying demand, we might see TIA’s price touching the $100 milestone in the coming years. According to our prediction, the TIA price might hit the $100 mark in 2030.
Will the TIA price reach $1,000?
If the altcoin market remains robust in the coming years and Celestia develops more user-friendly utilities, its price might surpass $1K.
Is TIA a good long-term investment?
Yes, TIA is a good long-term investment option. As buyers’ interest grows and the network expands, we might see profitable returns. It is advised to do your own research and conduct investment advice before investing in the volatile crypto market.
Recent news/opinions on TIA
Celestia successfully completed its v9.0.4 network upgrade on July 1, with exchanges briefly pausing deposits and withdrawals while trading continued uninterrupted.
Celestia price prediction July 2026
The crypto market has been surging over the last few weeks, with BTC price aiming for $70K now. In July, we expect the TIA price to record a minimum of $0.3 and a maximum of $0.5, with an average of $0.4 in July.
Celestia Price Prediction
Potential Low
Potential Average
Potential High
Celestia Price Prediction July 2026
$0.3
$0.4
$0.5
Celestia price prediction 2026
Considering the current adoption of the crypto market and strong institutional interest, Celestia network might experience a growing adoption of modular blockchain technology. Hence, the outlook appears positive for the year ahead.
Based on a deep technical analysis of past TIA price data, the price of Celestia is predicted to reach a minimum level of $0.2, a potential maximum of $1.5, and an average trading price of $1.3 in 2026.
Celestia Price Prediction
Potential Low
Potential Average
Potential High
Celestia Price Prediction 2026
0.2
1.3
1.5
Celestia price prediction 2027-2032
Year
Minimum Price ($)
Average Price ($)
Maximum Price ($)
2027
1.8
2.54
2.59
2028
2.96
3.33
3.57
2029
3.87
4.46
4.48
2030
3.98
4.99
5.2
2031
4.77
5.2
5.48
2032
6.78
7.41
7.53
Celestia price prediction for 2027
According to price forecast and technical analysis, Celestia’s price is forecasted to range from a minimum of $1.8 to a maximum of $2.59 in 2027, with an average trading price of $2.54.
Celestia price prediction 2028
Based on deep technical analysis, the price of Celestia in 2028 is forecasted to range from a minimum of $2.96 to a maximum of $3.57, with an average trading value of $3.33.
Celestia price prediction 2029
The price of Celestia is forecasted to reach a minimum level of $3.87 in 2029. Additionally, the TIA price could reach a maximum level of $4.48, with an average forecast price of $4.46.
Celestia price prediction 2030
In 2030, the price of Celestia is predicted to range from a minimum of $3.98 to a maximum of $5.2, with an average trading price of $4.99.
Celestia (TIA) price prediction 2031
According to the forecast and technical analysis, the price of Celestia in 2031 is expected to range from a minimum of $4.77 to a maximum of $5.48, with an average value of $5.20.
Celestia price prediction 2032
In 2032, the price of Celestia is predicted to range from a minimum of $6.78 to a maximum of $7.53, with an average trading price of $7.41.
TIA price predictions 2026-2032
Celestia price prediction: Analysts’ TIA price forecast
Firm Name
2026
2027
Coincodex
$1.68
$1.38
DigitalCoinPrice
$1.06
$1.5
Cryptopolitan’s Celestia (TIA) price prediction
Based on recent market fluctuations and community hype, our analysis of TIA’s upcoming price targets is bullish. Based on a deep technical analysis of past TIA price data, the price of Celestia is predicted to reach a minimum level of $0.2, a potential maximum of $1.5, and an average trading price of $1.3 in 2026.
Celestia (TIA) historic price sentiment
Celestia price history
Token entered the market on October 31, 2023, at $2.10.
Entered the bullish phase on November 10 and peaked at $7.38 on November 18.
The price declined due to Binance’s fine news, hitting $5.30 by November 27.
Reached an all-time high of $15.14 on December 24.
Closed the year at $11.86.
Dropped to $16.23 on March 11, 2024.
Over the last few weeks in May, the price has declined below $10. However, due to Bitcoin’s robust comeback, TIA’s price recently regained the $10 mark.
TIA price declined steeply following Bitcoin’s decline toward $50K in June and recent days of July. This plunged the TIA price below $5.
In recent weeks of August, the price of TIA has been declining heavily, dropping below $4.2.
In September and October, the price of TIA witnessed massive fluctuation as it hovered between $3.5 and $6.8.
In November, the price of TIA faced increasing buying demand as its price got pushed toward $9.
In December, the price of TIA declined heavily as it closed 2024 below $5.
In January of 2025, TIA price dropped further as it recorded a low near $3.8.
In February, TIA crashed further and reached a low at around $2.3.
In March, the price of TIA again faced a correction and dropped toward $2.8; however, it later recovered.
By the end of April, the price of TIA surged toward $3. In May, TIA surged toward $3.4 but failed to maintain momentum.
As a result, the price dropped toward $2 in early June. By the end of June, TIA price declined toward $1.3.
In July, the price of TIA surged toward $2.3 but declined later toward $1.6 in early August.
By the end of August, TIA price declined below $1.5. In September’s end, the price of TIA continued to consolidate below $1.5.
In September, the price of TIA dropped significantly and touched a low below $1 in early November.
By the end of November, TIA dropped toward $0.6.
TIA price ended December 2025 at $0.45. However, its price made a surge toward $0.6 in early January of 2026.
In February, the price of TIA dropped heavily and touched a low around $0.3. By the end of March, TIA hovered around $0.3.
In April, TIA price surged toward $0.43. In May, TIA dropped toward $0.4. By the end of June, TIA hovered around $0.35.
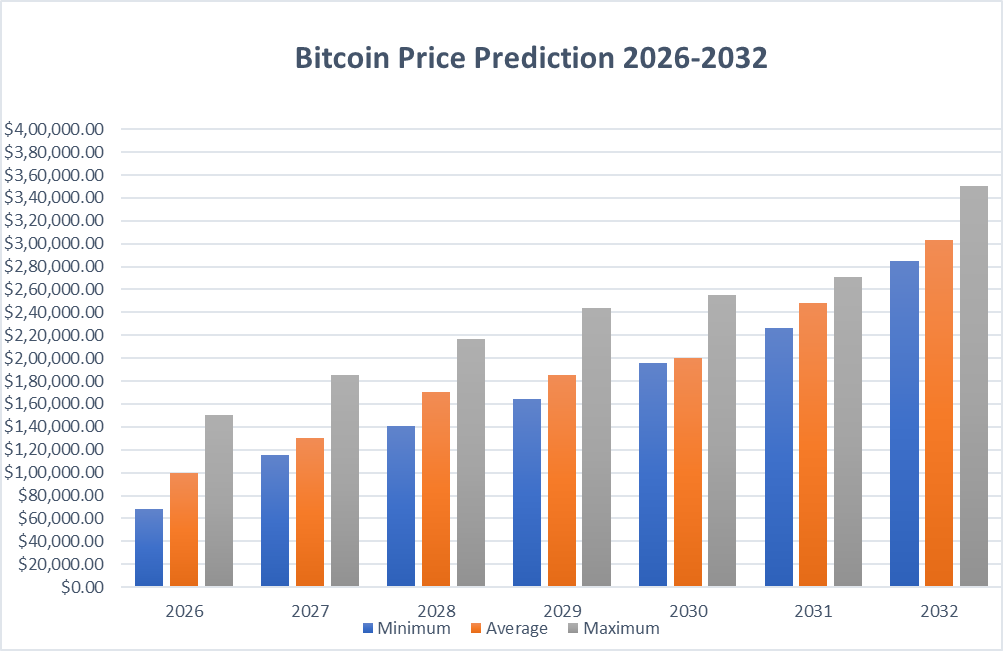
Our Bitcoin price prediction expects BTC’s price to reach $150K by the end of 2026 due to the bullish sentiment following the halving event.
By 2032, BTC might touch $350,548 following increased institutional adoption.
Bitcoin’s outlook for 2026 has become highly debated. The approval of spot Bitcoin ETFs and the rally after the halving were expected to bring more clarity, but instead they’ve brought mixed volatility in Bitcoin price forecast.
However, top analysts are bullish on BTC price prediction this year. Charles Hoskinson, the founder of Cardano, has predicted that Bitcoin could reach about $250,000 by 2026. He bases this view on Bitcoin’s limited supply and the possibility that institutions and major companies will continue to adopt it. Investor and author Robert Kiyosaki has made a similar prediction, arguing that Bitcoin’s scarcity makes it a strong store of value in a world where traditional currencies are becoming less stable.
As Bitcoin’s on-chain activities surge, questions arise, such as: “Does Bitcoin have the potential to hold above the $100K mark?” or “Will Bitcoin go up?” or “Where will Bitcoin be in 5 years?” Let’s answer them using our Bitcoin price prediction 2026 model.
Overview
Cryptocurrency
Bitcoin
Ticker
BTC
Price
$64,962 (+0.5%)
Market capitalization
$1.42 Trillion
Trading volume (24-hour)
$52.53 Billion (+7%)
Circulating supply
20 Million BTC
All-time high
$124,457; August 14, 2025
All-time low
$0.04865; Jul 15, 2010
24-hour high
$65,621
24-hour low
$64,744
Bitcoin price prediction: Technical analysis
Metric
Value
Current Price
$64,962
Price Prediction
$ 67,003 (+1.61%)
Fear & Greed Index
19 (Extreme Fear)
Sentiment
Bearish
Volatility
3.25% (Medium)
Green Days
12/30 (40%)
50-Day SMA
$ 67,794
200-Day SMA
$ 75,112
14-Day RSI
43.82 (Neutral)
Bitcoin price analysis
TL;DR Breakdown:
BTC price analysis shows that buyers are pushing the price toward $65K
Resistance for BTC is at $65,569
Support for BTC/USD is at $64,405
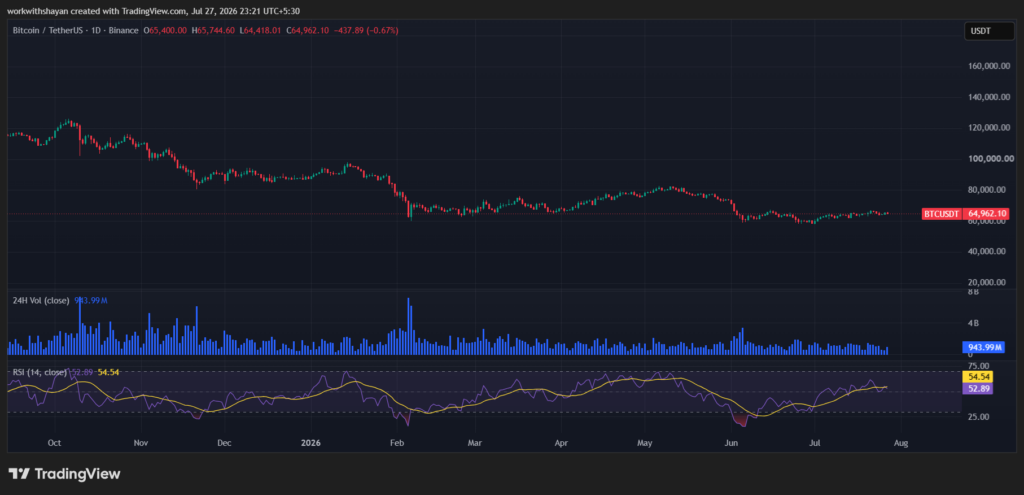
The BTC price analysis for 27 July confirms that BTC faces buying pressure as BTC surges toward $65K. Currently, the Bitcoin price is aiming to hold above $65K.
Analyzing the daily Bitcoin price chart, we see that Bitcoin faces bullish pressure as it surges toward $65K. Currently, the BTC price is facing short-liquidation around immediate resistance channels. The 24-hour volume has surged to $943 million, showing a surge in trading interest today. BTC is trading at $64,962, surging by over 0.5% in the last 24 hours.
The RSI-14 trend line hovers around 53, hinting that a strong bullish pressure is on the way. The SMA-14 level suggests volatility in the next few hours.
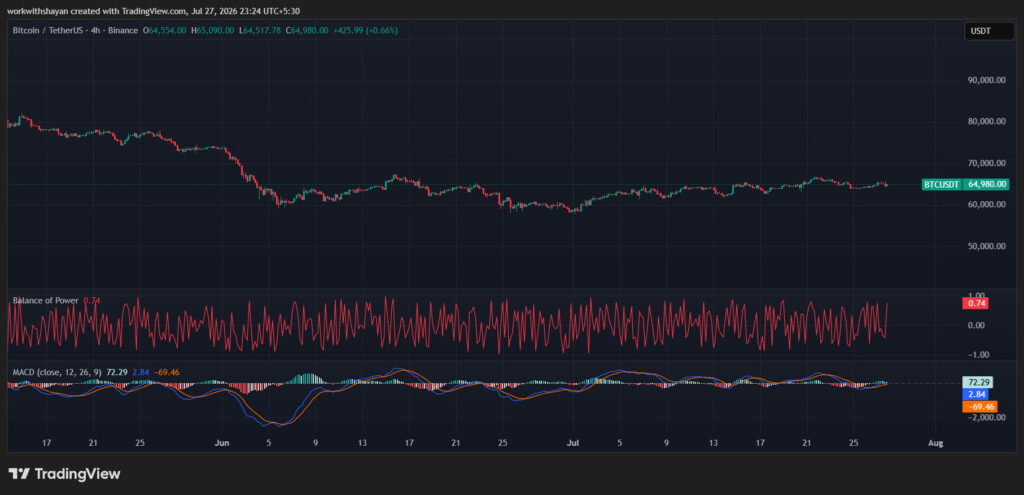
BTC/USD 4-hour price chart: Selling domination rises around EMA trend lines
The 4-hour Bitcoin price chart suggests that sellers are strengthening their position to hold the price below the EMA trend lines. Currently, sellers are strongly defending a recovery.
The BoP indicator trades in a positive region at 0.74, showing that short-term buyers are taking a chance to accelerate an upward trend.
Additionally, the MACD indicator has formed green candles above the signal line and the indicator aims for positive momentum, strengthening long-position holders’ confidence.
Bitcoin technical indicators: Levels and action
Daily simple moving average (SMA)
Period
Value
Action
SMA 3
$ 60,096
BUY
SMA 5
$ 60,036
BUY
SMA 10
$ 60,393
BUY
SMA 21
$ 62,482
SELL
SMA 50
$ 67,794
SELL
SMA 100
$ 71,181
SELL
SMA 200
$ 75,112
SELL
Daily exponential moving average (EMA)
Period
Value
Action
EMA 3
$ 60,652
BUY
EMA 5
$ 60,448
BUY
EMA 10
$ 60,800
BUY
EMA 21
$ 62,305
SELL
EMA 50
$ 66,195
SELL
EMA 100
$ 69,980
SELL
EMA 200
$ 76,481
SELL
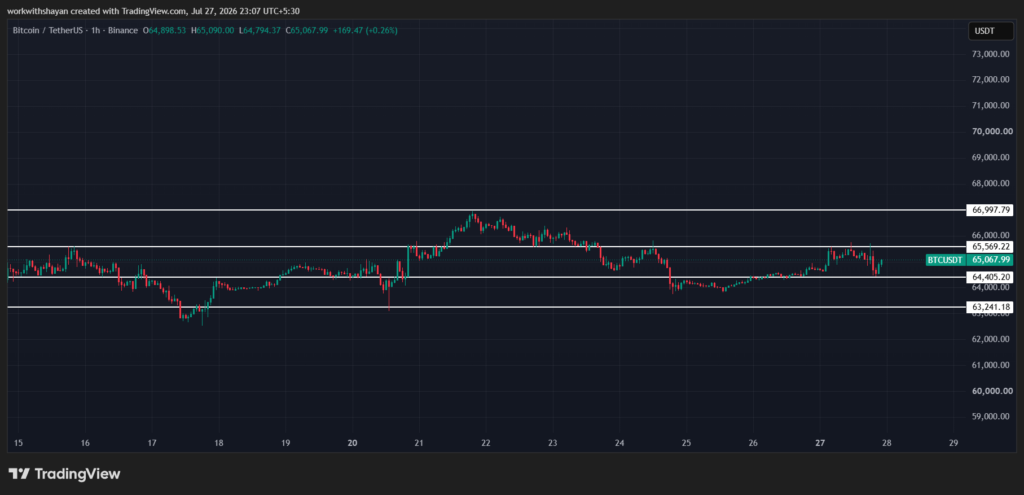
What to expect from BTC price analysis next?
The hourly price chart confirms that Bitcoin is attempting to drop below the immediate support line; however, bulls are eyeing a recovery rally in the coming hours. If BTC’s price holds momentum above $65,569, it will fuel a bullish rally to $66,997.
If bulls fail to initiate a surge, the BTC price may drop below the immediate support line at $64,405, beginning a bearish trend to $63,241.
Is Bitcoin a good investment?
The rising institutional demand for Bitcoin etfs makes it a good investment option in the crypto market. However, Bitcoin has a short investment history filled with very volatile market value. Whether it is a good investment depends on your financial profile, investment portfolio, risk tolerance, and investment goals. It is suggested to conduct investment advice of the financial markets and understand the financial system risks.
Why is Bitcoin up today?
Bitcoin faced a surge in buying pressure as buyers pushed the price above immediate fib levels around $66K.
Will the BTC price reach $100K?
Bitcoin price broke its much-anticipated mark of $100K, aiming for a new ATH. The price currently prepares to maintain its buying demand above $100K.
Will BTC reach $1 million?
$1 million is a significant milestone for the BTC price. However, it is achievable if Bitcoin continues to attract institutional interest in the coming years.
Is Bitcoin a good long-term investment?
As several institutions continue to accumulate BTC and Bitcoin faces a rise in global recognition, Bitcoin has a solid long-term future.
Recent news/opinions on BTC
As reported by Cryptopolitan, JPMorgan Chase & Co. is concerned that Strategy’s new policy of selectively selling its Bitcoin holdings will introduce new risk to the crypto market.
Bitcoin price prediction July 2026
Bitcoin’s price dropped toward $60K in June. However, it is now facing minor accumulation, which could mean we’ll see a recovery around July 2026.
Bitcoin’s price might attempt to maintain an average price of $75,000 and be pushed further, at least $80,000 if strong downward pressures are not seen. However, we might see a rejection on the bearish side, leading to a consolidation at around $60,000.
Bitcoin Price Prediction
Potential Low
Potential Average
Potential High
Bitcoin Price Prediction July 2026
$60,000
$75,000
$80,000
Bitcoin price prediction 2026
Historically, Bitcoin has been a significant crypto coin in the years following a halving, and it is expected to push up its price after a downturn in 2025. Bitcoin miners might play a crucial role in holding bullish sentiment for future price movements.
Spot Bitcoin ETFs are projected to be a key driver of Bitcoin prices and the broader cryptocurrency market in 2026. As a result, Bitcoin’s trajectory might follow a bullish trend ahead with rising treasury term premium.
Furthermore, there is an increasing bullish sentiment that the base interest rates could be cut in the US, and thus, help to further the upward movement of Bitcoin. An outcome of which the 2026 year could be positive for Bitcoin, with its crypto-price perhaps touching $150,000 at the highest and the low could be around $48,000.
Bitcoin Price Prediction
Potential Low
Potential Average
Potential High
Bitcoin Price Prediction 2026
$48,000
$100,000
$150,000
Bitcoin Price Predictions 2027-2032
Year
Minimum Price
Average Price
Maximum Price
2027
$115,000
$130,000
$185,000
2028
$140,491
$170,100
$216,738
2029
$164,063
$185,068
$244,142
2030
$195,629
$200,312
$255,321
2031
$225,903
$248,568
$270,593
2032
$285,058
$303,555
$350,548
Bitcoin price prediction 2027
Bitcoin might witness slow growth after 2025’s Bitcoin halving surge, resulting in a surge in selling pressure. However, more financial products including a surge in ETF flows might hold BTC prices within a bullish region. The digital assets market sentiment shows bullish signals for Bitcoin hit new highs. As the overall sentiment gives a bullish outlook, one should research more about Bitcoin before investing.
We might see a maximum price of $185,000, with a minimum price of $115,000 and average price of $130,000.
Bitcoin forecast 2028
Based on a detailed technical analysis of past Bitcoin price movements, it is projected that in 2028, Bitcoin could see a minimum price of $140,491. The potential maximum price is estimated to be $216,738, with an average closing price of $170,100.
Bitcoin price prediction 2029
By 2029, Bitcoin’s price is expected to reach a low of $164,063. Maximum price projections are as high as $244,142, averaging about $185,068 for the year.
Bitcoin price forecast 2030
Projections for 2030 suggest that Bitcoin could be valued at a minimum of $195,629. The price may peak at as much as $255,321, with an average throughout the year expected to be around $200,312.
Bitcoin (BTC) price prediction 2031
The forecast for 2031 suggests that Bitcoin’s price could start at a minimum of $225,903 and potentially rise to a maximum of $270,593. The average price is anticipated to stabilize at about $248,568 throughout the year.
Bitcoin price prediction 2032
The forecast for 2032 suggests that Bitcoin’s price could start at a minimum of $285,058 and potentially rise to a maximum of $350,548. The average price is anticipated to stabilize at about $303,555 throughout the year.
A surge in bitcoin adoption and the expansion of the Bitcoin ecosystem might end the controversy of “Bitcoin bubble” in future. This might boost the Bitcoin cost and strengthen the Bitcoin network. At Cryptopolitan, we are bullish on Bitcoin’s future price as the historical market sentiment is extremely impressive. By the end of 2026, Bitcoin might record a maximum of $150,000, with a minimum price of $48,000 and an average price of $100,000.
However, Bitcoin’s future market potential entirely depends on its buying demand, regulation, and investor sentiment regarding long-term holdings. Crypto analysts provide a positive sentiment as macroeconomic trends turn promising.
We expect Bitcoin price to surpass a high of $216,738 by the end of 2028.
Bitcoin historic price sentiment
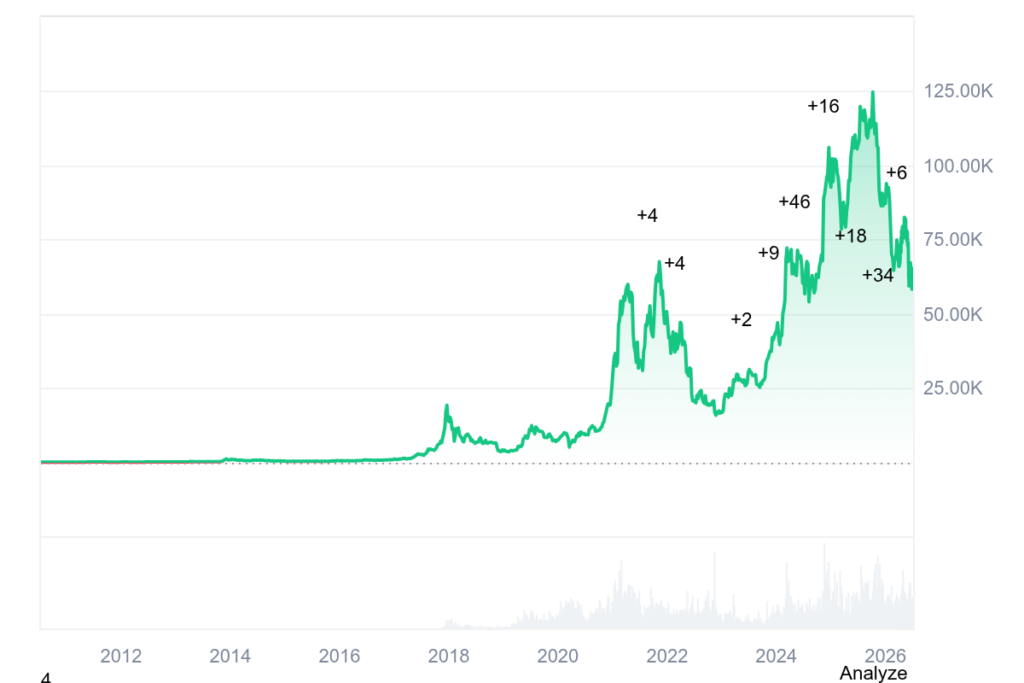
BTC price history: Coinmarketcap
Satoshi Nakamoto created Bitcoin in 2009, marking the first use of blockchain technology.
Bitcoin was initially of little value, gaining significant traction and hitting over $15,000 during the 2017 boom, with further highs reached in 2019 and 2021.
In 2021, Bitcoin peaked at $68,789.63 but dropped to $15,760 by December 2022 amid economic pressures, including inflation and geopolitical conflicts.
By April 10, 2023, Bitcoin’s price surged 83%, breaking the $30,000 resistance level.
Throughout mid-2023, Bitcoin’s value hovered around $30,000, nearly reaching $32,000 due to positive market sentiments and potential ETF approvals.
Bitcoin experienced a significant price drop in mid-August 2023, falling to $25,000. However, its prices remained volatile, fluctuating between $26,000 and $29,500 in October.
Bitcoin closed 2023 above $42,000, a 155% increase from the year’s start.
In early 2024, Bitcoin rose above $45,000 on ETF anticipation but briefly dipped below $40,000 after approvals. It broke its 2021 all-time high in March, reaching $73,750.07 on March 14, before dropping below $60,000 in April. May saw another surge above $70,000, while June and July brought heavy fluctuations between $70K and $55K.
Bitcoin rallied to $66K in September after a Fed rate cut, climbed to $70K in October’s Uptober rally, and surged toward $108K following Donald Trump’s victory in the November US elections. BTC ended 2024 consolidating below $95K.
At the start of January 2025, BTC was trading between $92,788.13 and $95,824.39. However, it formed an ATH at $109,114 on January 20.
In the weeks of February, the price of BTC dropped heavily as it dropped toward the $78K low.
In March, the price of Bitcoin declined heavily and dropped toward a low of $76.6K. In April, the price of Bitcoin started recovering. By the end of April, it neared the critical $95K zone.
In May, Bitcoin price skyrocketed and it formed a new ATH at $111,970. However, the price declined later, toward $104K.
By the end of June, BTC price reclaimed the $108K level.
In July, BTC price triggered a surge toward $123K; however, it faced strong selling pressure later.
In mid-August, the price of Bitcoin surged above $124K. However, the price failed to maintain its momentum as it dropped below $110K in early-September.
By the end of September, the price of Bitcoin dropped further and touched a low around $108K.
In October, the price of Bitcoin crashed heavily below $110K. The price crashed further toward $84K in November.
Bitcoin ended December 2025 on a bearish note by trading below $90K.
Bitcoin price further dropped in January 2026 as it crashed toward $77K. In February, the price of BTC hit a low at $60K.
BTC price continued to face bearish pressure in March. However, it surged above $70K in early April. By the end of April, BTC price surged toward $80K.
By the end of May, the price of BTC dropped toward $73K. In June, BTC dropped toward $60K.
Monero price prediction suggests a bullish trend, with XMR anticipated to reach $750.178 by the end of 2026.
XMR could reach a maximum price of $924.484 by the end of 2029.
By 2032, Monero’s price may surge to $1,593.845.
Monero (XMR) stands out in the crypto space for its strong focus on privacy and decentralization of transactions, particularly within the Monero network, making it one of the leading privacy focused cryptocurrencies. This makes it a popular choice for privacy advocates and those prioritizing security. The Monero ecosystem constantly evolves, marked by significant milestones like enhanced protocol upgrades and growing adoption across various sectors, which underscore its utility.
As Monero progresses, many wonder about its future price trajectory. Will its unique features drive significant value growth, as many traders speculate, and can a price prediction tool provide insights into this? Can it sustain its competitive edge in the ever-evolving crypto market? Will the price of xmr recapture its ATH at $798 in the long term forecast?
Overview
Cryptocurrency
Monero
Token
XMR
Price
$360.32(2.08%)
Market Cap
$6.76 B
Trading Volume (24-hour)
$107.4 M
Circulating Supply
18.78M XMR
All-time High
$798.91 Jan 15, 2026
All-time Low
$0.213, Jan 15, 2015
24-h High
$363.43
24-h Low
$349.14
Monero price prediction: Technical analysis
Market Sentiment
Bearish
50-Day SMA
$334.12
200-Day SMA
$378.83
Price Prediction
$372.25 (+16%)
Fear & Greed Index
11.36 (Extreme Fear)
Green Days
16/30 (54%)
14-Day RSI
51.91(Neutral)
Monero price analysis
TL;DR Breakdown
Monero price analysis shows a bullish market sentiment
Cryptocurrency gained 2.08% of its value in last 24 hours
XMR finds support at $356 mark
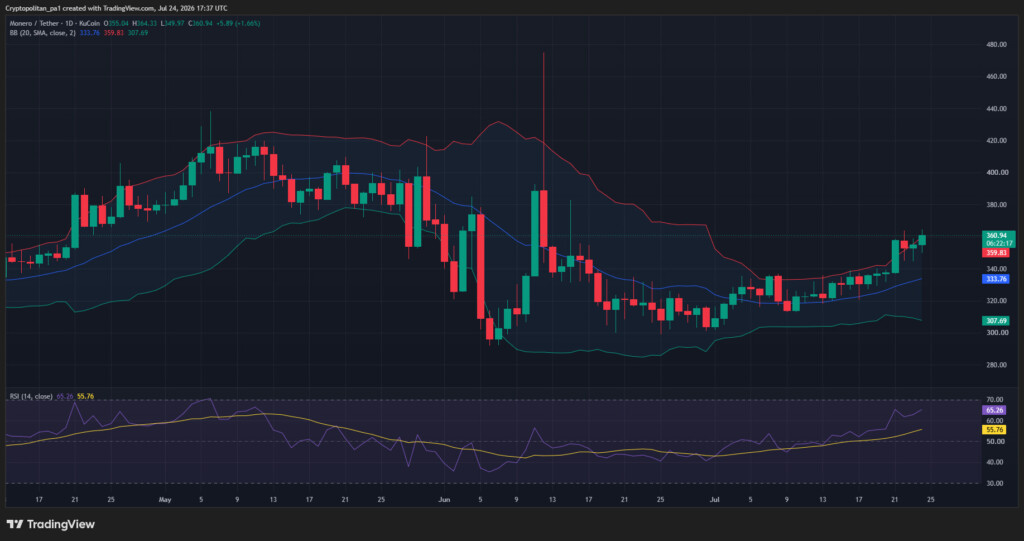
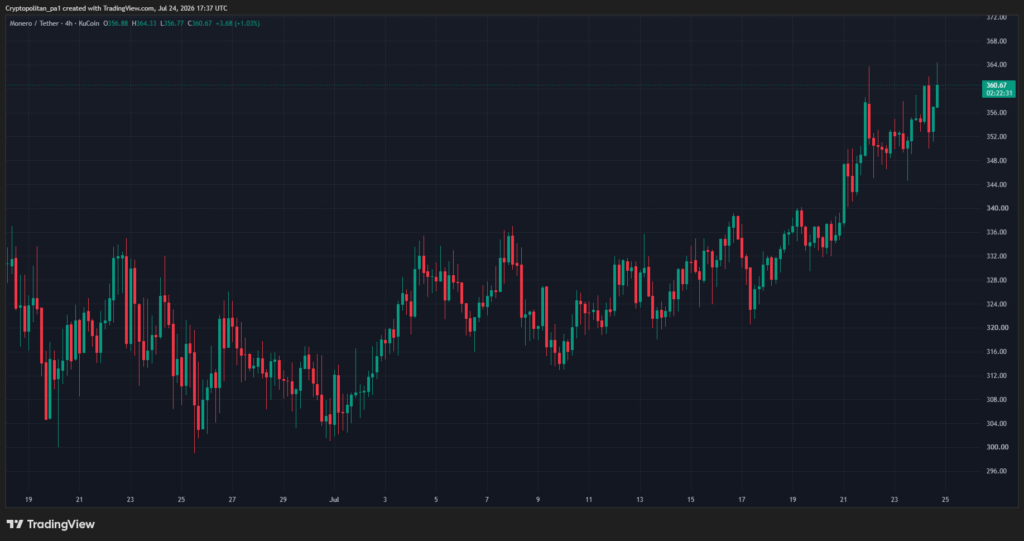
On July 24, Monero price analysis revealed a recovery back to $360 as bulls hold strong
Monero price analysis 1-day chart: XMR recovers to $360
The one-day price chart for Monero shows a recovery back to the $360 mark.
The Bollinger Bands are converging suggesting declining volatility. The Relative Strength Index (RSI) is trading at the center of the neutral region. The indicator’s value was recorded at 65.26 today showing rising bullish momentum. Further volatility can be expected if the buying momentum intensifies and the $360 mark is breached.
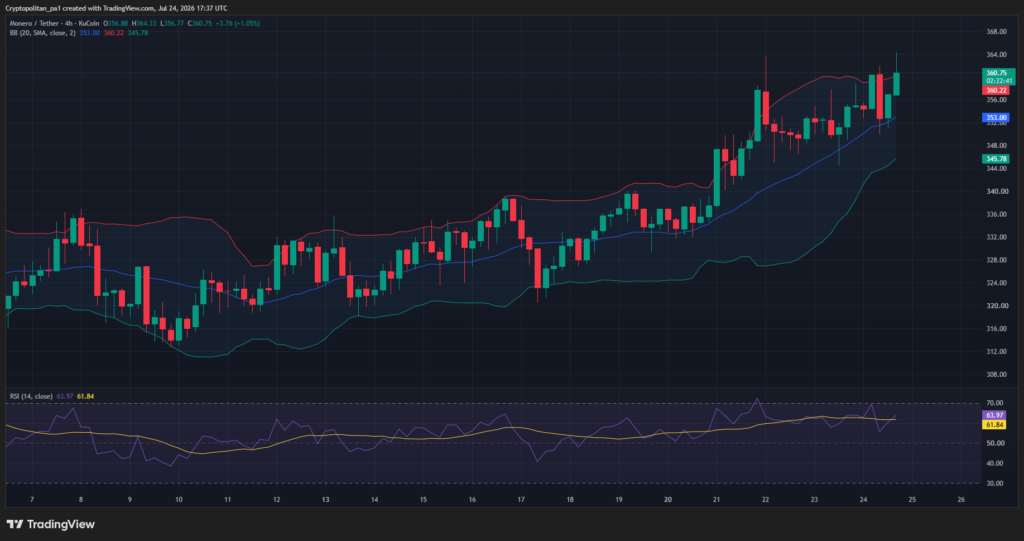
Monero price analysis 4-hour chart
The four-hour chart analysis of Monero shows rapid recovery after a brief struggle at $350 mark. Following the crash, the price made a swift move to the current $360 level.
The Bollinger Bands are wide suggesting high volatility. The Relative Strength Index (RSI) indicator is trading in the neutral region suggesting low momentum on either side. However, while XMR finds short-term resistance at the $360 mark, the rising bullish pressure means that further incline is not out of question. XMR must push through the level in the next few candles to prevent the bears from dominating.
Monero price analysis gives a bullish prediction for the asset’s short-term movements as the price rises to the $360 level. If a breakdown is observed, movement to $345 is expected while an incline at the level may suggest rise to $380.
Is Monero a good investment?
Monero is an attractive investment because it emphasizes privacy and security, utilizing advanced cryptographic techniques to ensure transaction confidentiality, which has created a strong demand in the market . Its growing adoption across various use cases and a decentralized development model enhance its long-term potential.
With a limited supply and increasing investor interest, Monero offers a unique opportunity for those seeking financial autonomy and privacy to invest in cryptocurrency. However, investors should remain cautious of regulatory risks and market volatility when considering Monero as part of their portfolio, making it essential to seek investment advice.
Why is XMR up?
Monero price analysis shows that XMR faced rejection from above the $350 mark, resulting in a drop to the current $348 mark before rapidly rising to the current $360 mark.
Will XMR recover to its all-time high?
Monero recently reached a new all-time high of $798 before experiencing a sharp correction. The privacy-focused blockchain is expected to stabilize and potentially recover as it continues to reduce technical debt and enhance its utility and privacy features. However, widespread adoption may be hindered by regulatory scrutiny and market volatility, keeping the asset highly speculative.
How much will Monero be worth in 5 years?
The Monero price prediction for 2031, is expected to reach a minimum of $463.56, while averaging $726.61. The maximum projected value is $989.65.
Will XMR reach $1000?
The chances of Monero (XMR) hitting $1,000 hinge on various factors, which will influence its future price movements. The adoption of privacy transactions and technological advances could increase demand. Favorable regulations and market sentiment toward privacy coins would also help. Yet, regulatory risks, competition, and market volatility creating an atmosphere of extreme fear are challenges that Monero traders could face that could hinder significant growth. $1,000 is possible with favorable conditions, especially considering the current price but market dynamics and regulations will shape its path.
Does XMR have a good long-term future?
Monero (XMR) has the potential for a strong long-term future due to its focus on privacy and security, which makes it attractive to users seeking anonymity. However, many investors have concerns regarding privacy, regulatory scrutiny, and notoriety from being the favored medium for some past criminals, which impact the current Monero sentiment. Monero’s commitment to ring confidential transactions and the broader monero project gives it a solid foundation for long-term growth, but it must carefully navigate market and regulatory landscapes.
Recent news/ opinion on Monero
Monero recently announced the release of a new ecosystem on May 26.
The XMR price prediction for July 2026 suggests a minimum value of $302.32 and an average price of $335.44. The price could reach a maximum of $401.09 during the month.
Month
Minimum Price ($)
Average Price ($)
Maximum Price ($)
July
302.32
335.44
401.09
Monero price prediction 2026
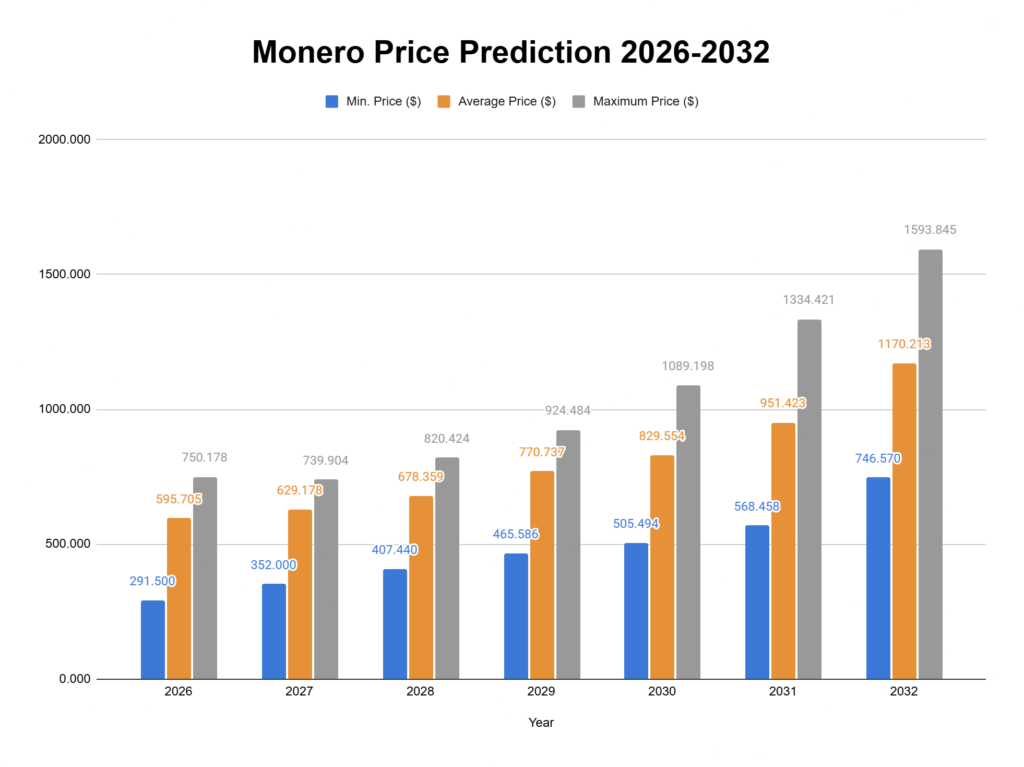
The Monero price prediction for 2026 anticipates a potential increase driven by growing adoption, with a maximum price forecasted at $750.178. Based on current analysis, investors can expect an average trading price of $595.705, while the minimum price could be around $291.500.
Year
Min. Price ($)
Average Price ($)
Maximum Price ($)
2026
291.500
595.705
750.178
Monero price prediction 2027-2032
Year
Min. Price ($)
Average Price ($)
Maximum Price ($)
2026
291.500
595.705
750.178
2027
352.000
629.178
739.904
2028
407.440
678.359
820.424
2029
465.586
770.737
924.484
2030
505.494
829.554
1089.198
2031
568.458
951.423
1334.421
2032
746.570
1170.213
1593.845
Monero Price Prediction 2027
In 2027, Monero’s value is expected to continue its upward trend, with a minimum price of $352.000, an average price of $629.178, and a maximum price of $739.904.
Monero Price Prediction 2028
For 2028, Monero is anticipated to trade at a minimum of $407.440, with an average price of $678.359, and a maximum price reaching $820.424.
Monero Price Prediction 2029
The price outlook for 2029 suggests Monero will maintain a minimum value of $465.586, an average of $770.737, and a maximum of $924.484.
Monero Price Prediction 2030
By 2030, Monero is forecasted to achieve a minimum trading price of $505.494, with an average price of $829.554 and a potential peak of $1,089.198.
Monero Price Prediction 2031
In 2031, Monero’s price is expected to reach a minimum of $568.458, while averaging $951.423. The maximum projected value is $1,334.421.
Monero Price Prediction 2032
In 2032, Monero is projected to continue its growth trajectory, with a minimum trading price of $746.570, an average price of $1,170.213, and a maximum price reaching $1,593.845.
Cryptopolitan’s Monero price forecast suggests a bullish outlook for XMR’s future should the market recover. According to expert analysis, Monero could reach a maximum price of $750.178, record a minimum price of $291.500, and trade at an average price of $595.705 by the end of 2026.
However, it is advised to do your own research and conduct expert opinion before investing in the volatile crypto market.
Monero historic price sentiment
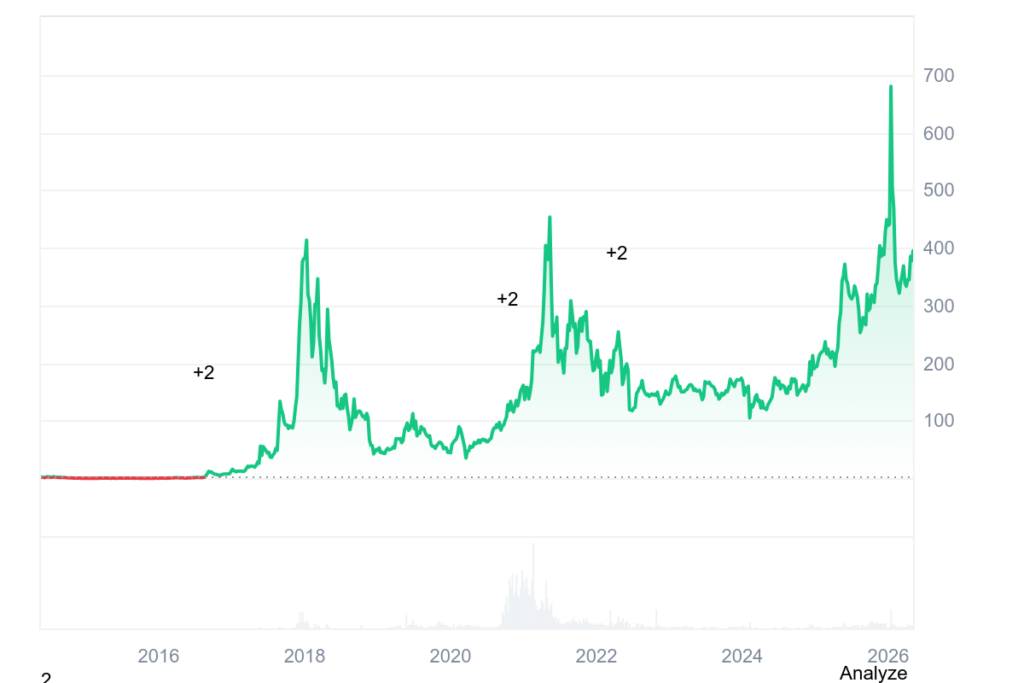
XMR price history
Monero’s market value has changed dramatically since its launch in 2014, from less than $1 to over $475.
May 2021 marked the highest point in Monero’s history. Monero’s price projections revealed the coin’s security. They provide investors with optimism that they will be freed from the persecution of some authorities simply by buying or selling Monero
Across 2023, Monero’s price rose by 11.49%. The highest price was $278.56, and the lowest was $114.16.
In January 2024, Monero stayed stable around the $150.00 mark as market momentum remained low. However, the stability was short-lived as February crashed to $101.95. However, XMR showed swift recovery as it closed the month near the $150.00 level again.
In March and April 2024, XMR saw a steady decline from $150.00 to $120.00, where it found key support.
In May 2024, XMR observed steady bullish pressure as the price rose from $120.00, approaching resistance at $150.
In June 2024, Monero (XMR) traded within the $150 – $175 price range as either side struggled to make a clear breakthrough. In July, the crypto traded around the $155 mark as the price volatility remained relatively low. XMR opened trading at $156.05 in August and ended the month at $176.00, making remarkable gains.
September was bearish for the asset, as the price declined below the $160 mark by the end of the month. In October, Monero observed a steep crash and has been making a swift recovery since then.
In December, Monero made remarkable strides as the asset’s price broke past the $220 mark, albeit briefly as it closed the month below $200.
In January, Monero saw a bullish January as the price rose from below the $200 mark to $238 by the end of the month.
In February, the price fell towards the $215 mark as bears dominate the markets. In March, the price observes mixed momentum and closed the month slightly below $215. In April the consolidation continued until late into the month when it spiked past the $325 mark before ending the month around $275.
In May the price continued rising rapidly as the bulls cruised past $300 ending the month around $320. During June the price continued to observe high volatility but observed low net change as the asset closed the month around $313.
In July the price saw a huge spike in volatility as the price rose past $340 but the asset closed the month below the $310 mark. In August the price declined rapidly falling to the $260 mark by the month’s end. In September, the price rose to the $340 and while it did not maintain the level but managed to close the month above the $320 mark.
In October the price continued to rise ending the month above the $340 mark, a trend separating it from most other cryptocurrencies that saw a decline during the period. In November, the bullish rally continued with XMR crossing the $400 mark by the end of the month. In December, the bulls continued to charge ending the month above the $430 mark.
In January 2026, price volatility rose sharply establishing a new all-time high but ended the month below the $500 mark. In February, the declined continued with XMR ending the month around the $340 level.
The price consolidated in March, observing a slight decline to $325 by the month’s end. In April the price made swift recovery ending the month above the $375 mark. In May, the price observed high volatility before declining to the $360 mark by the end of the month. In June, the price declined further retracing to the $320 mark by the month’s end.
Ethereum remains trapped below a major higher-timeframe resistance cluster despite recovering strongly from its June lows. The recent rejection near local highs has pushed the asset back into an important support zone, while the price is approaching a technical decision point that should determine whether buyers can extend the recovery toward higher resistance or whether another corrective leg unfolds.
ETH Price Analysis: The Daily Chart
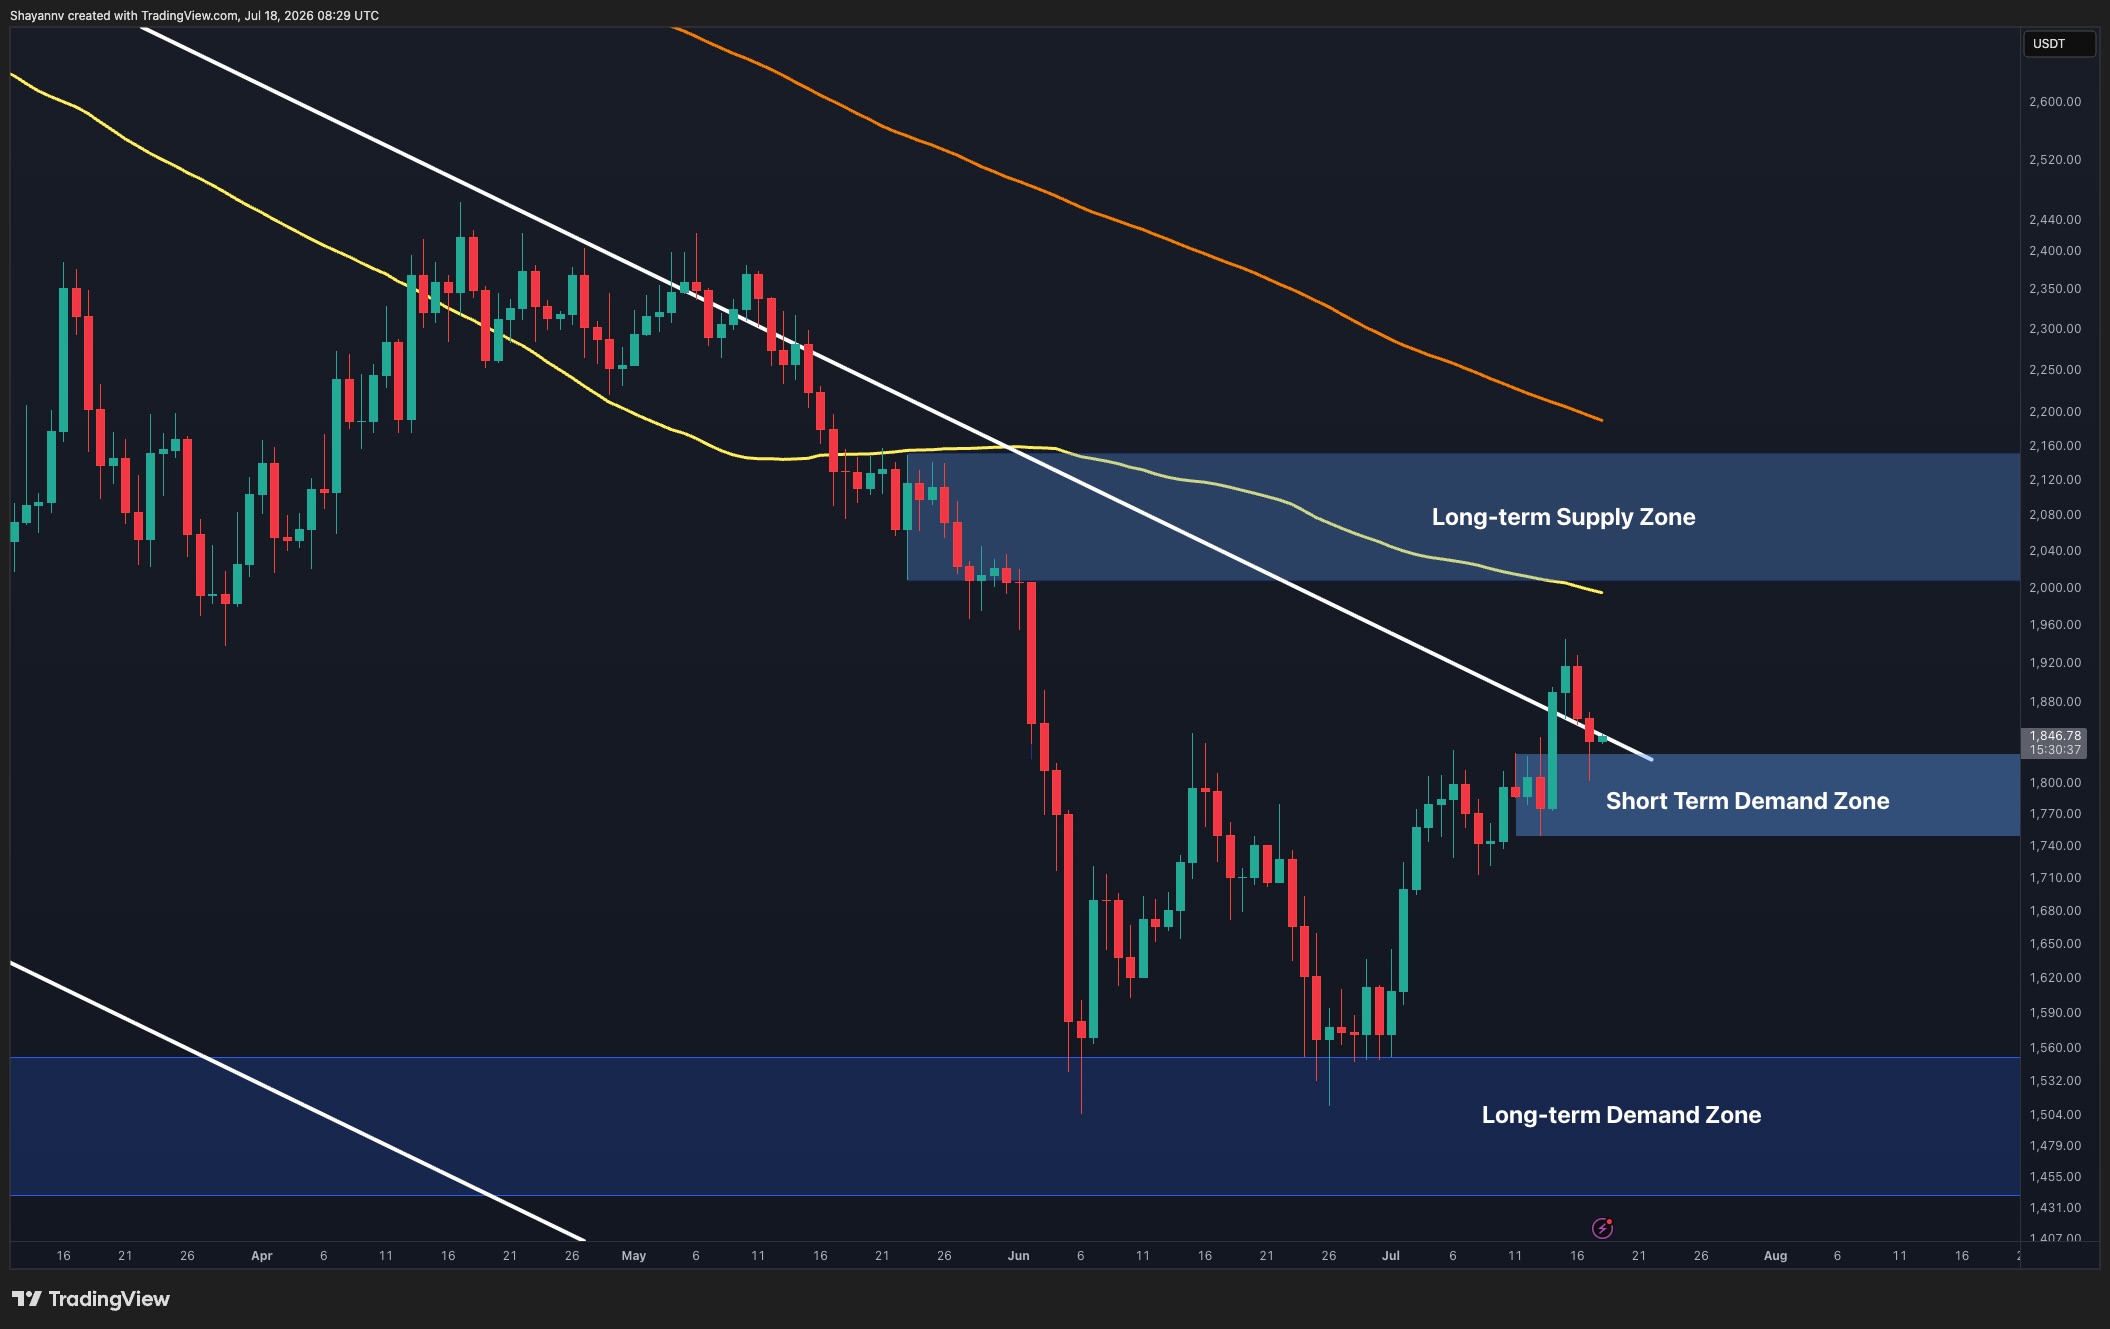
On the daily timeframe, ETH continues to trade below the descending 100-day and 200-day moving averages, confirming that the broader market structure remains bearish despite the recent rebound.
The asset recently failed to sustain a move above the short-term resistance around $1.9K and has now pulled back into the $1.75K-$1.85K demand zone. This region has acted as support throughout the current recovery and now represents the first line of defense for buyers.
As long as Ethereum holds above this area, another push toward the major decision zone between $2K and $2.15K remains possible. This region also aligns with the descending long-term trendline and the declining 100-day moving average, making it the most significant resistance cluster on the daily chart.
A successful breakout above this confluence would mark an important structural improvement, while rejection would likely shift attention back toward the long-term demand zone around $1.45K-$1.55K.
ETH/USDT 4-Hour Chart
The 4-hour chart shows Ethereum pulling back after failing to extend above the recent swing high near $1.95K. The correction has pushed it back to the short-term demand zone around $1.76K-$1.84K, which has repeatedly attracted buyers over the past week.
This area now serves as the immediate support needed to preserve the sequence of higher lows established since early July. Holding above it could allow another attempt toward the upper boundary of the current recovery structure and eventually the daily resistance around $2K.
However, losing this demand zone would likely expose the lower support levels around $1.7K before buyers attempt another recovery.
Sentiment Analysis
The liquidation heatmap highlights a large concentration of short liquidations positioned above the current market, with the most notable liquidity cluster sitting around the $1.95K-$2K region.
Importantly, this liquidity pool aligns closely with the key technical resistance visible on both the daily and 4-hour charts. The cluster sits directly beneath the higher-timeframe supply zone around $2K-$2.15K and near the descending trendline, creating a strong confluence between derivatives positioning and technical resistance.
This alignment increases the probability that Ethereum could first stage an upside liquidity grab into the $1.95K-$2K area to sweep leveraged short positions before facing renewed selling pressure from the overhead supply zone. A decisive breakout through both the liquidity cluster and the daily resistance would invalidate this scenario and instead strengthen the case for a broader bullish reversal.
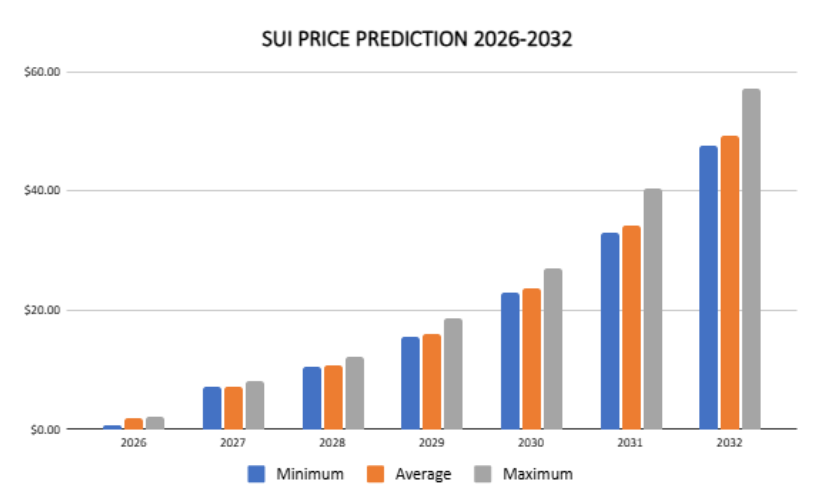
Our SUI price prediction indicates a high of $2.07 by the end of 2026.
In 2028, SUI will range between $10.47 and $12.10, with an average price of $10.83.
In 2031, it will range between $33.01 and $40.39, with an average price of $34.20.
Our SUI price prediction points to a high of $2.07 by the end of 2026, an average price of $10.83 in 2028, and a potential average of $34.20 by 2031. If you’re an investor, trader, or crypto enthusiast weighing SUI‘s future upside and investment potential, this forecast breaks down the data that matters: historical price action, technical indicators, short- and long-term projections from 2026 to 2032, market sentiment, recent news, and whether SUI looks like a good investment. In a volatile market, understanding SUI’s likely price path and the network developments shaping it can help you make more informed decisions over the next few years.
Overview
Cryptocurrency
Sui
Symbol
SUI
Current Sui price
$0.7474
24-hour trading volume
$231.61M
Circulating supply
4.05B
Market capitalization
$3.02B
Total supply
10B
All-time high
$5.35 on Jan 6, 2025
All-time low
$0.3643 on Oct 19, 2023
24-hour high
$0.7638
24-hour low
$0.7343
SUI price prediction: Technical analysis
Metric
Value
Volatility (30-day variation)
4.00% (Medium)
50-day SMA
$0.7574
200-day SMA
$1.03
Sentiment
Neutral
Green days
11/30 (37%)
Fear and Greed Index
25 (Extreme Fear)
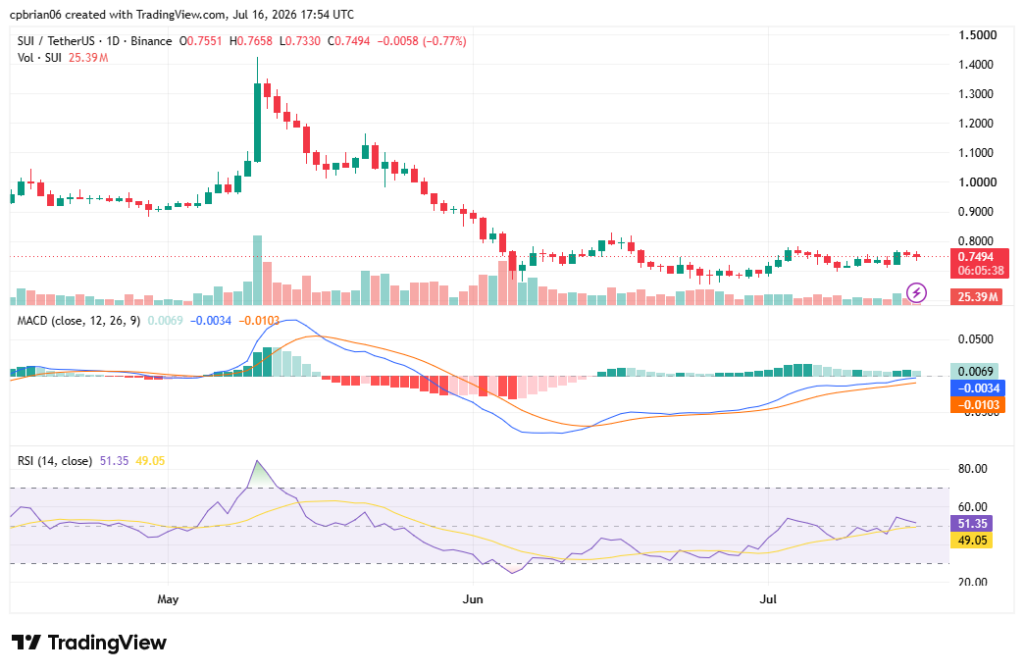
SUI also remains below its 50-day and 200-day simple moving averages, indicating a dominant daily bearish trend. In any forecast, technical factors should be weighed alongside fundamental factors.
SUI price analysis
On July 16, SUI coin fell by 0.26% over the past 24 hours and 0.49% over the past 30 days. Its trading volume rose 8.86% to $231M over 24 hours, signaling rising conviction in the trend, with short-term price action tracking the broader cryptocurrency markets.
SUI is neutral, having faced resistance levels at $0.811. The candles are coherent, supporting the neutral sentiment. It has technical support in the $0.50- $0.66 range. If bullish pressure resumes, it could test $0.80, then $0.89.
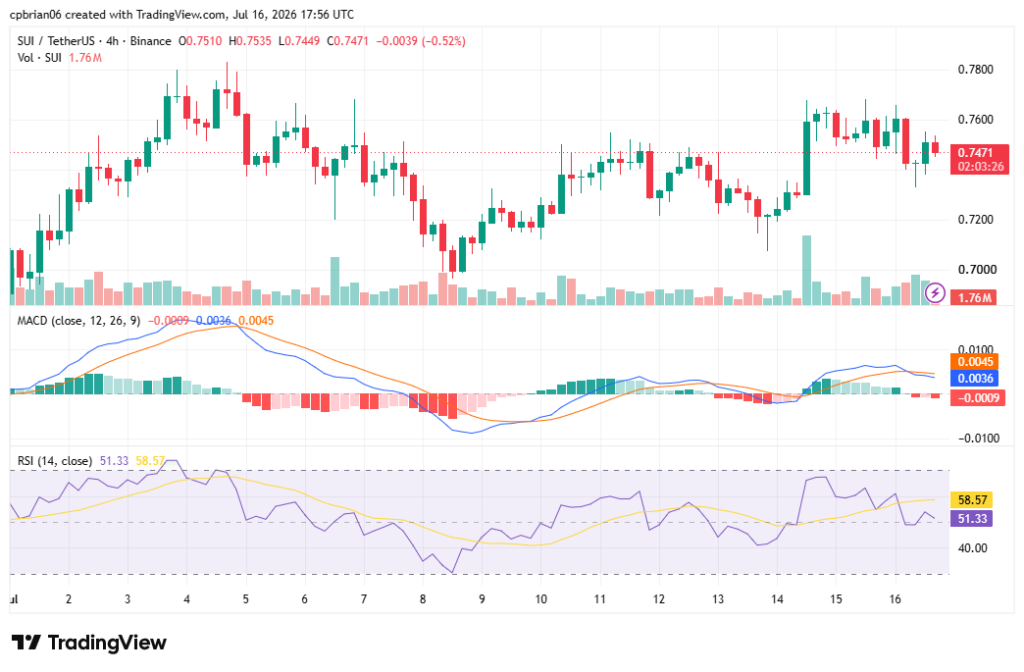
SUI is volatile on this timeframe and is on its next leg up. Support and resistance levels are at $0.699 and $0.771, respectively. Its Relative Strength Index (RSI) is now at 51.33. It is oversold when the value crosses below 30.
SUI technical indicators: Levels and action
Daily simple moving average (SMA)
Period
Value ($)
Action
SMA 3
0.7453
BUY
SMA 5
0.7405
BUY
SMA 10
0.7343
BUY
SMA 21
0.7244
BUY
SMA 50
0.7574
SELL
SMA 100
0.8816
SELL
SMA 200
1.03
SELL
Daily exponential moving average (EMA)
Period
Value ($)
Action
EMA 3
0.7493
BUY
EMA 5
0.7443
BUY
EMA 10
0.7382
BUY
EMA 21
0.7369
BUY
EMA 50
0.7791
SELL
EMA 100
0.8695
SELL
EMA 200
1.16
SELL
What to expect from the SUI price analysis next?
The short-term charts show negative momentum, while key technical indicators remain neutral unless a bullish continuation develops above nearby resistance. Next week’s price action depends on whether support at $0.699 holds.
Why is SUI down?
Sui’s drop closely mirrors Bitcoin’s decline, indicating it moved as a high-beta asset during a broad market sell-off. The total crypto market cap fell 1.44% to $2.2T.
Recent news
Sui blockchain has processed nearly $65 billion in stablecoin transactions since June 10, following an update that eliminated fees for stablecoin transfers. This fee removal, aimed at simplifying B2B payments and retail use, has boosted transaction volumes and could challenge traditional payment systems like SWIFT.
Will SUI reach $10?
According to the Cryptopolitan price prediction, SUI is expected to reach $10 in 2027, with an average price of $10.83 for the year.
Will SUI reach $100?
It remains unlikely that SUI will rise to $100 before 2032.
Will SUI reach $1,000?
It remains unlikely that SUI will rise to $1,000 before 2032.
How high can Sui go?
Per the Cryptopolitan price prediction, SUI could reach $4.77 by the end of 2026, while some long-term models place it in the $2.00-$3.50 range under favorable ecosystem expansion and market recovery. Its long-term potential will also depend on how the network handles token unlocks, institutional adoption, and scaling execution.
Is SUI crypto a good investment?
Should the market sentiment change, SUI will rise to its previous highs. SUI’s price predictions for 2032 are optimistic as global adoption of decentralized applications rises, though the long-term upside also depends on how Sui competes with Solana and Ethereum Layer 2s and manages that competitive risk.
The native token supports network economics, and the SUI token is used to pay gas and transaction fees, participate in governance, and support liquid staking, which can strengthen demand if usage improves and fresh capital follows continued innovation. Sui uses a delegated proof-of-stake model, where validators and delegators help secure the blockchain and earn rewards. Integrations with major tech frameworks expand developer access in SUI. Its architecture also emphasizes parallel execution, horizontal scaling, low-latency transactions, and deep composability.
SUI price prediction July 2026
The SUI price forecast for July ranges from $0.65 to $1.10. Next month, traders should watch whether support holds and momentum improves after the May range. The average price for the month will be $0.89.
Month
Potential low ($)
Potential average ($)
Potential high ($)
July
0.65
0.89
1.10
SUI price prediction 2026
For 2026, SUI’s price will range between $0.68 and $2.07. Some analyst models place the end-2026 price between $1.20 and $1.50, depending on broader market cycles, while a stronger bull run would likely be needed to push SUI toward the upper end of that range as investors shift toward digital assets during changing macro conditions. Alternative long-range forecasts put Sui Crypto at $0.7545 by the end of 2026, $3.33 by 2030, and $5.32 by 2040, while some 2025 projections targeted $2.85 to $3.00 under favorable conditions. The average price for the year will be $1.77.
Year
Potential low ($)
Potential average ($)
Potential high ($)
2026
0.62
1.77
2.07
SUI price prediction 2027-2032
Year
Potential low ($)
Potential average ($)
Potential high ($)
2027
7.05
7.24
8.16
2028
10.47
10.83
12.10
2029
15.50
16.04
18.66
2030
22.96
23.77
27.04
2031
33.01
34.20
40.39
2032
47.50
49.21
57.09
Sui price prediction 2027
SUI coin price prediction estimates a range of $10.47 to $12.10, with an average of $10.83.
Sui price prediction 2028
SUI network coin price prediction climbs even higher into 2028. According to the prediction, the SUI cost will range from $15.50 to $18.66, with an average of $16.04.
Sui price prediction 2029
According to the SUI forecast for 2029, the price of SUI will range from $22.96 to $27.04, with an average closing price of $23.77.
Sui price prediction 2030
According to the 2030 SUI price prediction, the price will range from $33.01 to $40.39, with an average of $34.20.
Sui price prediction 2031
The SUI crypto price forecast for 2031 is a maximum price of $57.09. It will reach a minimum price of $47.50 and an average price of $49.21.
Sui crypto price prediction 2032
The SUI’s price prediction ranges from $7.05 to $8.16, with an average of $7.24. The predictions indicate long-term growth.
SUI price prediction 2026 – 2032
SUI market price prediction: Analysts’ SUI price forecast
Our predictions show that SUI will reach a high of $2.07 in 2026, and future forecasts will depend not only on adoption and scaling but also on whether the native token captures value as ecosystem usage grows. In 2028, it will range between $10.47 and $12.10, with an average of $10.83. In 2030, it will range between $33.01 and $40.39, with an average of $34.20. Sustained capital inflows and higher on-chain usage would strengthen the long-term case.
If you plan to buy sui or trade sui, base that decision on your own research rather than headline targets alone. Note that the predictions are not investment advice and that risk can also rise with supply growth if token unlock pressure persists. Seek independent consultation or do your own research.
Exchanges such as Binance, OKX, KuCoin, and Bybit hosted activities toward the initial distribution of SUI in April 2023.
Sui was developed by Mysten Labs, the team behind the Layer-1 chain.
Its object-centric data model allows tracking of individual objects, and its architecture uses parallel execution to handle many transactions with low latency while maintaining efficient performance.
The Move programming language is used to create digital assets and smart contracts in a more secure environment.
Tools such as zkLogin and sponsored transactions make sui easier for mainstream users by simplifying access and fees, while the design also supports deep composability.
The chain is built for high throughput, fast transactions, and real-world apps such as gaming and finance, with low-latency transactions, horizontal scaling as the network grows, and ongoing innovation that could support long-term value through sustained usage.
The SUI token is the native token used for fees, staking, and governance.
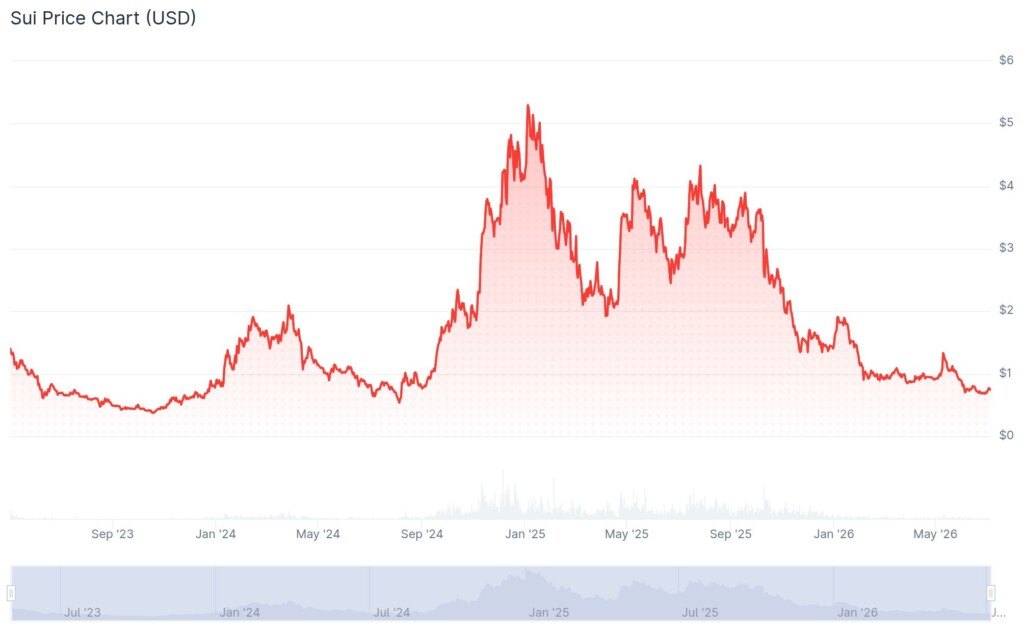
SUI initially traded at $2.10, well above the $0.10 investors paid during its public sale at the end of April.
A bear run preceded the listing, and on October 23, 2023, it fell to its lowest price, $0.3643.
It started recovering in November 2023.
It reached its highest price on March 27, 2024, at $2.18, following the Greek stock exchange’s announcement of a possible collaboration.
On May 21, 2024, the SUI network surpassed 1 million daily active wallets. In August, it traded at $0.57.
It later rose, breaking above $1.5 in September and $2 in October.
The bull market run continued into November, reaching a new all-time high of $5.35 on January 6, 2025. Later, it quickly reversed, falling below $3.50 in February and $2.00 in April.
It began recovering in May, rising above $3.50. In July, it fell below $3.0, and, like Solana and Ethereum Layer 2 networks, broader adoption still depends on ecosystem depth, since those rivals already benefit from deep liquidity.
It rose to $3.60 by October, then entered a bear run. Decentralized exchanges, lending platforms, and liquid staking can strengthen ecosystem liquidity, while ecosystem partners can support token distribution and liquidity management.
By November, it had dropped to $2, and in December to $1.6.
In January 2026, it recovered to $1.9, but erased those gains in February, falling below $1. It reached $0.90 in April. In June, it dropped to $0.70 and maintained that level into July.
The Ethereum (ETH) price broke out of a descending trendline that had capped it since the all-time high, while futures open interest climbed to $19.8 billion. ETH trades near $1,928, up 5.2% in the last 24 hours.
Derivatives positioning, liquidation data, and long-term chart structure now point in the same bullish direction. However, one missing ingredient still keeps the breakout unconfirmed.
Futures Traders Return as Open Interest Nears $20 Billion
Glassnode data shows Ethereum futures open interest across all exchanges spiked to $19.8 billion on July 14. That is the highest reading since June 3, when a market-wide deleveraging event reset positioning.
Open interest measures the total value of outstanding futures contracts. Rising open interest alongside a rising price suggests new capital is entering the market rather than shorts simply covering.
The metric had collapsed to approximately $15.5 billion in late June. Its sharp recovery indicates traders are returning to ETH derivatives with conviction. Elevated positive funding on Ethereum supports the same reading.
Whale trader Machi Big Brother reportedly opened a $24.3 million ETH long at 25x leverage, with liquidation set at $1,833.
Machi Big Brother has opened a $24,300,000 $ETH long with 25x leverage.
A drop back below the June range would flip this signal and suggest the new positioning was short-lived.
Long Liquidations at a Yearly Low of 4% Point to a Short Squeeze
The composition of recent liquidations strengthens the bullish case. Ethereum futures long liquidations dominance fell to 4%, its lowest level in a year, according to Glassnode.
In plain terms, only 4% of liquidated positions were longs. The remaining 96% were short traders forced out as the price pushed higher.
Still, squeeze-driven rallies carry a caveat. Forced short covering can exaggerate upside moves, as the June 3 liquidations cascaded to exaggerate the downside. Spot demand must follow for the move to hold.
A return of dominance above 50% would indicate that longs are absorbing damage again and would weaken the momentum signal.
Ethereum Price Holds the Trendline From the 2022 Bottom
The weekly chart shows why the current level matters so much. An ascending trendline drawn from the June 2022 bottom, respected throughout the previous bull market, held near $1,600 once again.
The bounce also occurred inside a long-term green demand zone that has served as support four times since early 2023. Moreover, the area coincides with the 0.786 Fibonacci retracement of the entire cycle at $1,754.
This triple confluence of trendline, horizontal support, and Fibonacci level makes the zone a structural line in the sand. The next major resistance sits far above, at the 0.618 Fibonacci retracement of $2,438.
ETH Price Prediction as the $2,000 Test Looms
On the daily chart, Monday’s 6.5% green candle broke above a descending trendline in place since the all-time high. That line had rejected the ETH price five times before this breakout.
The daily Relative Strength Index (RSI) confirms the shift in momentum. It broke out of its own descending trendline, drawn from July 2025, and now sits just below 65.
One warning sign remains. Volume has been declining during the recovery, so the breakout lacks confirmation from participation. Analysts watching the ETH/BTC ratio see early signs of a broader Ethereum comeback that could fill the missing demand.
Immediate resistance lies between $1,900 and $2,000. A confirmed daily close above that zone on rising volume could open the way toward $2,438, nearly 30% above the current price.
On the downside, $1,754 is the critical support. Losing it would expose the trendline near $1,600, and a weekly close below that level would invalidate the bullish structure entirely.
Either volume arrives to validate the breakout, or ETH returns to the zone that has saved it four times already.
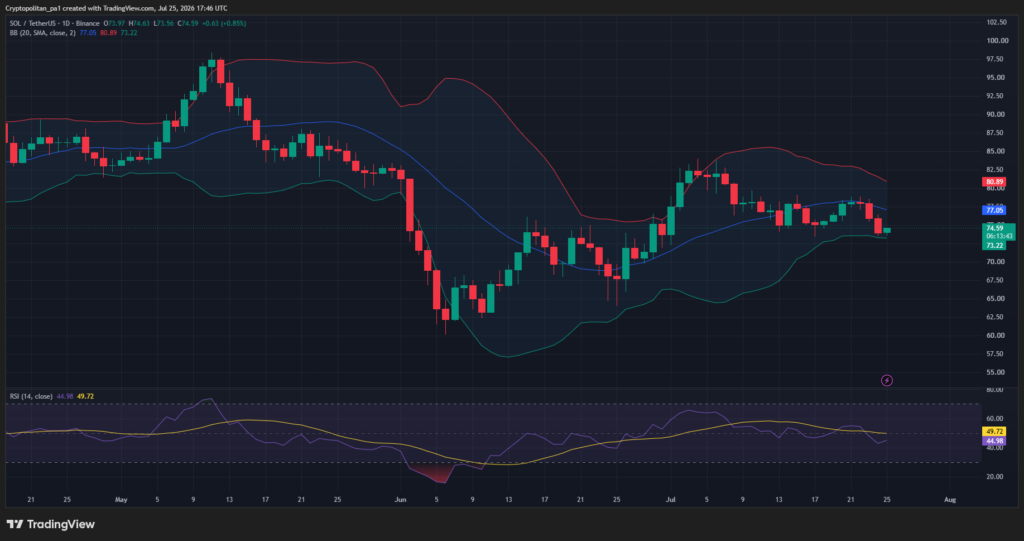
Solana (SOL) joined the broader crypto rebound after cooling US inflation data, climbing back toward $80.
According to some analysts, this could be the beginning of a more substantial rally that might push the price well beyond the psychological level of $100.
SOL Turns Bullish
The renowned analyst Ali Martinez claimed that the Average True Range (ATR) stop has flipped below price, marking the first SuperTrend buy signal on Solana since October 10.
He believes that if buying pressure continues to build, SOL could surge toward $96 and even $121. At the same time, Martinez paid close attention to the $60 level, noting that a drop below that support would invalidate the bullish setup.
Michael van de Poppe also chipped in, suggesting that the asset is at an important crossroads. He thinks that if SOL manages to keep its current valuation at around $77, it may trigger a much more substantial upswing. On the other hand, he warned that a drop below $73 could trigger a retest of the lows in the coming weeks.
Bloomberg’s James Seyffart pointed to a key regulatory development that may swing momentum toward the bulls. He revealed that Wall Street giant Morgan Stanley has filed updated documents to launch a Solana ETF with the ticker MSOL and a 0.14% fee. An eventual introduction of such a financial vehicle could draw additional investors into Solana’s ecosystem and benefit the price.
It is important to note that Morgan Stanley wouldn’t be the only behemoth offering that kind of a product, as Bitwise, Fidelity, Grayscale, VanEck, Franklin Templeton, Invesco, 21Shares, and Canary Capital have already jumped on the bandwagon. The cumulative net inflow into spot SOL ETFs to date has reached almost $1.15 billion.
Another Positive Factor
The prolonged bear market and unmet ecosystem expectations have recently pushed Solana’s fear, uncertainty, and doubt (FUD) to its highest level for 2026.
This means that sentiment among market participants is extremely negative, and most weak-hand investors have already exited. The development could be interpreted as bullish, since the price often reverses when fear peaks, suggesting that the cycle’s bottom might have been formed.

 Could Soar by 40% But Under This Condition: Details")


 Indicator Finally Flashes a Buy Signal: Can Bulls Push to $120?")