
Bitcoin’s Rise May Have Little To Do With The Latest Purchase News
Bitcoin’s recent rally is being attributed to technical relief rather than headline acquisition news, with analysts pointing to oversold conditions and easing seller pressure as primary drivers. Institutional investors should focus on market structure signals rather than corporate purchase announcements to assess the sustainability of price moves.
- Bitcoin bounce likely driven by oversold market finding relief after February lows, not purchase announcements.
- Strategy’s 32 BTC sale triggered liquidation fears now easing, removing a near-term bearish catalyst.
- Current price action mirrors previous distribution patterns that preceded substantially deeper declines than initial breakdown.
- 32 BTC Strategy sale that sparked liquidation concerns now being reassessed by market.
- 20% Bitcoin decline from previous highs during current distribution phase.
- June Potential timeframe for lower lows before sustained rally, according to analyst forecast.
Bitcoin’s latest upward move has ignited competing narratives among institutional market participants, with purchase-focused headlines obscuring the technical drivers actually propelling the rally.
While acquisition news has garnered significant media attention and is widely viewed as constructive for cryptocurrency markets broadly, market analysts increasingly argue the price move reflects oversold conditions and technical relief rather than fundamental enthusiasm tied to corporate buying.
Understanding this distinction matters to institutional investors evaluating whether current price strength signals a durable recovery or a temporary bounce within a larger downtrend.
Oversold Relief, Not Purchase News, Driving Bitcoin’s Bounce
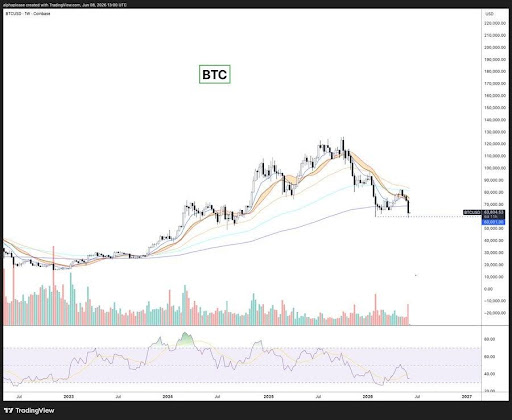
Crypto analyst Aylo has identified the Bitcoin bounce as a direct response to oversold market conditions, specifically the asset bouncing after sweeping key support levels established in February. Rather than reacting to acquisition headlines, the move represents classic technical recovery once extreme selling pressure exhausted itself.
This interpretation aligns with how seasoned traders assess rapid price reversals: when an asset falls sharply and touches critical support, a relief bounce often follows regardless of concurrent news flow.
Simultaneously, easing concerns around Strategy and Michael Saylor’s Bitcoin holdings have removed what had been a fresh bearish overhang. The company’s recent sale of 32 BTC triggered immediate fears of forced liquidation cascades, given Strategy’s substantial BTC holdings and the structural nature of its financing arrangements.
However, market participants are now reassessing whether this sale signals the beginning of systematic liquidation or merely a tactical transaction to meet limited obligations.
Aylo notes that the fear narrative surrounding potential major liquidations from Strategy’s supply is likely being driven more by bearish sentiment than fundamental analysis of the company’s actual debt position and liquidity requirements.
The distinction between technical bounce and fundamental recovery will prove critical for institutional positioning.
Distribution Pattern Mirror Suggests Rally May Be Incomplete Recovery
Trader Max Trades has drawn explicit parallels between Bitcoin’s current price structure and a previous distribution phase that preceded substantially deeper declines than the initial breakdown itself.
Roughly a month ago, BTC entered what traders classify as a distribution phase after first forming an accumulation range, breaking higher to sweep liquidity above previous highs, then reversing into the distribution pattern. The current setup mirrors this historical precedent with notable precision, according to Trades’ analysis.
Bitcoin has declined more than 20% from its previous highs during this distribution phase, yet the structure suggests this initial breakdown may not represent the full extent of downside risk. Distribution phases by definition reflect institutional unwinding and profit-taking before major selloffs accelerate.
If the current pattern replicates the prior distribution sequence, the implication is that today’s relief bounce could prove temporary, with substantially deeper lows arriving before a sustained recovery takes hold. This structural reading conflicts with bullish interpretations anchored solely to acquisition news cycles.
The accumulation-distribution framework matters because it tracks how professional capital positions itself before major directional moves. When distribution patterns emerge after prior accumulation phases, they typically precede sharp declines that shake out retail traders and extract maximum pain from positioned longs.
The fact that current price action is tracking this pattern with accuracy suggests market structure is reasserting itself despite positive news flow.
June Lows Likely Before Sustained Recovery, According to Analyst Forecasts
Aylo’s base case suggests that while current support levels may hold in the immediate term, Bitcoin could form a slightly lower low in June before entering a more sustained rally phase. This timeframe matters because it implies near-term volatility and downside risk persist despite the recent bounce.
The forecast explicitly incorporates the possibility of broader equity market weakness dragging Bitcoin lower alongside stocks, a correlation pattern that remains embedded in institutional portfolio behavior.
The June window represents a critical inflection point because it separates tactical technical bounces from strategic value creation. If Bitcoin respects the current lows and the June forecast fails to materialize, bulls can claim the relief bounce is the beginning of sustained recovery.
Conversely, if BTC trades below current lows before June, it validates the distribution thesis and suggests the recent purchase-driven headlines masked deteriorating technicals.
Institutional traders should treat June as a decision point: confirmation of higher lows would suggest conviction buying above distribution phase resistance, while a lower low would suggest the bounce was precisely what oversold markets typically deliver before the real decline begins.
The sustainability question hinges not on acquisition volume but on whether support holds through spring weakness in equity markets.
Institutional investors should monitor Bitcoin’s price action relative to key support established in February and watch for either confirmation of higher lows or the June lower-low scenario outlined by Aylo. The next critical test arrives if broader equity markets experience additional weakness, which would test whether current BTC support levels hold or whether correlated selling resumes.
Max Trades’ distribution pattern thesis will resolve itself by mid-June: if Bitcoin holds above current levels and forms a higher low, the relief bounce narrative prevails; if BTC trades lower by June, the distribution structure has validated itself and substantive weakness likely continues, regardless of how many corporate purchase announcements arrive.
Liquidation Cascade Risk Recedes as Strategy’s 32 BTC Sale Loses Near-Term Urgency
The forced liquidation of Strategy’s 32 BTC position, which initially triggered cascading sell-side pressure and amplified downside volatility in early March, has become materially less acute as Bitcoin stabilized above key support levels.
When the position first began unwinding, market participants modeled the sale as a potential 500-1,000 BTC equivalent forced liquidation depending on execution speed and market depth, creating a near-term bearish catalyst that compounded technical weakness.
Current price stabilization has reduced immediate liquidation risk, removing what institutional traders viewed as a binary downside trigger with defined timing and size.
The reassessment of liquidation risk carries portfolio implications for institutions hedging tail-risk exposure. Macro funds that had added hedges or reduced long exposure specifically to guard against a 10-15% cascade now face the question of whether to maintain those hedges or redeploy capital at current levels.
Unlike headline-driven narratives, which shift with media cycles, liquidation events create quantifiable execution risk with defined time horizons and price targets that institutional risk managers can model with precision.
Market monitoring services tracking large-position movements will be critical in confirming whether the Strategy position continues unwinding gradually or if additional sell-side pressure emerges at resistance levels between $43,000 and $45,000. Any resumed acceleration in the liquidation process would likely re-trigger the bearish technical setup that preceded February’s breakdown.