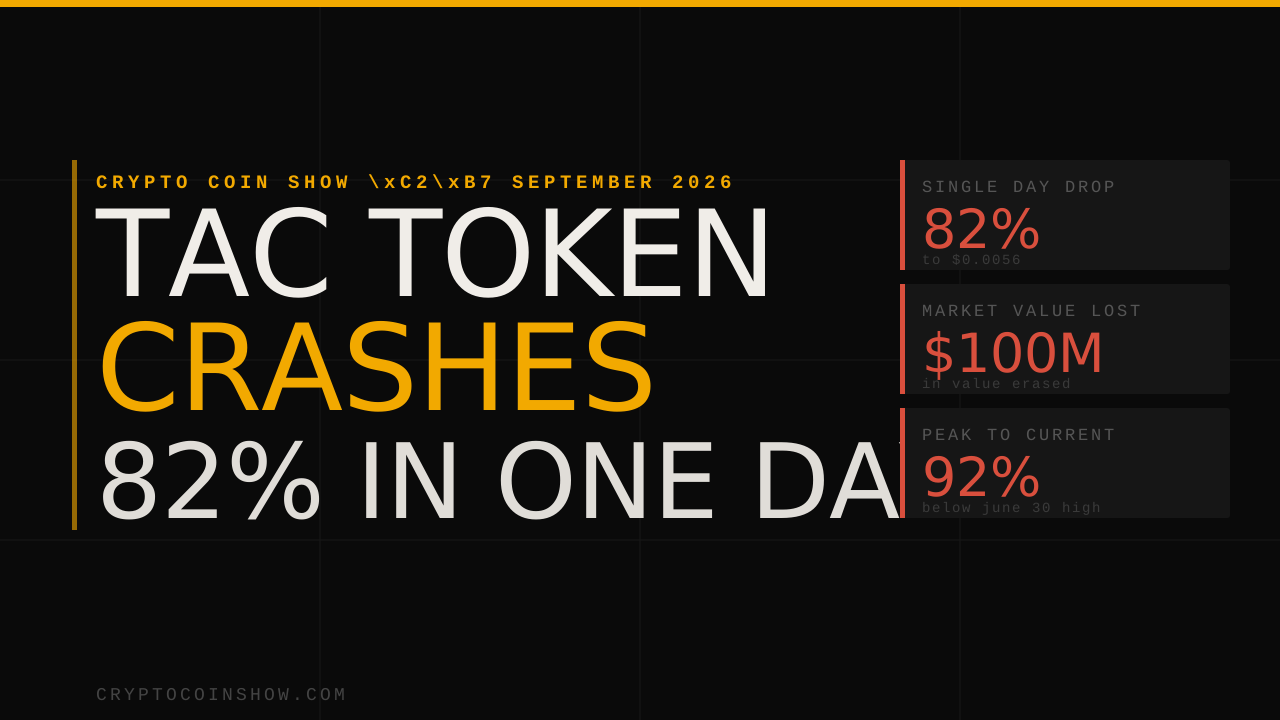
TAC Protocol’s token fell about 82% in 24 hours to around $0.0056, wiping out most of its market value two months after a $2.8 million bridge hack, that the team reclassified as a white-hat incident.
The token last traded at $0.005596, down 81.8% on the day, with its market cap also down to about $26.2 million. TAC hit an intraday high of $0.05285 and a low of $0.005103. Trading volume hit $66.6 million over the same period, over ten times the level from the previous day, a sure sign of heavy turnover.
The slide cut whatever gains TAC made in recent times. It had set a record of $0.06688 on June 30, roughly a week before the crash. At current prices, the token trades about 92% under that peak.
TAC’s claim to fame is that it is the first EVM-compatible blockchain built for the TON ecosystem and Telegram. TAC launched its mainnet and native token in July 2025, with protocols like Morpho, Curve, and Euler deployed at go-live. And an $800 million liquidity campaign to go with it.
TAC is back in the headlines for the wrong reasons
The price rout drags attention back to a difficult spring. On May 11, an attacker carted away with $2.8 million from the TON side of TAC’s cross-chain bridge, hitting balances in USDT, BLUM, and tsTON, per Cryptopolitan’s earlier reporting. TAC halted the bridge and said its native token and ERC-20 assets were not touched.
By May 15, the team had positive news, reporting that the attacker had returned ~ 90% of the funds in a deal that allowed them to keep 10% of the loot.
As TAC proposed, it then dropped any plans of going to court and simply cast the event as a white-hat event, a decision it said it coordinated with security partners and law enforcement.
The bridge itself remained dark for weeks. TAC restored cross-chain transfers between TON and TAC on June 10 after it ensured its patched sequencer software had cleared an independent review by its auditor and TON ecosystem partners.
The team’s own disclosures also conceded that the fix produced 316 duplicate transactions.
Days before this week’s collapse, TAC pushed a network change. It told node operators on June 29 to install a v1.6.0 binary ahead of a June 30 upgrade at block 21,776,800.
No explanation or rationale for the selloff has been presented as of this report.
Readers holding TAC or building on the chain should keep an eye on the project’s X account for a statement on the crash and any follow-up on the June 30 upgrade.
Our GRAM (prev. TON) price prediction anticipates a high of $3.35 in 2026.
In 2028, it will range between $7.26 and $9.49, with an average price of $7.60.
In 2030, it will range between $17.71 and $20.42, with an average price of $18.27.
In June the TON community voted in favor of renaming Gram to Gram, with the ticker changing from GRAM (prev. TON) to GRAM. The change took effect at 12:00 UTC on June 15, 2026. The blockchain itself stays The Open Network. Only the token’s name, ticker, and logo change.
Our GRAM (prev. TON) price prediction expects Gram to reach a high of $3.35 in 2026, move above $10 in 2029, and climb to an average price of $37.37 by 2032. For traders, investors, and crypto enthusiasts tracking Gram, this forecast breaks down what GRAM (prev. TON) is, where its price stands now, how it has performed historically, and what technical analysis and market sentiment suggest for 2026 through 2032.
GRAM (prev. TON) (The Open Network) is a decentralized protocol developed by Telegram for the community. The protocol is a distributed supercomputer, or “super server,” comprising GRAM (prev. TON) Blockchain, GRAM (prev. TON) DNS, GRAM (prev. TON) Storage, and GRAM (prev. TON) Sites. The native token for the GRAM (prev. TON) ecosystem is called Gram (TON).
Gram is the native cryptocurrency of The Open Network and is used for transactions, digital payments, and network-level services, including Telegram Premium and ad purchases.
That Telegram integration gives GRAM (prev. TON) access to more than 900 million monthly active users and supports broader ecosystem growth, which is one reason GRAM (prev. TON) price predictions matter when evaluating future demand. In a volatile crypto market, where market capitalization and sentiment can shift quickly, understanding the factors that influence TON’s value can help readers make more informed investment decisions.
Gram price movements are shaped by supply and demand, and by fundamental factors such as hacks or other market events, which can quickly shift sentiment.
Large holders, or whales, can influence short-term price movements and volatility in the GRAM (formerly TON) market.
GRAM on July 4, was up 7.87% in 24h and 3.01% in 30 days. Its short-term current forecast is based on technical factors and broader market conditions.
GRAM (prev. TON) turned bullish this week after hitting support levels at $1.50. The correction was accompanied by rising trading volumes.
Each candle shows the opening, closing, highest, and lowest prices for the session. The latest candlestick pattern on candlestick charts suggests an undecided market – short candles.
Traders use this price action view and indicators such as the RSI to gauge momentum. The Relative Strength Index (RSI) is a momentum oscillator: readings above 70 can signal overbought conditions, and below 30 can signal oversold conditions, while the current RSI of 60.37 points to a neutral market.
The 4-hour chart shows GRAM (prev. TON) consistently producing long candles this week, with positive market momentum. Many traders watch this timeframe for short-term moves and near-term market trends. Traders are now watching to see whether GRAM (prev. TON) holds above the $1.80 psychological support level, as a drop below $1.70 could restore downward momentum. In the coming days and into next week, direction will likely depend on whether GRAM (prev. TON) can defend that level and reverse from overbought territory. Its RSI is at 71.55.
GRAM (prev. TON) technical indicators: Levels and action
In technical analysis, moving averages use the average closing price over selected periods to help spot support levels and resistance levels.
Daily simple moving average (SMA)
Period
Value ($)
Action
SMA 3
1.63
BUY
SMA 5
1.61
BUY
SMA 10
1.59
BUY
SMA 21
1.62
BUY
SMA 50
1.73
BUY
SMA 100
1.62
BUY
SMA 200
1.54
BUY
Daily exponential moving average (EMA)
Period
Value ($)
Action
EMA 3
1.64
BUY
EMA 5
1.62
BUY
EMA 10
1.61
BUY
EMA 21
1.63
BUY
EMA 50
1.67
BUY
EMA 100
1.65
BUY
EMA 200
1.73
BUY
What to expect from the GRAM (prev. TON) price analysis next?
If GRAM (prev. TON) fails to hold above $1.80, it could retest lower support at $1.70, setting near-term price targets around that zone. The relative strength index remains neutral, and a correction is likely before another run, though the current technical setup does not yet confirm renewed downward momentum. Multiple technical quantitative indicators and moving averages support a neutral GRAM (prev. TON) forecast over the short term.
Is GRAM (prev. TON) a good buy?
According to Cryptopolitan price predictions, GRAM (prev. TON) will trade higher in the years to come. However, both technical analysis and fundamental factors can support or invalidate this bullish case for investors deciding whether to buy Gram. Even so, GRAM (prev. TON) remains highly risky, so readers should conduct thorough research before making any investment decision.
Will GRAM (prev. TON) reach $10?
Yes, GRAM (prev. TON) should rise above $10 in 2029. The move will come as the market recovers to previous highs.
Will GRAM (prev. TON) reach $100?
Per the Cryptopolitan price prediction, GRAM (prev. TON) is unlikely to reach $100 before 2031.
Will GRAM (prev. TON) reach $1,000?
According to the Cryptopolitan price prediction, GRAM (prev. TON) is unlikely to reach $ 1,000 before 2031.
Does Gram have a future?
GRAM (prev. TON) has been on a bullish run since its inception, despite seasonal market corrections. Future growth will depend in part on the development of more decentralized applications, decentralized storage, and mini apps on the GRAM (prev. TON) network within the Telegram ecosystem, where Gram enables smart contracts for various applications and supports real-world utility. Gram also serves as a fee for cross-chain transactions. The GRAM (prev. TON) blockchain has a vibrant community of users and developers, with access to a broad base of Telegram users. Looking ahead, Gram has the potential to trade higher in the coming years.
Recent news
Recent developments include Pavel Durov’s Telegram post alleging that Reliance, an Indian telecom Company, is sabotaging access to Telegram for millions of users outside India, including in the UAE, through a rogue method called BGP hijacking. The sabotage, according to the post, is intentional, as Reliance ignored multiple reports.
GRAM (prev. TON) price prediction July 2026
The GRAM (prev. TON) July price prediction is an expected range of $1.67 to $2.30. It will average at $1.32.
Period
Potential low ($)
Potential average ($)
Potential high ($)
July
1.67
1.32
2.30
GRAM (prev. TON) price prediction 2026
As 2026 unfolds, GRAM (prev. TON) remains bullish, as evidenced by higher price highs. The price will range between $0.97 and $4.35. The average price for the month will be $2.23.
Year
Potential low ($)
Potential average ($)
Potential high ($)
2026
0.97
1.63
3.35
GRAM (prev. TON) price prediction 2027-2032
Year
Potential low ($)
Potential average ($)
Potential high ($)
2027
4.48
4.80
5.71
2028
7.26
7.60
9.49
2029
11.84
12.22
14.29
2030
17.71
18.27
20.42
2031
24.31
25.16
30.81
2032
35.21
37.37
45.12
GRAM (prev. TON) price prediction 2027
The GRAM (prev. TON) token prediction climbs even higher into 2027. According to the prediction, Gram’s price will range from $4.48 to $5.71, with an average of $4.80.
Gram (TON) price prediction 2028
The analysis suggests a further acceleration in TON’s price. GRAM (prev. TON) will trade between $7.26 and $9.49. It will average at $7.60.
GRAM (prev. TON) price prediction 2029
According to the Gram forecast for 2029, the price of GRAM (prev. TON) will range from $11.84 to $14.29, with an average of $12.22.
GRAM (prev. TON) price prediction 2030
The GRAM (prev. TON) price prediction for 2030 is $17.71 to $20.42. The average price of Gram will be $18.27.
GRAM (prev. TON) price prediction 2031
The Gram price forecast for 2031 has a high of $30.81. However, when the market corrects, GRAM (prev. TON) will reach a minimum price of $24.31 and an average of $25.16.
GRAM (prev. TON) price prediction 2032
The year 2032 will experience more bullish momentum. According to the GRAM (prev. TON) price prediction, it will range between $35.21 and $45.12, with an average trading price of $37.37.
Our predictions indicate that GRAM (prev. TON) will reach a high of $3.35 in 2026. In 2028, it will range between $7.26 and $9.49, with an average of $7.60. In 2030, it will range between $17.71 and $20.42, with an average of $18.27. Note that the predictions are not investment advice. Seek independent professional consultation or do your research before making any investment decision. Crypto assets are highly risky, and there may be limited regulatory recourse for losses from such transactions.
GRAM (prev. TON) is the native cryptocurrency of the GRAM (prev. TON) network, which launched in 2018 as the Telegram Open Network before being renamed and taken over by the GRAM (prev. TON) Foundation. Its ties to the Telegram ecosystem provide access to a large user base.
In June 2020, all Gram tokens (98.55% of the total supply) became available for mining, further widening access to that user base.
The tokens were placed in special Giver smart contracts, enabling anyone to mine until 28 June 2022. Users mined around 200,000 GRAM (prev. TON) daily.
All the tokens were mined in two years, marking the completion of the distribution event.
On September 20, 2021, GRAM (prev. TON) reached its all-time low of $0.3906.
Its first significant break came in November 2021. Over the past few days, the coin has slid from $0.8 to $4.5.
It corrected in 2022, reaching a low of $0.9.
In 2023, it ranged between $1.1 and $2.5.
In 2024, it registered another bull run, rising from $2.11 to its all-time high of $8.24 on Jun 15, 2024.
It corrected later, trading at $ 5.20 in October and $4.98 in November, when it began to recover.
The recovery saw the coin rise above $6.5 in December.
It then crossed into 2025, trading at $5.5. From there, it entered a bear market, falling below $3.8 in February and $3.0 in May. It crossed into June at $3.20 and maintained that level into August. In October, it fell to $3.00, and in November to $2.50.
In December, it traded at $1.60 and rose above $1.80 in January 2026. The trend reversed in February, falling below $1.40. In May, at $1.35. In June, it crossed above $1.50, and in July, it crossed above $1.80.
Binance founder Changpeng Zhao (CZ) floated freezing Satoshi’s Bitcoin and other dormant, quantum-vulnerable coins if they stay unmoved after a future network upgrade. He raised it as a question for the community, not a personal plan.
The Binance executive shared the idea on the Galaxy Brains podcast with Galaxy Research head Alex Thorn. He has since pushed back on reports that he would personally freeze Satoshi Nakamoto’s address for a year.
Is Freezing Satoshi’s Bitcoin a Good Idea?
The debate grew louder in March, when Google Quantum AI published research on breaking the cryptography that secures digital signatures.
Its team estimated an attack could need fewer than 500,000 qubits and run in minutes, well below earlier projections.
The risk sits in exposed keys. A quantum computer could derive private keys from public keys, then drain the wallets they protect.
More than a third of all Bitcoin had revealed a public key on-chain by March. That leaves them in addresses vulnerable to quantum theft.
Satoshi Nakamoto mined an estimated 1.1 million BTC in 2009 and 2010. That estimate rests on the Patoshi pattern traced by researcher Sergio Demian Lerner.
Bitcoin Price Performance. Source: BeInCrypto
At Bitcoin’s current market price near $63,244, that hoard is worth roughly $70 billion.
What CZ Actually Said
Zhao did not call for a seizure, nor did he say Binance would act. He put the decision to the community, asking why it should not set a roughly 1-year timeline.
Coins left in vulnerable addresses after that point would be locked in by a fork.
CZ said the popular take that he would personally freeze Satoshi’s address was not quite right. He also flagged a snag, that telling Satoshi’s wallets apart from other early miners is hard.
Just my personal view.
(I cringe when listening to myself. 🤣 I wish I can learn to say things more succinctly in the future.) https://t.co/RxrjyFNCyb
His thinking aligns with BIP-361, a draft by Jameson Lopp and five other researchers. It would block sends to vulnerable addresses about three years after activation, then void legacy signatures two years later.
The authors frame a blunt choice. A quantum thief could grab the exposed coins, or miners could slowly recover them. The network could instead lock them so no one wins.
That proposal even cites Bitcoin’s creator on the issue of lost coins.
“Lost coins only make everyone else’s coins worth slightly more. Think of it as a donation to everyone,” Satoshi Nakamoto, as quoted in the proposal.
The dormant coins are contested on another front. An anonymous plaintiff and two Wyoming LLCs are fighting a New York abandoned-property lawsuit.
They want 39,069 idle addresses, including the Satoshi coins, declared theirs. A Galaxy report by Thorn doubts it will prevail.
Any forced lock still violates a core Bitcoin rule: no one can take another person’s coins. Many would read it as confiscation.
CZ said there is no perfect answer. He warned that doing nothing could prove the worst outcome of all.
Our Pi network price prediction anticipates the Pi price reaching a maximum of $0.5695 by 2026.
In 2032, the Pi price prediction projects a maximum of $1.71.
Pi Network began as a mobile-focused crypto project designed to make digital assets accessible to everyday users. After reaching an all-time high of $2.98 in February 2025, Pi declined sharply and later hit a low of $0.1187 in June 2026 amid weakening demand and limited market liquidity.
Recently, the network accelerated ecosystem development. Major updates include a new Pi App Studio feature that allows developers to import AI-generated apps from platforms like Replit, Cursor, and Claude Code directly into the Pi ecosystem with integrated Pi SDK tools and payments.
Pi Network also expanded its reach in the United States after OKX made Pi be adopted by millions of users and launched Protocol 24 following the successful upgrade to Protocol 23.
What does the future hold for Pi Network, and where could the PI price head next? As investors monitor market sentiment, ecosystem growth, and network upgrades, let’s explore our Pi Network price prediction and technical analysis for 2026–2032.
Overview
Cryptocurrency
Pi Network
Ticker Symbol
Pi
Price
$0.1345
Price Change 24h
3.1%
Market Cap
$1.44 billion
Circulating Supply
10.64B PI
Trading Volume 24h
$7.9 million
All-Time High
$2.98, Feb 26, 2025
All-Time Low
Jun 06, 2026 $0.1187
Pi Network Price Prediction: Technical Analysis
Metric
Value
Current Price
$0.1345
Price Prediction
$ 0.1102 (-24.96%)
Fear & Greed Index
29 (Fear)
Market Sentiment
Bearish
Volatility
8.31% (High)
Green Days
13/30 (43%)
50-Day SMA
$ 0.1667
200-Day SMA
$ 0.1881
14-Day RSI
38.59 (Neutral)
Pi Price Analysis
Today’s PI price analysis shows PI trading at $0.1345, with buyers attempting to regain control
Over the last 24hours pi price has risen by around 3.1% after a recovery from yesterday’s pullback
Pi network’s immediate resistance is at $0.1350, and support at $0.1300
As of June 19, 2026, Pi Network price analysis shows a short-term bullish recovery with the price rising to $0.1345 after attracting fresh buying interest. The bulls have regained the momentum from the previous two days’ sell-off, with the latest daily candle pushing PI back toward the week’s highs. The market is still in a cautious trend, but today’s recovery suggests buyers are again testing overhead resistance. At the time of writing, the market sentiment is slightly bullish, with the bulls attempting a recovery above the $0.1300 support zone.
Pi price analysis 1-day chart
The one-day price chart for Pi Networks confirms buyers have returned to the market after the recent correction.PI has recovered from the $0.1300 level and is now trading around $0.1345 after missing out on significant gains during the last two sessions.
The latest green candlestick shows the bulls appear to be trying to retest this week’s highs with renewed buying pressure. However, the price is still below the $0.1350 resistance level, which has seen sellers break out in recent trading sessions.
The 24-hour trading volume rose to $7.9 million, which is a 15.98% rise in trading activity, and the market cap of $1.44 billion indicated that bulls are trying to resume the recovery with a renewed buying interest.
PI/USDT Chart: TradingView
The RSI (14) has bounced back from its lows to 45.96 and is heading deeper into the green, but still below the neutral level of 50. That means, bearish momentum has weakened, but buyers still need stronger momentum to confirm a broader trend reversal.
The MACD indicator is looking positive. The MACD line is at 0.0017, and the line signal is at -0.0046. The positive histogram is increasing, suggesting the bulls are gradually getting the upper hand from their recent pullback, but they need to breach the resistance to confirm their dominance.
The immediate resistance level is at $0.1350. If PI can break out above this, the resistance at $0.1400 could be a target, with the stronger resistance at $0.1450. Immediate resistance is at $0.1300 and $0.1260, which is the next major support zone for bulls, in a bid to hold onto the recovery.
Pi Price Analysis 4-Hour Chart
On the 4-hour chart, PI is trading at $0.1339 with buyers regaining momentum after defending the $0.1300 support level. After a brief correction from the recent high at $0.1365, the bulls have returned to the market, driving it back towards immediate resistance.
The formation of higher lows over the last few sessions also indicates a short-term bull market sentiment, but PI will need to break overhead resistance to validate a bull market continuation.
RSI (14) is up to 55.58, which is comfortably above the neutral 50 level and is pointing to a strengthening buying momentum. The indicator continues to stay well below the overbought level, and thus has further room to rise if the buyers continue to prevail. The RSI is also still above its signal average at 46.27, which further backs the positive sentiment in the short term.
PI/USDT Chart: TradingView
The MACD is still in bull territory. The MACD line is currently at 0.0002, the signal line at 0.0001, and the histogram is just slightly positive at 0.0001. The bullish crossover has formed, which shows that the overall momentum is improving, but the histogram is still quite low, meaning that buyers are not yet able to create any clear breakout, as there is not enough volume to support the move.
Resistance on the short-term 4-hour chart is at $0.1350, and then a stronger barrier of resistance is around $0.1370 and $0.1380. The support level is at $0.1300 if there is selling pressure, and the next support will be at $0.1280. A significant move above $0.1350 might extend bullish momentum, while a move below $0.1300 may improve the short-term momentum for sellers, heading towards $0.1400.
Pi Network Price Prediction: Levels and Action
Daily Simple Moving Average (SMA)
Period
Value
Action
SMA 3
$0.1451
SELL
SMA 5
$0.1450
SELL
SMA 10
$0.1466
SELL
SMA 21
$0.1544
SELL
SMA 50
$0.1667
SELL
SMA 100
$0.1759
SELL
SMA 200
$0.1881
SELL
Daily Exponential Moving Average (EMA)
Period
Value
Action
EMA 3
$0.1461
SELL
EMA 5
$0.1459
SELL
EMA 10
$0.1476
SELL
EMA 21
$0.1536
SELL
EMA 50
$0.1634
SELL
EMA 100
$0.1736
SELL
EMA 200
$0.2132
SELL
What to expect from the next Pi price analysis?
If buyers maintain momentum and push PI above the $0.1350 resistance, the token could extend its recovery toward the $0.1400 psychological level in the near term. However, failure to hold above $0.1300 could invite renewed selling pressure, potentially dragging the price back toward the $0.1280 support zone.
Why is PI’s price up today?
Pi Network is up today as positive sentiment surrounding ongoing ecosystem development and upcoming initiatives, including Pi2Day, boosted investor confidence amid a broader recovery in the altcoin market. However, trading volume remains relatively subdued, suggesting the rally will need stronger buying activity to sustain a breakout above the $0.14–$0.15 resistance zone.
Is Pi a Good Investment?
Pi is a high-risk, speculative investment that could offer upside if its ecosystem grows and adoption increases. However, its price remains volatile and dependent on overall market conditions, so investors should be prepared for uncertainty.
The project’s long-term success will largely depend on factors such as Mainnet adoption, developer activity, ecosystem utility, exchange accessibility, and the network’s ability to attract and retain active users. Recent developments, including Pi App Studio enhancements, protocol upgrades, and expanding exchange support, have strengthened the project’s fundamentals, but the token still faces challenges related to liquidity, supply expansion, and market sentiment.
As with any cryptocurrency investment, investors should conduct their own research, assess their risk tolerance, and avoid investing more than they can afford to lose. While Pi has growth potential if adoption continues to expand, it remains a speculative asset with significant upside and downside risks.
Will Pi Price Reach $5?
At the current pace of development and given its total PI supply circulating supply of over 8 billion PI, Pi Network’s long-term value will largely depend on user base growth and broader acceptance of cryptocurrencies in mainstream finance, making $5 unlikely in the near term. The maximum supply of Pi tokens is 100 billion, and ongoing unlocks create significant selling pressure that must be absorbed by demand, while ecosystem growth remains high risk unless developers and users create real utility through DApps or merchant integrations.
Multiple technical quantitative indicators and fundamental factors, such as delayed mainnet launch and maximum supply constraints, suggest that Pi’s price may fluctuate within lower ranges before any major uptrend. Real-world utility will be crucial for supporting demand and helping determine whether Pi can reach higher price targets. A $5 target would require sustained adoption, significant on-chain activity, and strong market demand that is not yet present.
Will Pi Reach $10?
Reaching $10 would represent a massive increase in Pi’s market cap, something that is not expected soon under current crypto market conditions. The $10 mark is considered an upper price target or the high end of speculative forecasts. Most models forecast a price range for Pi Network between $0.14 and $0.56 by the end of 2026, representing the lower end and high end of current predictions.
Analysts suggest that even optimistic forecasts place this milestone more than a decade away, if at all. Investors should treat such projections as speculative investment advice and conduct their own research before making investment decisions, as Pi remains a high-risk asset with uncertain long-term value.
Does Pi Network Have a Good Long-Term Future?
Pi Network’s long-term prospects depend on its ability to convert its large user base into active ecosystem participants. If developer adoption, merchant integration, and real-world use cases continue to expand, the project could strengthen its position within the cryptocurrency market.
However, investors should also consider risks related to token supply growth, market competition, regulatory developments, and overall crypto market conditions. As with any digital asset, future performance will
Recent Pi News/Opinions
Pi Network has announced a major protocol upgrade requiring all Mainnet nodes to update to version v24 as part of its ongoing infrastructure transition. The update comes alongside the rollout of Pi Node v0.5.4 and reinforces the network’s shift toward a more user-centric decentralized model, where desktop nodes help validate transactions using the Stellar Consensus Protocol.
The Pi Mainnet is upgrading to Protocol 24 – Deadline: June 2.
The Pi Mainnet has successfully upgraded to Protocol 23. All Mainnet nodes are required to complete this step before the deadline to remain connected to the network.
Pi Network says the CiDi Games beta app on Pi Browser pulled in more than 81,000 users within its first week, with over 1.2 million game sessions recorded across 160 regions. The platform is a portfolio company of Pi Network Ventures, which made a direct investment in CiDi Games as part of a broader push to expand real-world utility for the $PI token.
CiDi Games organically reached over 81,000 users across 160+ countries in less than a week after launching its beta in the Pi ecosystem.
That led to: 1.2M+ game sessions 21,000+ tournament participants 3.19M+ Pi staked by the community to support the platform.
The Pi Core Team confirmed protocol v24 completed successfully, describing it as one of the most challenging migrations in Pi Network’s history. The upgrade covers off-chain integration as part of the broader roadmap toward v25 on June 18 and v26, which targets full commercial openness.
Network Update: Upgrade to protocol 24 has been completed successfully.
Great job to all Nodes! This was one of the most challenging migrations.
Pi Network released a user-experience update to its Ecosystem Directory Staking feature. The redesign makes the process of staking PI to boost app rankings in the Pi Browser more intuitive. The core mechanic remains unchanged: users lock their tokens to promote apps and receive their full stake back after a set period, with no protocol-level rewards.
Pi Price Prediction June 2026
In June 2026, Pi’s price may average around $0.1376 as the market continues to stabilize following recent volatility. A recovery toward $0.1500 could occur if buying interest strengthens, while sustained bearish pressure may see PI consolidate near a minimum of $0.1251.
Pi Price Prediction
Potential Low
Potential Average
Potential High
Pi Price Prediction June 2026
$0.1251
$0.1376
$0.1500
Pi Price Prediction 2026
The price of 1 Pi is expected to reach a minimum level of $0.1200 in 2026. The network Pi price, which refers to the projected future price of Pi Network for 2026, can reach a maximum level of $0.5695, with
Pi Price Prediction
Potential Low ($)
Potential Average ($)
Potential High ($)
Pi Price Prediction 2026
$0.1200
$0.3593
$0.5695
Pi Price Predictions 2027-2032
Year
Minimum Price ($)
Average Price ($)
Maximum Price ($)
2027
$0.1987
$0.2273
$0.256
2028
$0.4657
$0.5274
$0.5891
2029
$0.6120
$0.6900
$0.7680
2030
$0.7477
$0.8216
$0.8950
2031
$0.9825
$1.07
$1.16
2032
$1.34
$1.52
$1.71
Pi Price Prediction 2027
The Pi price is forecast to reach its lowest possible level of $0.1987 in 2027. According to the latest Pi Network forecast for 2027, analysts predict the price could fluctuate between $0.1987 and $0.256, reflecting both potential growth and volatility in the market.
Pi Price Prediction 2028
In 2028, the price of Pi is predicted to reach a minimum level of $0.4657. The PI price can reach a maximum level of $0.5891, with the average trading price of $0.5274.
Pi Price Prediction 2029
In 2029, Pi’s price is projected to reach a minimum of $0.6120. The PI price could rise to a maximum of $0.7680, with an average trading price of $0.6900 throughout the year.
Pi Price Prediction 2030
In 2030, Pi is forecast to trade at a minimum level of $0.7477. Recent price analysis of Pi today provides valuable insights into its current value and helps inform these long-term investment predictions. The PI price could reach a maximum of $0.8950, with an average forecast price of $0.8216.
Pi Price Prediction 2031
In 2031, Pi’s price is expected to hold a minimum value of $0.9825. When considering Pi Network today, its current value and market trends provide a foundation for projecting its future value, including the 2031 forecast. The PI price could climb to a maximum of $1.16, with an average trading value of $1.07.
Pi Price Prediction 2032
In 2032, Pi is expected to reach a minimum price of $1.34. The PI price could rise to a maximum of $1.71, with an average value of $1.52.
Pi Network Price Prediction 2027-2032
Pi Network Price Prediction: Analysts’ Pi Price Forecast
Firm Name
2026
2027
Coincodex
$0.1468
$0.1468
DigitalCoinPrice
$ 0.2310
$ 0.2420
Cryptopolitan’s Pi Price Prediction
At Cryptopolitan, we remain cautiously bullish on the long-term outlook for Pi Network despite recent volatility in the cryptocurrency market. Based on our Pi Network price prediction, the current price could gradually recover as ecosystem adoption, trading volume, market capitalization, and utility continue to grow. Our forecast suggests PI could trade between $0.1440 and $0.5695 in 2026, with an average price of $0.3593. However, future price movements will depend on market sentiment, circulating supply growth, technical analysis indicators, and the network’s ability to attract users, developers, and real-world applications.
Pi Historic Price Sentiment
Pi Price History: Coinmarketcap
Pi Network launched in 2019 with mobile mining and operated in a closed ecosystem with no official market price, as tokens couldn’t be traded externally.
Between 2023 and 2024, Pi remained unlisted, with speculative prices ranging between $0.60 and $1.00 in unofficial markets.
In February 2025, Pi reached an all-time high of $2.98 following initial listings and increased public speculation.
In March 2025, Pi’s price dropped sharply after instability followed the final KYC verification deadline, trading between $1.85 and $0.90 during the decline.
In April 2025, Pi Network hit its all-time low (ATL) of $0.4012 on April 5.
From May to August 2025, Pi declined after failing to hold gains near $1.67, with token unlocks and weak demand pushing the price lower toward the $0.34 and $0.44 range.
In September 2025, Pi fell to a new all-time low of $0.2234 before recovering slightly to the $0.25–$0.28 range.
On October 11, 2025, Pi Network hit a new all-time low of $0.1585, reflecting the peak of a prolonged market crash and severe selling pressure.
Between November and December 2025, Pi traded mostly between $0.20 and $0.26 as selling pressure eased, but recovery remained weak.
In early 2026, Pi fell further and reached a new all-time low of $0.1312 on February 11 before stabilizing.
By late March 2026, Pi traded between $0.17 and $0.19, showing gradual recovery and improving short-term stability.
By mid-April 2026, Pi Network is trading around the $0.17 and $0.172 range, maintaining sideways consolidation as the market shows signs of stabilization after recent volatility.
At the start of May 2026, Pi Network traded between $0.17 and $0.18, continuing its sideways consolidation as the market showed limited momentum following April’s stabilization phase.
By mid-May 2026, Pi Network dropped toward the $0.15 range, facing renewed selling pressure as traders reacted to migration-related volatility and weak market momentum.
By late May 2026, Pi Network is trading at around $0.1439, reflecting continued downside pressure after a steady decline from earlier consolidation levels.
By June 06, 2026, Pi Network hit a new all-time low of $0.1187, marking the lowest price in its trading history and confirming strong bearish control in the market.
The Aster DEX unveiled a huge change to its tokenomics on June 17, allocating 99% of fees generated through its platform to an ASTER token buyback, with one-to-one burns from its reserves for each token purchase.
The #48-ranked cryptocurrency witnessed a massive rebound shortly after the announcement but has since given back most of those gains.
DEX Pushes Token Buybacks to 99% of Fees
In a post on X, the YZ Labs-supported perp exchange said its upgraded tokenomics model went live at 12:00 PM UTC on June 17. Under the new framework, 99% of daily platform fees will be used to automatically buy back ASTER through time-weighted average price purchases executed throughout the day and settled on-chain.
Every token bought back will trigger an equal burn from Aster’s reserve, with the team allocation burned first, resulting in what they called a 198% buyback: 99% repurchased and 99% burned from reserve.
However, the coins that’ll be bought back won’t disappear. They’ll go directly to stakers after being added to the protocol’s Loyalty Reward pool, which already distributes 300,000 ASTER in every epoch.
And the burn target is quite significant. Recall that the DEX launched with a total supply of 8 billion tokens, and it intends to burn that down to 3 billion, meaning more than 60% of that supply has been earmarked for destruction.
CoinGecko states that the present circulating supply is at about 2.68 billion, while the total supply is 7.82 billion, so there’s still a long way to go before the burn target is reached.
Where ASTER Stands Now
News of the new tokenomics mechanism had an immediate effect in the market. It saw ASTER’s value jump 23%, going from around $0.64 to $0.79 per CoinGecko. But it has since given back a fair bit of that gain and was trading near $0.65 at the time of writing, almost 73% below its September 2025 all-time high of $2.41.
Back in December 2025, the exchange announced a similar repurchase program, but at the time, the plan was to allocate 80% of daily fees to hoover up the token.
That was split between automatic daily buys, which took 40% of the fees, while another 20% to 40% was to be held in a discretionary strategic reserve, allowing the platform to conduct targeted purchases based on market conditions.
That announcement also coincided with a brief price uptick, with ASTER spiking 30% to $1.30, buoyed by news that ex-Binance CEO Changpeng Zhao was holding more than $2.5 million worth of the cryptocurrency.
The new plan has removed the strategic reserve approach entirely and pushed allocation much higher, with nearly all platform fee revenue going into automatic buybacks.
Cardano’s price is expected to surpass $1.33 in 2026.
By 2029, ADAUSD could reach $4.72.
By 2032, Cardano might reach a maximum price of $4.46.
Cardano is a third-generation blockchain platform launched in 2017 by Ethereum co-founder Charles Hoskinson. Designed for decentralized applications and smart contracts, it uses Ouroboros—a unique, energy-efficient Proof-of-Stake consensus mechanism.
Cardano’s two-layer architecture separates transactions from smart contracts, enhancing scalability and flexibility. Its native cryptocurrency, ADA, is used for transaction fees, staking, and governance, allowing holders to influence the platform’s future. Emphasizing a research-driven, peer-reviewed development approach, Cardano aims to address challenges in blockchain, such as scalability and sustainability, making it a strong alternative to platforms like Ethereum.
Perhaps you’re wondering: with its innovative technology, can Cardano’s ADA reach new all-time highs soon?
Let’s uncover what the future holds for Cardano.
Overview
Cryptocurrency
Cardano
Token
ADA
Price
$0.1671
Market Cap
$6.08B
Trading Volume (24-hour)
$289.31B
Circulating Supply
44.99B ADA
All-time High
$3.10 on Sept 02, 2021
All-time Low
$0.01735 on Oct 01, 2017
24-hour High
$0.1737
24-hour Low
$0.1659
Cardano price prediction: Technical analysis
Metric
Value
Volatility (30-day Variation)
16.86% (Very High)
50-day SMA
$ 0.2337
14-Day RSI
30.44 (Neutral)
Market Sentiment
Bearish
Fear & Greed Index
18 (Extreme Fear)
Green Days
9/30 (30%)
200-day SMA
$ 0.2977
Cardano (ADA) price analysis
Cardano is down 2.91% at $0.167, hitting fresh 2026 lows with sellers firmly in control across all timeframes.
Price briefly touched $0.145 before a weak bounce, now consolidating between $0.165 and $0.175 with little buying conviction.
Bulls need a reclaim of $0.180 to signal relief; failure risks a drop toward $0.140.
Cardano price analysis 1-day chart: Cardano slides to $0.167 as bears push ADA to fresh 2026 lows
Cardano is trading at $0.167, down 2.91% on the day, hitting fresh 2026 lows after a devastating June sell-off from the $0.240 range. The 1D structure is deeply bearish, with price breaking below the $0.175 horizontal support — a level that had previously acted as a floor — signaling accelerated selling pressure.
The overall trend shows a prolonged downtrend from January’s $0.440 peak, with no meaningful recovery attempts. Today’s candle confirms sellers remain in complete control. Immediate support is thin, with $0.150 as the next major level to watch. A reclaim of $0.180 is needed before any bullish case can be considered.
ADA price analysis 4-hour chart: Cardano consolidates at $0.167 as the 4-hour chart signals a fragile recovery attempt
ADA’s 4H chart shows price at $0.167, completely flat at 0.00%, consolidating after an aggressive June sell-off that briefly pushed price to $0.145 lows. The 4H structure reveals a steep descending channel throughout May and June, with no meaningful counter-rally until the recent bounce from all-time 2026 lows.
Price is now attempting to stabilize around the $0.165–$0.175 range, but the recovery lacks momentum. The $0.180 horizontal level remains a key resistance barrier from prior support. A 4H close above this level is needed to signal short-term relief. Below $0.155, selling pressure could intensify toward $0.140 — uncharted 2026 territory.
ADA technical indicators: Levels and action
Daily simple moving average (SMA)
Period
Value
Action
SMA 3
$0.2340
BUY
SMA 5
$0.2340
SELL
SMA 10
$0.2380
SELL
SMA 21
$0.2477
SELL
SMA 50
$0.2519
SELL
SMA 100
$ 0.2569
SELL
SMA 200
$0.3143
SELL
Daily exponential moving average (EMA)
Period
Value
Action
EMA 3
$0.2331
BUY
EMA 5
$0.2345
SELL
EMA 10
$
SELL
EMA 21
$ 0.2544
SELL
EMA 50
$ 0.2574
SELL
EMA 100
$ 0.2780
SELL
EMA 200
$ 0.3483
SELL
What to expect from the Cardano price analysis next?
Following the 1D and 4H breakdowns, the next step would be a 1-hour chart analysis, zooming in on the immediate price action and short-term momentum around the critical $0.165–$0.175 consolidation zone. After that, a key levels summary pulls together the most important support and resistance levels across all timeframes for quick reference. The analysis then moves into a price prediction section, weighing the deeply bearish technical structure against any potential fundamental catalysts that could trigger a recovery. Finally, a conclusion summarizes the overall market bias, helping readers assess whether ADA at $0.167 represents a capitulation buying opportunity or a warning of further downside.
Why is Cardano down today?
Cardano is down today due to a mix of poor price action and deep concerns about the ecosystem. On the charts, ADA has been in a relentless downtrend since January’s $0.440 peak, with sellers breaking every support level in sight. TapTools, a long-standing Cardano analytics platform, shut down after citing unsustainable operating conditions, while founder Charles Hoskinson warned of a potential “wave of failures” and criticized the community’s reluctance to deploy treasury funds to support projects. Adding to the pain, the community voted against funding Cardano’s own flagship 2026 Summit, forcing its cancellation — deepening the confidence crisis already reflected in today’s price.
Is Cardano a good investment?
Cardano (ADA) presents a mixed investment opportunity. It is a third-generation blockchain that aims to solve scalability issues and enhance security through its Proof-of-Stake mechanism. While some analysts predict significant price increases by 2030, others caution that it remains a high-risk investment given the volatility of the crypto market.
Investors should consider their risk tolerance and research before investing, as Cardano’s future performance is uncertain and contingent on market conditions and technological advancements.
Will Cardano recover?
Cardano’s recovery potential depends on market sentiment and adoption. Despite past challenges, its projected price increase in 2026, potentially reaching $1, has significantly bolstered confidence in the coin’s future.
Will Cardano reach $5?
Cardano hitting $5 seems quite achievable given past levels. With its ATH around $3.10, $5 would only need to beat that peak by about 60%. A solid bull run and significant adoption could drive the unit price to $5.
Will Cardano reach $10?
Cardano hitting $10 is a long shot. Its all-time high was around $3.10 back in 2021, so $10 would mean more than tripling that peak. At current prices, that’s an over 13x jump. While crypto can be unpredictable, that would need massive adoption and a bull run far beyond what we saw in 2021.
Will Cardano reach $50?
Cardano hitting $50 is extremely likely. With ADA’s current supply of around 35 billion tokens, a $50 price would require a market cap of approximately $1.75 trillion. Even in crypto’s craziest bull runs, that kind of valuation doesn’t happen for altcoins.
What is the Cardano forecast for 2040?
Predicting Cardano’s (ADA) price in 2040 is highly speculative as it depends on multiple factors, including adoption, regulatory developments, technological advancements, and macroeconomic conditions. However, if Cardano continues to develop its smart contracts, decentralized applications (dApps), and blockchain efficiency, it could see widespread adoption, driving its price higher.
Some optimistic projections suggest that ADA could reach double-digit prices, possibly ranging from $10 to $50 or more. However, in a bearish scenario, where regulatory hurdles and competition slow its progress, ADA could struggle to maintain high valuations.
What will be the future price of Cardano in 2050?
Predicting Cardano’s (ADA) price in 2050 is highly speculative, but if blockchain adoption continues to grow and Cardano successfully scales its smart contract ecosystem, its price could appreciate significantly. What that number will be remains to be seen.
Does Cardano have a good long-term future?
Cardano (ADA) has a positive long-term outlook, driven by its technological advancements and growing ecosystem. The platform’s unique features, such as its focus on scalability and partnerships with various institutions, position it well for future adoption. However, its success will depend on overcoming regulatory scrutiny and challenges related to developer engagement.
Recent news/opinion on Cardano
Cardano’s Plutus Cost Model Update Goes Live on Mainnet Ahead of Protocol Version 11 Hard Fork
Cardano’s Plutus Cost Model GA has launched on mainnet, enabling new Plutus V1, V2, and V3 primitives while requiring DRep and Constitutional Committee votes to activate additional features post-hard fork.
Plutus Cost Model update proposal now live on Mainnet!
Having progressed through SanchoNet, Preview and PreProd test networks during March, April and May respectively, the Plutus Cost Model GA is now live on Mainnet.
Cardano’s June 2026 forecast is $0.2193-$0.3169, averaging $0.2617, driven by steady network development, including smart contract enhancements and scaling upgrades. The growing use of Cardano-based DeFi, NFTs, and governance projects supports moderate bullish sentiment. However, cautious market conditions and slow institutional momentum may limit rapid price expansion, maintaining this controlled range.
Cardano Price Prediction
Potential Low
Potential Average
Potential High
Cardano price prediction June 2026
$0.2193
$0.2617
$0.3169
Cardano price prediction 2026
According to the Cardano price prediction, ADA might reach a maximum price of $1.33, with an average trading price of about $1.20 and a minimum price of $1.03
Cardano Price Prediction
Potential Low
Potential Average
Potential High
Cardano price prediction 2026
$1.03
$1.20
$1.33
Cardano price predictions 2027-2032
Year
Minimum Price
Average Price
Maximum Price
2027
$0.4838
$0.5282
$0.5725
2028
$1.19
$1.29
$1.39
2029
$3.71
$4.21
$4.72
2030
$1.73
$1.91
$2.09
2031
$2.33
$2.48
$2.63
2032
$3.81
$4.13
$4.46
Cardano price prediction 2027
Cardano’s price is forecast to reach a low of $0.4838 in 2027. According to analysts, the ADA price is expected to decline and could reach a maximum of $0.5725, with an average forecast of $0.5282.
Cardano price prediction 2028
The Cardano price is forecast to reach a minimum of $1.19 in 2028. According to the findings, the ADA price could reach a maximum of $1.39, with an average forecast price of $1.29. This is expected as network upgrades, DeFi expansion, and institutional integration strengthen ADA’s utility and demand, supporting steady long-term growth.
Cardano price prediction 2029
According to detailed market projections and historical trend analysis, Cardano (ADA) could trade at a minimum of $3.71 in 2029, reaching as high as $4.72, with an average price of $4.21.
Cardano price forecast 2030
Based on a comprehensive technical evaluation and market trends, Cardano (ADA) could bottom around $1.73 in 2030, with highs near $1.91 and an average of $2.09.
Cardano price prediction 2031
The price of 1 Cardano (ADA) is expected to increase slightly from previous years, reaching a minimum of $2.33 in 2031, with a potential peak of $2.63 and an average of $2.48.
Cardano price prediction 2032
According to the forecast and technical analysis, the ADA coin price prediction for 2032 is expected to range from a minimum of $3.81 to a maximum of $4.46, with an average of $4.13. This upward outlook is supported by Cardano’s full ecosystem maturity, large-scale enterprise integration, and increasing global adoption of decentralized applications built on its network, driving long-term demand and value appreciation.
Cardano price prediction 2026-2032
Cardano ADA price prediction: Analysts’ ADA price prediction
Firm Name
2026
2027
DigitalCoinPrice
$0.31
$0.31
Coincodex
$ 0.3915
$ 0.6216
Cryptopolitan’s Cardano price prediction
According to Cryptopolitan’s projections, ADA’s price could reach $0.35 in 2026. By 2027, Cardano’s price could trade at a maximum of $0.51.
ACH launched near $0.02 in 2020, surged to $0.1975 in August 2021, then slid below $0.10 by year’s end.
During 2022 and 2023, it fell to $0.0133, later rebounded toward $0.049, but stayed volatile
In 2024, it dropped to $0.0145, recovered above $0.02, and briefly reached $0.0397 in December.
Early 2025 saw swings between $0.016 and $0.040, before weakening again toward $0.020 by mid-year.
Late 2025 into early 2026 marked heavy losses to $0.0070–$0.0078, followed by stabilization near $0.0082.
In early January 2026, Cardano traded between $0.36 and $0.38 as buyers sought to stabilize the price after the December decline and defend support in the mid $0.30s.
By late January into February 7, the price slipped toward roughly $0.33 to $0.34, showing continued corrective pressure and consolidation near a key support zone.
Cardano traded around $0.40 on Jan 7, 2026, but steadily declined through the month, falling to roughly $0.29 by Feb 1 as selling pressure increased across the broader altcoin market.
The price briefly recovered afterward, rising from about $0.25 on Feb 5 to around $0.27 on Feb 7, showing a short-term rebound after the early February dip.
ADA began March around $0.29, attempting to stabilize after a sharp decline, with small consolidation candles forming near that level and a brief 5.8% surge on March 13 as broader crypto markets rallied — though the recovery lacked strong follow-through, with price still trading below all major moving averages throughout the month.
By late March, Hyperliquid’s HYPE token flipped ADA in market cap on March 18, adding bearish sentiment, and ADA dropped 4.8% on March 25 as part of a worldwide market sell-off — ultimately closing the period around $0.24 by April 3, representing a decline of roughly 17% over the month.
ADA entered April 1 around $0.24, having shed roughly 17% through March, driven by broad market selling and bearish sentiment, with the month’s forecast range sitting between $0.2251 and $0.3252.
By May 2, ADA was virtually flat at approximately $0.25, having spent the entire period consolidating in a narrow range with 50% green days and just 1.96% price volatility, reflecting a market stuck in indecision with no meaningful breakout in either direction.
ADA entered May 2 trading around $0.25, consolidating near multi-month lows after a prolonged downtrend from the January highs near $0.44, with bears firmly in control and the token struggling to hold above the critical $0.24-$0.25 support zone throughout the month.
By June 2, ADA had declined further to around $0.23, down 2.56% on the day, after the Cardano Foundation canceled its 2026 annual summit following a funding vote that failed, adding significant negative sentiment and pushing ADA toward its lowest levels since 2020.
Amsterdam Set to Welcome Thousands of Digital Asset Professionals
Dutch Blockchain Week 2026 Releases Full Summit Agenda as Europe’s Digital Asset Industry Gathers in Amsterdam
DatesJune 22–28, 2026
SummitJune 24 & 25, 2026
VenueJohan Cruijff ArenA, Amsterdam
Side Events40+ City-Wide
With less than a month to go, Dutch Blockchain Week 2026 has released the full agenda for its flagship summit — offering a clearer picture of the companies, institutions and industry leaders set to gather in Amsterdam this June.
7
Days of industry-wide programming across Amsterdam
2
Summit days at Johan Cruijff ArenA
40+
Side events, dinners & meetups across the city
MiCA
Europe’s regulatory era — Amsterdam at the center
Taking place from June 22–28, 2026, Dutch Blockchain Week has evolved into one of Europe’s largest blockchain and digital asset gatherings. At the center of the week is the Dutch Blockchain Week Summit on June 24 & 25 at Amsterdam’s iconic Johan Cruijff ArenA, bringing together exchanges, banks, payment providers, regulators, infrastructure companies, policymakers and investors.
Summit Topics
The summit program reflects the continued maturation of the industry. Key themes taking center stage across two days of content include:
Among the confirmed speakers is Charlie Lee, Founder of Litecoin and Director of the Litecoin Foundation, alongside senior executives and industry leaders from:
Charlie Lee — Litecoin FoundationVisaMastercardKrakenBitwiseFireblocksChainlinkMinistry of FinanceRippleDeloittePwC+ Many Others
Breakout Program
Beyond the main stage, attendees will have access to a dedicated breakout program hosted by leading organizations. These sessions are designed to provide deeper insights into the technologies, regulations and business models driving the next phase of digital asset adoption.
Visa · Mastercard · Deloitte · PwC · Fireblocks · Kraken · OKX · Bybit EU · Zerohash Europe · Coinmerce · Talos
Amsterdam & MiCA
As Europe enters the MiCA era, Amsterdam continues to strengthen its position as a key destination for digital asset companies seeking to operate within a regulated framework. This shift is increasingly reflected in the audience attending Dutch Blockchain Week, which now attracts professionals from traditional finance, banking, fintech, government, legal, payments and blockchain sectors alike.
Networking
Networking remains a major focus for this year’s edition. Through a dedicated networking platform, attendees can connect, schedule meetings and engage with partners before arriving in Amsterdam. During the summit, dedicated networking areas and curated meeting opportunities are designed to facilitate meaningful business conversations and long-term partnerships.
The wider Dutch Blockchain Week ecosystem extends well beyond the summit itself. More than 40 side events will take place throughout Amsterdam — ranging from investor dinners, executive roundtables and networking receptions to community meetups, workshops and industry-focused gatherings.
“Dutch Blockchain Week 2026 is positioning itself as more than a conference. It is becoming a meeting point for the companies, institutions and professionals actively shaping the future of digital assets in Europe.”
Dutch Blockchain Week is one of Europe’s largest blockchain and digital asset gatherings, held annually in Amsterdam. The event brings together professionals from across exchanges, banking, payments, regulation, infrastructure, legal and investment sectors, creating a platform for business development, knowledge sharing and relationship building at the intersection of finance and digital assets.
About Crypto Coin Show
Crypto Coin Show is a leading media platform covering blockchain events, digital asset industry news, and the global crypto conference landscape. We connect professionals with the events, insights and conversations shaping the future of finance.
XRP’s recent price action reflects growing indecision, with volatility contracting on higher timeframes while shorter-term charts show repeated reactions from established support and resistance zones. Such compression periods often precede significant directional moves, making the upcoming sessions particularly important for the asset.
Ripple Price Analysis: The Daily Chart
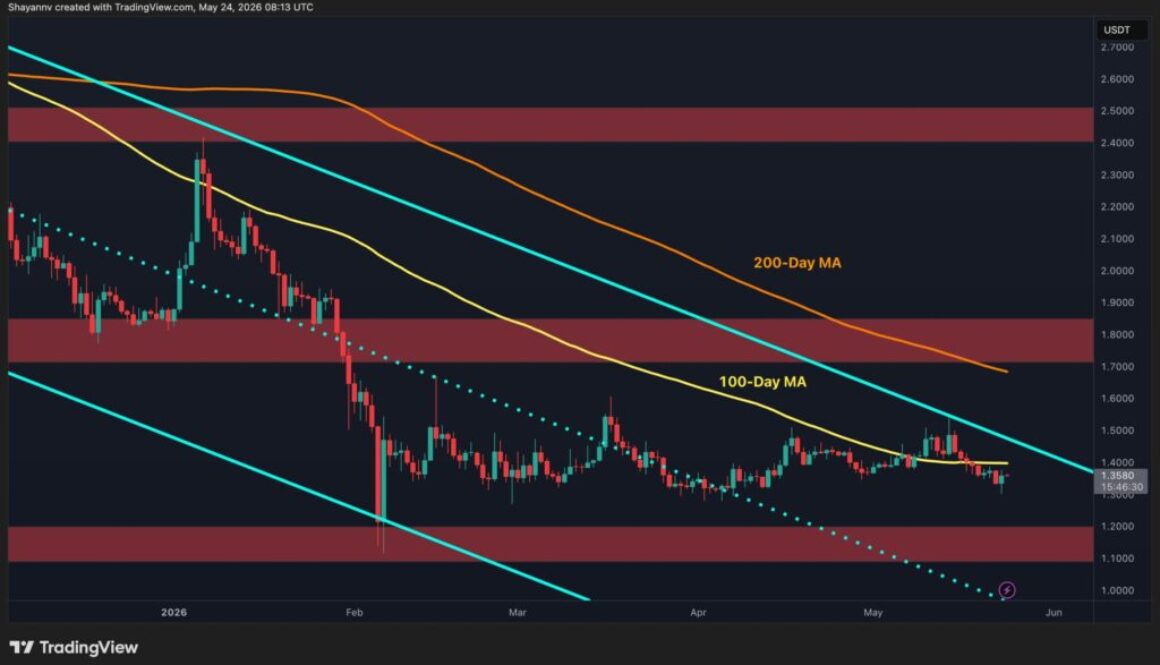
On the daily timeframe, XRP remains trapped beneath the descending long-term trendline while simultaneously struggling around the 100-day moving average near the $1.38 region. This moving average has recently acted as dynamic resistance, preventing buyers from sustaining upward momentum.
The price is also approaching the narrowing section of the broader descending channel structure, suggesting that a breakout event may be developing. As volatility compresses, XRP appears to be entering a decision zone where prolonged consolidation becomes less likely.
Currently, the primary resistance remains the $1.75-$1.85 supply region, while stronger resistance is located around the 200-day MA near $2.0. On the downside, the key support sits around the $1.10-$1.20 demand zone.
The most probable scenario in the near term is continued compression around the 100-day MA at $1.38, followed by an impulsive breakout. A bullish breakout above the descending channel and $1.40-$1.45 area could trigger recovery toward the $1.75-$1.85 resistance region. Conversely, rejection from current levels may reinforce the broader bearish trend and expose lower supports once again.
XRP/USDT 4-Hour Chart
The 4-hour chart presents a clearer range-bound structure. XRP has been oscillating between support around the $1.27-$1.30 zone and resistance near $1.53-$1.57 for several weeks, forming a relatively stable consolidation range.
Most recently, the price revisited the lower boundary of this range near $1.30, triggering another bullish reaction. This suggests buyers continue defending the support area, increasing the possibility of a short-term move higher.
As long as XRP holds above the $1.30 support region, the path toward the upper boundary around $1.53-$1.57 remains open. Such a move would represent a corrective bullish swing inside the broader sideways structure rather than confirmation of a larger trend reversal.
However, repeated tests of support tend to weaken demand over time. Therefore, failure to maintain the $1.30 level could invalidate the consolidation range and increase the probability of renewed downside pressure. For now, the market structure favors continued ranging behavior, with the upper resistance zone near $1.55 acting as the primary target for any short-term recovery.
That puts a 1,150% increase as a 2031 target inside a market that is still trying to prove it can hold the $80,000 area.
CryptoSlate’sBitcoin page shows BTC near $80,200 on May 9, with a market capitalization near $1.61 trillion and an all-time high of $126,198 set on Oct. 6, 2025.
A move to $200,000, another price target being batted around lately, would require Bitcoin to rise roughly 2.5 times from that level. A move to $1 million would require roughly 12.5 times.
Bitcoin has produced larger percentage moves before, but the current forecast cycle now rests on a market question: whether the latest institutional demand is strong enough to absorb coins being sold into the rebound.
Bitcoin price chart showing projected Bitcoin cycle highs and pullbacks across multiple halving periods.
Why seven-figure math is back
The VanEck call lands alongside other seven-figure frameworks. Bitwise CIO Matt Hougan laid out a formal $1 million model in March, arguing that Bitcoin can reach seven figures by gaining share as the store-of-value market expands.
In his model, the market grows to about $121 trillion over 10 years, and Bitcoin reaches $1 million if it captures about 17% of the total.
That is a different time horizon from Sigel’s reported five-year view, but the logic overlaps. Both depend less on a single trading catalyst and more on Bitcoin becoming a larger part of how institutions, advisers, sovereign entities, and younger investors think about long-term savings outside the fiat banking system.
VanEck’s own research desk had already published a longer-range version of that argument. In a 2024 Bitcoin 2050 scenario, the firm modeled a possible $2.9 million Bitcoin price by 2050 if BTC becomes a meaningful medium of exchange and reserve asset.
That report used assumptions around trade settlement, reserve holdings, and Bitcoin scaling infrastructure. The newly reported call is more immediate, but it comes from the same broad research posture: Bitcoin as a macro asset whose valuation depends on adoption beyond crypto-native buyers.
If the thesis is only a trading call, the next resistance level carries most of the weight. If the thesis is that adoption math, ETF flows, portfolio allocation, sovereign reserve behavior, and the size of the global store-of-value market carry more weight than a single weekly candle.
The near-term price frame is less clean. Fundstrat’s Tom Lee’s $200,000 to $250,000 Bitcoin range for 2026 should also be part of the conversation.
Prior CryptoSlate coverage had already placed Lee’s $200,000 forecast among a wide 2026 target set that also included more conservative and more aggressive institutional calls.
Arthur Hayes, the Maelstrom CIO and BitMEX co-founder, is cited as aiming for a shorter-term $125,000 target tied to liquidity and war-driven spending.
Together, those calls make Bitcoin look like it is re-entering a target-heavy phase. Hayes’ framework is macro-liquidity and event-driven. Lee’s is a 2026 market-cycle view.
Bitwise’s model is a store-of-value share calculation. VanEck’s reported call compresses a seven-figure outcome into roughly half a decade.
That difference should keep us grounded. A cluster of bullish forecasts can shift sentiment, but the market structure still has to carry the price there. The Fear and & Greed Index still sits firmly in the ‘fear’ category.
Recent CryptoSlate coverage framed Bitcoin’s rebound above $80,000 as a live test between seller supply and ETF demand. Long-term holders have been taking profits into strength, while spot Bitcoin ETF buyers have helped absorb supply.
That standoff is why the $90,000 area keeps appearing as the next upside test.
The bullish version is straightforward. If ETF demand continues to absorb coins from older holders, the low-$80,000 range could become a base rather than a ceiling. From there, a move toward $90,000 would provide the market with evidence that institutional access is doing real price-discovery work, rather than merely softening a rebound.
That would still leave $200,000 as a stretch target. It would, however, make six-figure 2026 targets easier to discuss without treating them as detached from traded demand.
A market that can hold $80,000, push through $90,000, and do it on broad spot demand would look more compatible with the Fundstrat-style bull case than a market that keeps rejecting the same supply zone.
The failure case is just as important. If ETF demand fades while long-term holders continue selling into rallies, the $1 million conversation becomes a long-horizon adoption argument rather than an explanation for the current price.
In that case, the five-year and 10-year targets can remain intellectually coherent while the 2026 market still struggles to escape its range.
That tension separates price targets from the evidence that would make them relevant now. Bitcoin can leave the $1 million debate unresolved for now. It needs to show whether the buyers who arrived through ETFs and institutional channels are still willing to absorb supply near levels that recently acted as resistance.
The practical threshold is therefore smaller than the largest target on the board. A clean $90,000 push would not validate seven-figure math, but it would show that the market can handle seller pressure while fresh capital still reaches spot Bitcoin products.
What would change the market signal next
Bitcoin needs to hold the low-$80,000 area and then attack $90,000 with enough spot demand to make the move look durable.
ETF flow data, long-term holder distribution, and any fresh confirmation of the VanEck comments will carry more weight than another round number from an executive or strategist.
The seven-figure targets are moving the debate away from whether Bitcoin can regain its 2025 high and toward whether the asset can claim a larger share of global savings. That is a much larger argument than a technical breakout, but it still needs the current market to cooperate.
For now, the credible takeaway is that institutional researchers are again willing to publish or defend seven-figure math while the market tests whether ETF-era demand can turn $80,000 from a stress point into a launch point.
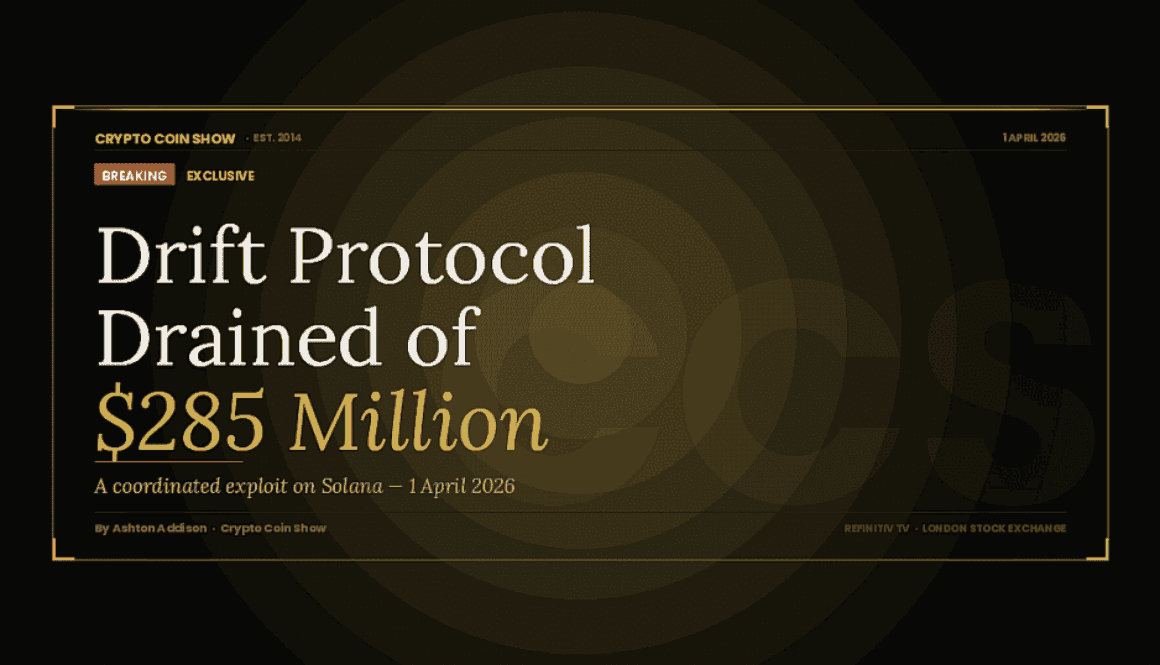
Drift Protocol Drained of $285 Million in One of
2026’s Biggest DeFi Hacks
A coordinated exploit struck the Solana-based perpetual futures exchange on April 1 — no joke — stripping nearly half its treasury in under an hour and sending its token into freefall.
AA
Ashton Addison
Founder & CEO · Crypto Coin Show · Since 2014
cryptocoinshow.com
Refinitiv TV · London Stock Exchange
Live Incident — 1 April 2026, ~18:54 UTC
$285M
Estimated Stolen
~50%
of Protocol TVL
−17%
DRIFT Token Drop
<60m
Duration of Exploit
All figures preliminary as of 18:54 UTC, 1 April 2026. Source: PeckShield · Lookonchain · Arkham Intelligence · CoinGecko.
On the afternoon of 1 April 2026, a single wallet address began quietly draining one of Solana’s most prominent DeFi protocols. Within the hour, nearly $285 million in digital assets had vanished from Drift Protocol’s vaults — transferred, swapped and bridged with the cold precision of a pre-planned heist. The platform’s team scrambled to confirm the obvious: this was not a prank. “This is not an April Fools joke,” they wrote on X, in a line that said everything about the moment.
Drift Protocol is a non-custodial perpetual futures exchange built on Solana. It allows traders to take leveraged positions across crypto assets without a centralised intermediary, using a virtual automated market maker and multi-asset collateral. At the time of the attack, it ranked among the most liquid DeFi venues on Solana, with a total value locked of approximately $309 million. By the time blockchain sleuth accounts had finished counting, that figure had collapsed to an estimated $24 million.
01—
The Attack: How It Unfolded
On-chain data captured by Lookonchain and PeckShield tells a methodical story. The exploit began around 4:00 PM UTC with a transfer of approximately $155 million in JLP tokens — Jupiter’s liquidity pool token — from a Drift vault to a freshly created Solana wallet. The suspected attacker’s address then received a cascade of additional inflows: USDC, cbBTC, Wrapped Ethereum and a range of other tokens, suggesting a coordinated, multi-asset drain of protocol-linked vaults rather than a single opportunistic strike.
Community monitors flagged suspicious outflows as early as 1:30 PM Eastern. Mert Mumtaz, co-founder and CEO of infrastructure firm Helius, posted on X that there was a high likelihood of a major exploit and urged Circle — whose USDC stablecoin is used as collateral on Drift — to respond. His warning, unusually specific and from a credible Solana insider, cut through the noise even as many in the crypto community assumed the alerts were an April 1 prank.
🔴 Suspected Attacker Wallet — Solana
HkGz4KmoZ7Zmk7HN6ndJ31UJ1qZ2qgwQxgVqQwovpZES
Flagged by PeckShield, Lookonchain and Arkham Intelligence. Track live via Solscan and SolanaFM.
Once the initial drain was complete, the attacker moved swiftly to liquidate. Stolen assets were converted into USDC and bridged to Ethereum. By 17:49 UTC, the Ethereum-side wallet held approximately 19,913 ETH — worth around $42.6 million — acquired in minutes. The Solana wallet also deposited SOL to Hyperliquid and Binance, pointing to an attacker comfortable navigating both decentralised and centralised infrastructure simultaneously.
02—
Drift Confirms the Breach
Drift Protocol’s initial public response was characteristically restrained. The team acknowledged “unusual activity” and asked users not to deposit, stopping short of calling it an attack. The hedging was brief. Within hours, the protocol had escalated its language sharply, posting a direct confirmation to its X account.
“Drift Protocol is experiencing an active attack. Deposits and withdrawals have been suspended. We are coordinating with multiple security firms, bridges, and exchanges to contain the incident. This is not an April Fools joke.”
Drift Protocol — Official X Account, 1 April 2026
The team said it was working with multiple security firms, bridge operators and centralised exchanges to contain and trace the movement of funds. No official loss figure was published by the protocol itself, though PeckShield placed the total at approximately $285 million, while other estimates ranged between $270 million and $300 million. As of publication, deposits and withdrawals remain suspended.
03—
Market Reaction and Token Collapse
DRIFT, the protocol’s native token, reacted immediately. CoinGecko data shows the token declined more than 13% over the 24-hour period, with a steep intraday drop occurring within minutes of the suspicious transfers being flagged publicly. At its low, DRIFT traded at approximately $0.05 — down nearly 20% from pre-incident levels — as traders unwound positions under uncertainty about the protocol’s solvency.
The broader Solana ecosystem felt the tremors. Arkham Intelligence’s dashboard for Drift’s vaults confirmed a near-total evacuation of holdings, with the platform’s balance visible collapsing in real time. DeFi Development Corp. (Nasdaq: DFDV), a US-listed public company with a Solana-focused treasury strategy, issued a statement confirming it holds no exposure to Drift and was not impacted by the exploit.
04—
Scale and Context
To understand the magnitude of what happened to Drift, it helps to place it against the backdrop of 2026’s DeFi security landscape. Industry data shows that crypto theft declined more than 69% between January and February 2026, with February losses estimated between $26.5 million and $35.7 million — the lowest monthly figure in nearly a year, and a world away from the $1.5 billion Bybit breach that opened the previous year.
Set against that declining trend, a potential $270–285 million loss at Drift is a dramatic outlier. If confirmed, it ranks as the largest exploit on the Solana network since the Wormhole bridge hack of February 2022 — when approximately $320 million in wrapped Ether was drained — and one of the most significant DeFi incidents globally in 2026.
The breach represents roughly 50% of Drift’s total value locked at the time of the attack. The coordinated drain of multiple vault types, the immediate conversion and bridging of funds, and the use of both decentralised and centralised infrastructure all point to a sophisticated, pre-planned operation — not an opportunistic probe.
05—
What Users Must Do Now
Immediate Actions for Drift Users
Revoke all wallet approvals connected to Drift Protocol. Phantom wallet users can review and revoke connected app permissions directly in the wallet interface under Settings → Connected Apps.
Do not deposit into or interact with the protocol until Drift publishes an official all-clear. The team has explicitly asked users to stand down.
Track the suspect wallet on Solscan, SolanaFM or Arkham Intelligence for further outflows, swaps or bridge activity.
Monitor Drift’s official X account and any post-mortem reports for updates on recovery efforts, compensation plans or protocol restarts.
If you had open leveraged positions at the time of the attack, document your position data now as evidence for any future claims process.
06—
Looking Ahead
The questions that follow an exploit of this scale are always the same, and always hard. Can the stolen funds be traced and frozen at centralised exchanges before the attacker cashes out? Will Drift be able to compensate affected users, and if so, from what source? Does the protocol survive, or does this become one of DeFi’s cautionary tombstones?
The attacker’s decision to route funds through Hyperliquid and Binance — centralised venues with mandatory KYC — is either a mistake that will prove costly, or a calculated use of high-liquidity venues before authorities can respond. The race between the attacker’s exit strategy and the security firms, exchanges and bridges now coordinating with Drift’s team is very much still live.
What is not in doubt is what the Drift exploit says about the state of DeFi in 2026. The industry entered this year pointing to declining hack totals as evidence of a maturing security posture. In less than an hour on April 1, a single sophisticated actor erased months of that narrative. In a space where hundreds of millions can move in minutes, protocol-level security remains — as it has always been — the most consequential unsolved problem in crypto.
— ◆ —
CCS will continue to update this story as new information becomes available. This article is based on verified on-chain data, official statements from Drift Protocol and reports from PeckShield, Lookonchain and Arkham Intelligence as of 1 April 2026, 18:54 UTC. All figures are preliminary and subject to revision.