Ethereum has continued its recovery from the June lows and is now approaching a major technical inflection point. While the recent rally has improved short-term sentiment, the asset is still trading beneath a confluence of long-term resistance levels.
Interestingly, the liquidation landscape aligns closely with these technical barriers, suggesting that ETH could first target overhead liquidity before the market decides whether a larger trend reversal is underway or another corrective leg lower remains ahead.
Ethereum Price Analysis: The Daily Chart
On the daily timeframe, ETH remains within a broader descending structure in place since the beginning of the year. It has recovered strongly from the major demand zone around $1.45K-$1.55K and is currently testing the key resistance region around $1.80K-$1.85K.
This area is particularly significant because it coincides with the descending trendline that has capped price action since May. The level also represents a major horizontal resistance that previously acted as support before the June breakdown.
Despite the recent strength, ETH remains below the 100-day and 200-day moving averages, both of which continue to trend lower. The 100-day MA is positioned around the $2K-$2.1K resistance zone, while the 200-day MA remains considerably higher near $2.2K, reinforcing the broader bearish market structure.
As long as ETH remains below the descending trendline and the $1.80K-$1.85K resistance zone, the current move can still be viewed as a recovery rally within a larger downtrend. A decisive breakout above this area would shift focus toward the next major resistance at $2K-$2.1K.
ETH/USDT 4-Hour Chart
The 4-hour chart highlights a clear ascending structure that has developed since the late-June low. Price has respected the rising channel boundaries while forming higher highs and higher lows, reflecting improving short-term momentum.
The market has already reclaimed the $1.62K-$1.64K demand zone and subsequently established another support area around $1.72K-$1.74K. These zones have repeatedly attracted buyers during pullbacks and continue to define the short-term bullish structure.
However, the rally is now approaching the upper boundary of the channel and the major resistance band around $1.83K-$1.85K. This creates a natural area where profit-taking and seller activity could emerge.
From a structural perspective, ETH remains constructive above the $1.72K-$1.74K support region. Losing this level would be the first sign that bullish momentum is fading and could expose the lower channel boundary and the broader support zone around $1.55K.
Sentiment Analysis
The Binance ETH/USDT liquidation heatmap provides an important clue regarding the next likely move.
The most significant concentration of short-side liquidity sits above the current market price, particularly within the $1.95K-$2.1K region. This cluster aligns remarkably well with the daily chart resistance zone, the 100-day moving average, and the broader supply area visible on the higher timeframe.
Meanwhile, substantial liquidity pools remain below the market around the $1.45K-$1.55K region, which corresponds closely with the major daily demand zone that has supported ETH throughout the recent recovery.
The alignment between the liquidation map and the technical structure suggests that the market may first be drawn toward the overhead liquidity cluster. A move into the $2K-$2.1K area would effectively sweep a large concentration of short liquidations while simultaneously testing one of the most important resistance zones on the chart.
The reaction at that region will likely determine the next major directional move. If buyers manage to reclaim the $2K-$2.1K resistance area and establish acceptance above it, the recovery could evolve into a broader bullish trend reversal. However, if the liquidity sweep is followed by strong selling pressure and rejection from resistance, ETH could enter another notable decline, potentially targeting the large liquidity pools resting beneath the market around the $1.45K-$1.55K support zone.
Despite gaining over 10% since its recent multi-year low at under $58,000, bitcoin is still not out of the woods yet as the bears continue to dominate, said Ali Martinez.
Meanwhile, fellow analyst Ted Pillows believes BTC, alongside the S&P 500, is poised for more losses, but the cryptocurrency is poised to outperform the index.
Still Bear-Dominated Market
In its most recent post on BTC’s market structure, Martinez outlined the three critical factors that have to change to overcome its current state. First, it’s the aSOPR (Adjusted Spent Output Profit Ratio), an on-chain metric measuring whether bitcoin investors are selling their units at a profit or a loss on average. It continues to hover below 1, showing that most sales are concluded by holders realizing losses.
“The first technical confirmation of a trend reversal from bearish to bullish will be the aSOPR metric crossing back above zero,” the analyst said.
The second is the Puell Multiple, which measures miner profitability by dividing the daily dollar value of newly issued BTC by its 365-day moving average. It shows whether miners are experiencing extreme income stress, as seen earlier this year during one of the largest miner walkouts.
The last factor brought up by Martinez was the Reserve Risk Multiple. The on-chain technical indicator demonstrates the confidence of long-term holders relative to its price, and it’s also below 1. Bitcoin would require a “confirmed break on the aSOPR, followed by zero-line breakouts on the Puell Multiple and Reserve Risk Multiple” to validate the start of a new bull market.
$82K and Its Importance
Michaël van de Poppe believes $82,000 holds particular significance in the current BTC structure, as the 50-week Moving Average is positioned around that level. Historically, this key MA has served as major resistance, and bitcoin solidified the end of its previous bear market only after it reclaimed that line.
At first, BTC would have to break past the 21-week MA (currently around $75,000) before heading toward the more important 50-week MA, said van de Poppe.
Separately, Ted Pillows focused on bitcoin’s relation and correlation with the S&P 500, claiming that both asset classes will “drop over the coming months.” However, he expects the cryptocurrency to emerge victorious after the final leg down. For now, though, the reality is quite different, as the index is up by over 10% this year, while BTC is down by almost 27%.
Ripple’s XRP has shown signs of stabilization after its prolonged downtrend, with buyers successfully defending a key support region and triggering a short-term market structure shift. Although the broader trend remains bearish, the recent price action suggests that selling pressure is weakening, and the market may be preparing for a larger recovery attempt if current support levels continue to hold.
XRP Price Analysis: The Daily Chart
On the daily timeframe, XRP remains inside a broader descending channel and continues to trade below the 100-day and 200-day moving averages, which are both trending lower and maintaining the long-term bearish structure.
However, the recent decline toward the $1.02-$1.06 support zone appears to have attracted significant demand. This region aligns with a previous liquidity sweep below the April lows, where the market briefly traded beneath support before quickly recovering. Since then, the asset has established a higher low and has begun building a base above this demand area.
The price recently bounced from the support zone and is now attempting to reclaim the horizontal resistance region around $1.22-$1.28. This area is particularly important because it also coincides with the descending 100-day moving average and the upper boundary of the broader bearish structure.
A successful reclaim of the $1.22-$1.28 resistance zone would strengthen the recovery scenario and potentially open the path toward the major supply area near $1.55. Until that breakout occurs, the broader trend remains corrective within a larger downtrend.
XRP/USDT 4-Hour Chart
The 4-hour chart presents a more constructive outlook. Following the sweep of liquidity below the $1.02-$1.06 support region, XRP formed a market structure shift (MSS), marking the first indication that sellers were losing control of the short-term trend.
The subsequent rally produced a change of character (ChoCh) as the price broke above a previous lower high and challenged the descending trendline that has capped rallies since mid-June. Although the token initially faced rejection near trendline resistance around $1.16-$1.18, the pullback has remained relatively shallow, and buyers continue defending the former breakout zone.
Importantly, the market has not returned to the lows despite the rejection, suggesting that demand remains active beneath current prices. As long as XRP holds above the $1.03-$1.06 support area, the bullish structure established after the liquidity sweep remains intact.
The key level to monitor now is the descending trendline and the $1.15-$1.18 resistance area. A decisive breakout above this region would confirm a higher-high formation and could accelerate momentum toward the larger daily resistance zone between $1.22 and $1.28.
Conversely, failure to break the trendline could lead to additional consolidation between support and resistance before a larger directional move develops.
Overall, the recent price action favors gradual recovery, but XRP still needs to reclaim the trendline resistance and the $1.22-$1.28 supply zone before a broader bullish reversal can be confirmed.
Bitcoin has reached its most oversold level against gold on record, according to on-chain data. The last time this exact setup appeared, a powerful 660% macro rally in Bitcoin followed.
Here is what the signal means and how history frames the current setup.
The BTC/Gold ratio measures how many gold ounces one Bitcoin can buy, tracking the relative strength of the two assets. An oversold reading means Bitcoin is trading at a deep discount versus the precious metal, hinting that selling pressure may be nearing exhaustion.
The current setup is extreme by any measure. The BTC/Gold oscillator now sits at -1.81 standard deviations from its long-term trend. Furthermore, it trades below its conservative four-year average of -1.42, marking the deepest reading since 2010.
On-chain highlighted the depth of the move. Bitcoin now trades below both the power-law trend and its four-year average simultaneously. Moreover, the structural fair value of that trend currently implies a Bitcoin price near $283,000.
The signal draws on specific technical measures. These include deviation readings and oversold levels for the BTC/Gold ratio. As a result, the combination points to an unusually stretched relationship between the two assets right now.
Gold’s recent strength reflects its traditional role as a safe-haven asset during uncertain times. However, Bitcoin’s relative weakness amid volatility and macroeconomic pressure has driven the ratio to its 2026 trough, one of the lowest points on record.
Extreme oversold conditions in the BTC/Gold ratio have repeatedly marked major opportunity zones for Bitcoin. The chart shows previous troughs during the 2015 and 2018-19 bear markets, COVID (2020), and the FTX collapse (2022), each near a key turning point.
The most notable precedent stands out clearly. Following those lows, Bitcoin launched a multi-year advance exceeding 660%. Similarly, deep drawdowns during earlier cycles preceded outsized gains as capital rotated back into Bitcoin from other assets across the market.
Data from Delphi Digital reinforces the pattern. Larger ratio drawdowns, around -62%, have historically preceded strong recoveries.
Also, the average subsequent rally across completed ratio crosses sits near 160%, with the deepest declines producing even bigger rebounds.
The Gold vs. Bitcoin plan is playing out exactly as described.
The final stage of Gold distribution could drive Bitcoin to new all-time highs over the next 2 to 3 years.
The setup resembles a coiled spring, though it guarantees nothing. Bitcoin often begins to outperform once broader liquidity conditions or risk sentiment improve. Consequently, shifts in monetary policy or rising risk appetite could catalyze a rotation back toward Bitcoin.
The market now sits at a potential inflection point. With the spring coiled after this rare signal, many participants are watching closely. A macro reversal could once again position Bitcoin for significant gains relative to gold.
Solana’s recovery appears to have lost momentum after it shed over 6% in the past week. As it currently trades near $77, it is facing its most negative market sentiment of 2026.
In fact, SOL’s trading volume has dropped to its lowest point in 2026, while negative commentary surrounding the asset has surged to its highest daily level this year, according to Santiment.
Rebound Setup Emerges
Much of the disappointment stems from expectations that strong narratives around tokenized stocks and real-world asset (RWA) activity would translate into stronger price performance, something traders have yet to see.
Santiment noted that this combination of elevated fear, uncertainty, and doubt (FUD) alongside weak trading volume has historically created conditions that can favor a rebound. With retail participation low and sentiment deeply negative, there may be less resistance if large stakeholders decide to drive Solana’s prices higher, which could potentially set the stage for a sharp move that catches traders off guard.
The Solana network added 1.60 million new addresses over the past two weeks. Additionally, the SuperTrend indicator on SOL’s three-day chart also flashed a new buy signal for the first time since October 10, 2025, when the Average True Range (ATR) trailing stop moved below the price. According to analyst Ali Martinez, the previous SuperTrend sell signal was followed by a 74% price correction. He said the latest signal points to a bullish trend and could send SOL toward $100.
Michaël van de Poppe also observed that the crypto asset has re-entered its trading range and may briefly pull back before continuing its upward move. He added that holding the $75-$77 range as support could open the door to gains toward $100 and potentially $120 in the coming weeks or months.
$78 Holds the Key
Another crypto analyst, Dami-Defi, also pointed to a potential breakout as SOL currently tests the upper boundary of a descending channel that has been in place since September 2025. According to the analyst, a three-day close above $78 would confirm the breakout and open the door to an initial move toward $105, followed by $125 and $155 if momentum continues.
However, the setup would be invalidated by a three-day close below $72, and stronger trading volume would be needed to confirm the breakout.
Ripple’s XRP has delivered a strong recovery from its recent lows, validating the bullish divergence that developed near support. While the broader market structure remains corrective, the latest rally has pushed the price back toward a critical technical inflection point where the next directional move could be determined.
Ripple Price Analysis: The Daily Chart
The daily timeframe continues to show XRP trading inside a long-term descending channel, remaining below the major moving averages and the channel’s upper boundary. Despite the broader bearish structure, the recent price action has improved considerably.
The bullish RSI divergence that formed around the $1.02-$1.05 support zone has played out as expected. While the asset was making lower lows, momentum was printing higher lows, signaling weakening selling pressure. Since then, XRP has rebounded sharply and reclaimed the lower support region around $1.02-$1.06.
The recovery has now carried the price toward the first major resistance zone between $1.17 and $1.24. This area previously acted as support before the latest breakdown and is now functioning as supply. The RSI has also pushed back above the midline, confirming improving momentum and strengthening the case for a continued recovery attempt.
However, the broader trend remains bearish as long as the token trades beneath the descending channel resistance and the major moving averages overhead. A successful reclaim of the $1.17-$1.24 region would be the first sign that the market is attempting to build a larger reversal structure.
XRP/USDT 4-Hour Chart
The 4-hour chart provides a clearer view of the recent breakout. XRP spent several days consolidating inside the $1.02-$1.06 demand zone before buyers aggressively stepped in and triggered a sharp rally toward the descending trendline resistance.
The move has already reclaimed the local support area and pushed price directly into the trendline that has capped lower highs since mid-June. XRP is now testing this dynamic resistance as it approaches the lower boundary of the broader $1.21-$1.29 supply zone.
This creates a pivotal setup. A confirmed breakout above the descending trendline would likely open the door for a move into the upper resistance region, where sellers may attempt to regain control. Such a breakout would also confirm a short-term structural shift after weeks of lower highs and lower lows.
On the other hand, failure to break through the trendline could trigger a temporary pullback toward the recently reclaimed support zone. As long as the asset remains above the $1.02-$1.06 area, the current recovery structure remains intact.
For now, momentum favors the bulls in the short term, but the market is approaching a major resistance cluster where a decisive breakout is needed to confirm that the recovery is evolving into something more significant than a relief rally.
Veteran trader Peter Brandt is eyeing a move from Bitcoin into gold, citing a technical breakout in the XAU/BTC ratio. His call has reignited the store-of-value debate, drawing sharp pushback from analysts.
Here is what his chart shows, why the timing matters, and how other analysts read the same setup.
I am contemplating selling some of my Bitcoin and going to Gold with the money. Looks to me that Gold is going to gain substantially on Bitcoin $XAUBTCpic.twitter.com/m4EUqkbh5j
The XAU/BTC ratio measures how many BTC one ounce of gold can buy. A rising ratio means gold is outperforming Bitcoin, while a falling ratio signals the opposite across the market cycle.
Brandt, a respected chartist with over 50 years of experience, sees the ratio turning. His monthly chart shows the pair near 0.067, curling upward from a multi-year base.
Not all market participants accept Brandt’s rotation thesis. Michael Saylor argues Bitcoin’s underperformance stems from liquidity diversion toward AI infrastructure, not a shift into gold. On-chain data supports a more nuanced read of the market.
— Michaël van de Poppe (@CryptoMichNL) July 4, 2026
Analyst Michaël van de Poppe pushed back directly on the chart. “Until Bitcoin doubles, then this entire chart is worthless,” he wrote. His comment underscores the view that Bitcoin’s growth potential could quickly invalidate any relative weakness against gold.
Trader Pablo Heman offered a more balanced take, holding both assets. He sees near-term upside for Bitcoin if it holds above $55,000. However, he stays long-term bullish on gold, citing China’s push to challenge the LBMA pricing structure.
“Wow, Short Bitcoin Long Gold?! What a ballsy call! I hold both, and think BTC at least has a big bounce coming for next few months. As long as BTC stays above 55K it should have a big bounce. But Gold (and silver) I am bullish on for the Long term, like the next 5-10 year, maybe even more! China will now take on LBMA (London) and try to set the spot good price in HK. Most people probably don’t know how much this will change the world of commodities!,” Herman said on X.
For now, the XAU/BTC ratio serves as the clearest scoreboard. A sustained breakout would bolster the gold-over-Bitcoin narrative. However, a rejection could signal Bitcoin regaining momentum, especially as fresh weekly data shows crypto outperforming both gold and equities.
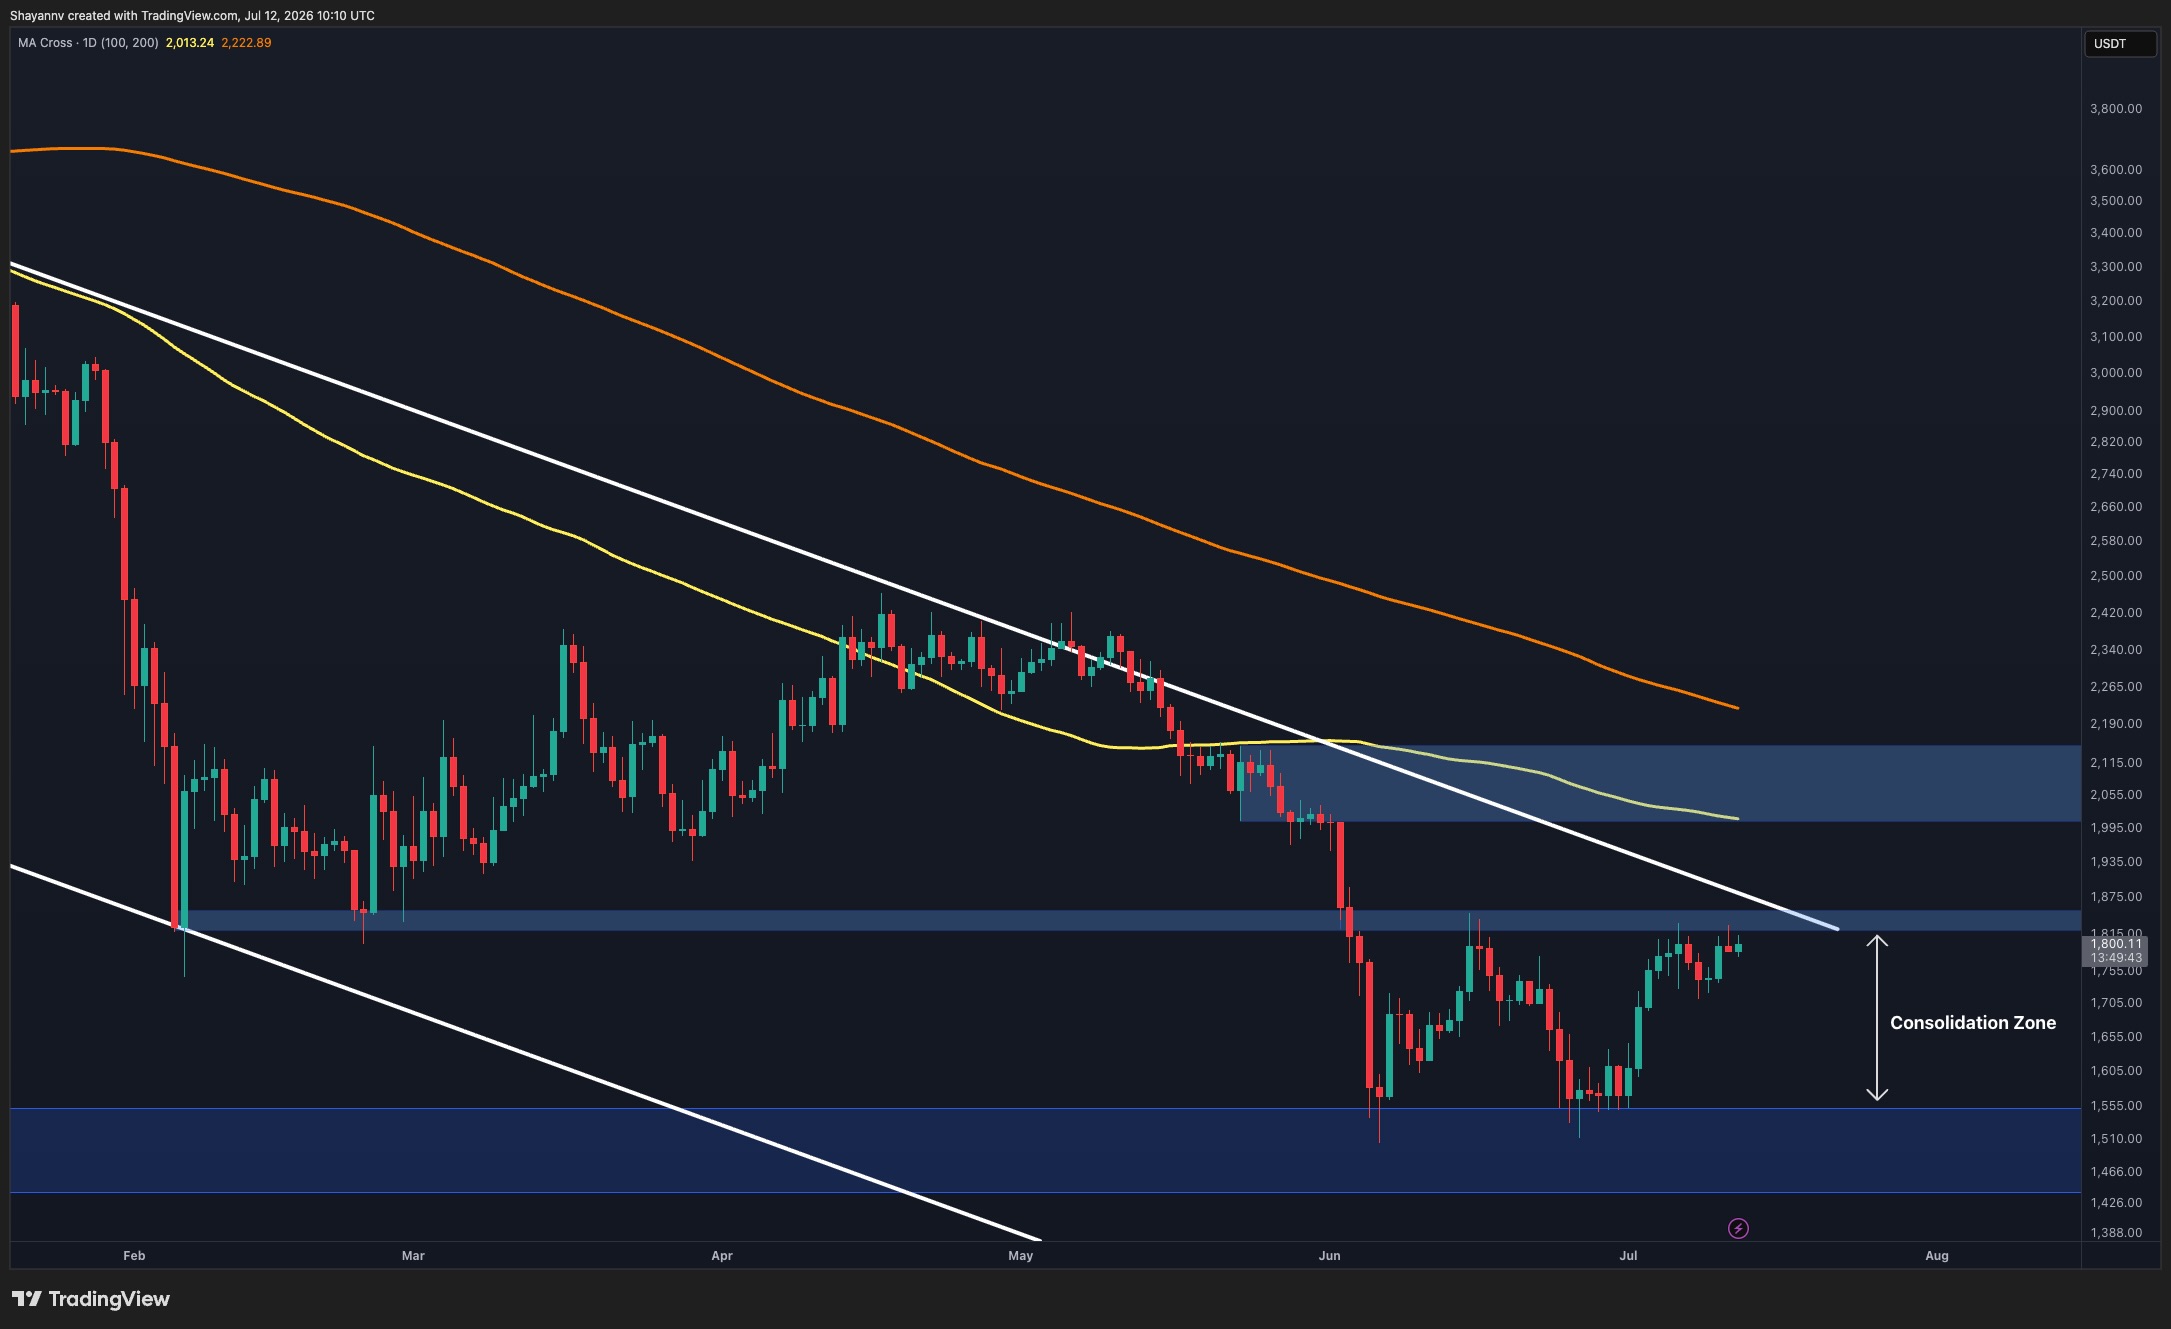
Bitcoin has staged a notable rebound after sweeping liquidity beneath the June lows, but the recovery is now approaching a critical resistance cluster. While momentum has improved in the short term, the broader structure remains bearish until BTC reclaims several major resistance levels overhead.
Bitcoin Price Analysis: The Daily Chart
The daily timeframe shows Bitcoin continuing to trade below its key moving averages, with both the 100-day and 200-day moving averages sloping lower and acting as dynamic resistance. The market remains structurally bearish after losing the $72K-$74K support zone in June, which has now flipped into a major supply area.
However, the recent price action is becoming more constructive. BTC successfully defended the $58K-$61K support region and produced a sharp bounce from the lower boundary of the broader descending structure.
More importantly, the daily RSI has formed a bullish divergence, with momentum making higher lows while the price registered comparable or lower lows around the June bottom. This divergence often appears during exhaustion phases and suggests selling pressure has been weakening despite the downtrend.
The immediate challenge lies around $65K-$67K, where a major resistance zone intersects with the descending upper trendline. A successful breakout above this area would likely trigger a larger recovery toward the former breakdown region near $72K-$74K. Conversely, rejection from the current resistance cluster would reinforce the prevailing bearish structure and increase the probability of another move toward the $60K support area.
BTC/USDT 4-Hour Chart
The 4-hour chart highlights a developing falling wedge structure. Bitcoin recently rebounded from the lower boundary near $58K and has advanced steadily toward the upper trendline, which currently converges with the $63K-$64K area.
The recovery has already reclaimed the $60K-$61K support zone, turning it back into a short-term demand area. Price is now testing the upper boundary of the wedge while approaching the lower edge of the $64K-$66.5K supply zone.
A breakout above the descending trendline could accelerate bullish momentum and open the path toward the higher resistance region around $65K-$67K. Such a move would also confirm a short-term shift in market structure after weeks of lower highs.
If the breakout fails, Bitcoin may continue consolidating inside the wedge before attempting another push higher. The $60K-$61K region remains the most important near-term support, while a breakdown below it would place the recent recovery at risk.
Sentiment Analysis
The Spot Average Order Size metric provides insight into the behavior of larger market participants. Recent data shows that whale-sized transactions continue to dominate activity despite Bitcoin trading near local lows.
The latest readings indicate that large orders remain active in the market while prices hover around the $60K-$63K region. Although the metric alone cannot determine directional intent, the persistence of larger transaction sizes during a prolonged decline suggests institutional and high-net-worth participants remain engaged rather than stepping away from the market.
Combined with the bullish RSI divergence on the daily chart and Bitcoin’s defense of the $58K-$61K support zone, the data suggests accumulation interest may be emerging around current levels. Nevertheless, confirmation still requires a technical breakout above the descending trendline and the $65K-$67K resistance cluster.
Until that occurs, Bitcoin remains in a broader corrective structure, with the current recovery appearing more like an attempt to build a base rather than a confirmed trend reversal.
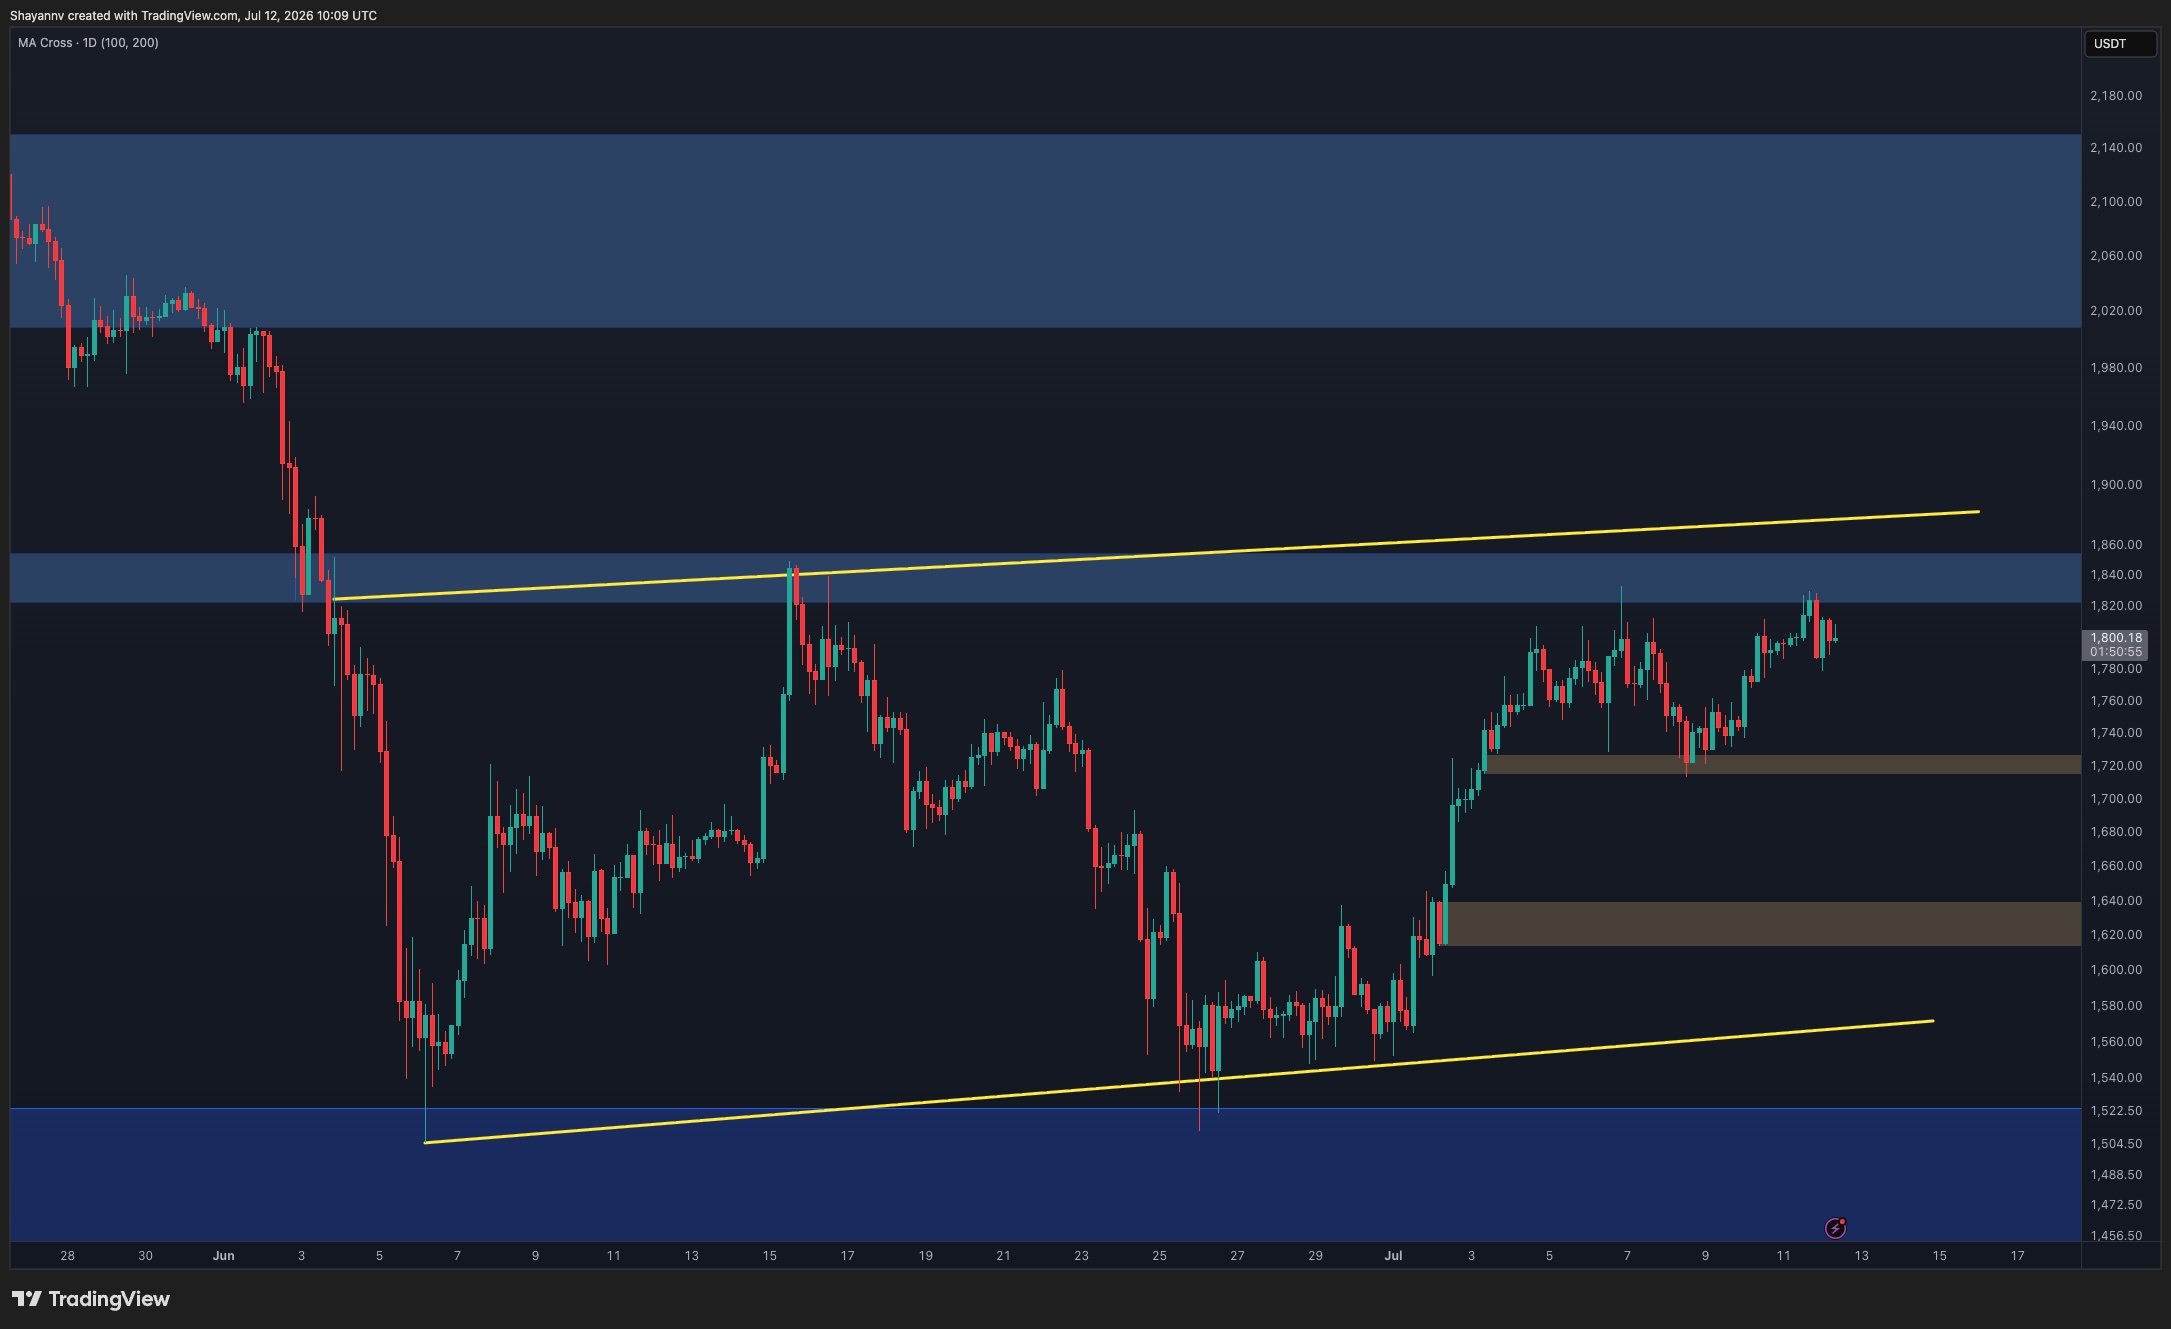
Ethereum has extended its recovery over the past several sessions, breaking above its recent consolidation range and approaching a major confluence resistance area. The rally has improved short-term sentiment, but the market is now testing a zone that could determine whether this move develops into a broader trend reversal or remains a relief rally within the prevailing downtrend.
Ethereum Price Analysis: The Daily Chart
Ethereum continues to recover from the $1.46K-$1.53K demand zone, where buyers once again stepped in after defending the June lows. The rebound has now carried price toward the descending trendline that has capped every major rally since the May peak.
The recent advance has also reclaimed the $1.70K area, placing ETH just below the next key resistance cluster around $1.82K-$1.86K. This region is particularly important because it aligns with the long-term descending trendline, creating a significant technical confluence.
Momentum has improved considerably. The previously discussed bullish RSI divergence has continued to play out, with the indicator making higher highs while price has recovered sharply from support. This suggests bearish momentum has weakened substantially compared to previous sell-offs.
Nevertheless, the broader trend cannot be considered bullish until Ethereum breaks above the descending trendline and reclaims the higher resistance band. A rejection from this area would preserve the sequence of lower highs that has defined the market for the past several months.
Source: TradingView
ETH/USDT 4-Hour Chart
The 4-hour chart shows that Ethereum has successfully broken above its short-term consolidation and reached the first resistance zone around $1.70K-$1.74K. Buyers have maintained strong momentum following the breakout from the lower range, allowing the price to approach the upper boundary of the descending structure.
Price is now trading just beneath the falling trendline that has repeatedly rejected previous recovery attempts. A decisive breakout above this trendline would represent the first meaningful structural improvement since the broader decline began and could open the door for a move toward the $1.82K-$1.86K resistance area.
As long as Ethereum remains above the recently reclaimed $1.70K region, buyers retain short-term control. However, failure to overcome the descending trendline could trigger another rejection, sending price back toward lower support levels and extending the broader corrective structure.
Source: TradingView
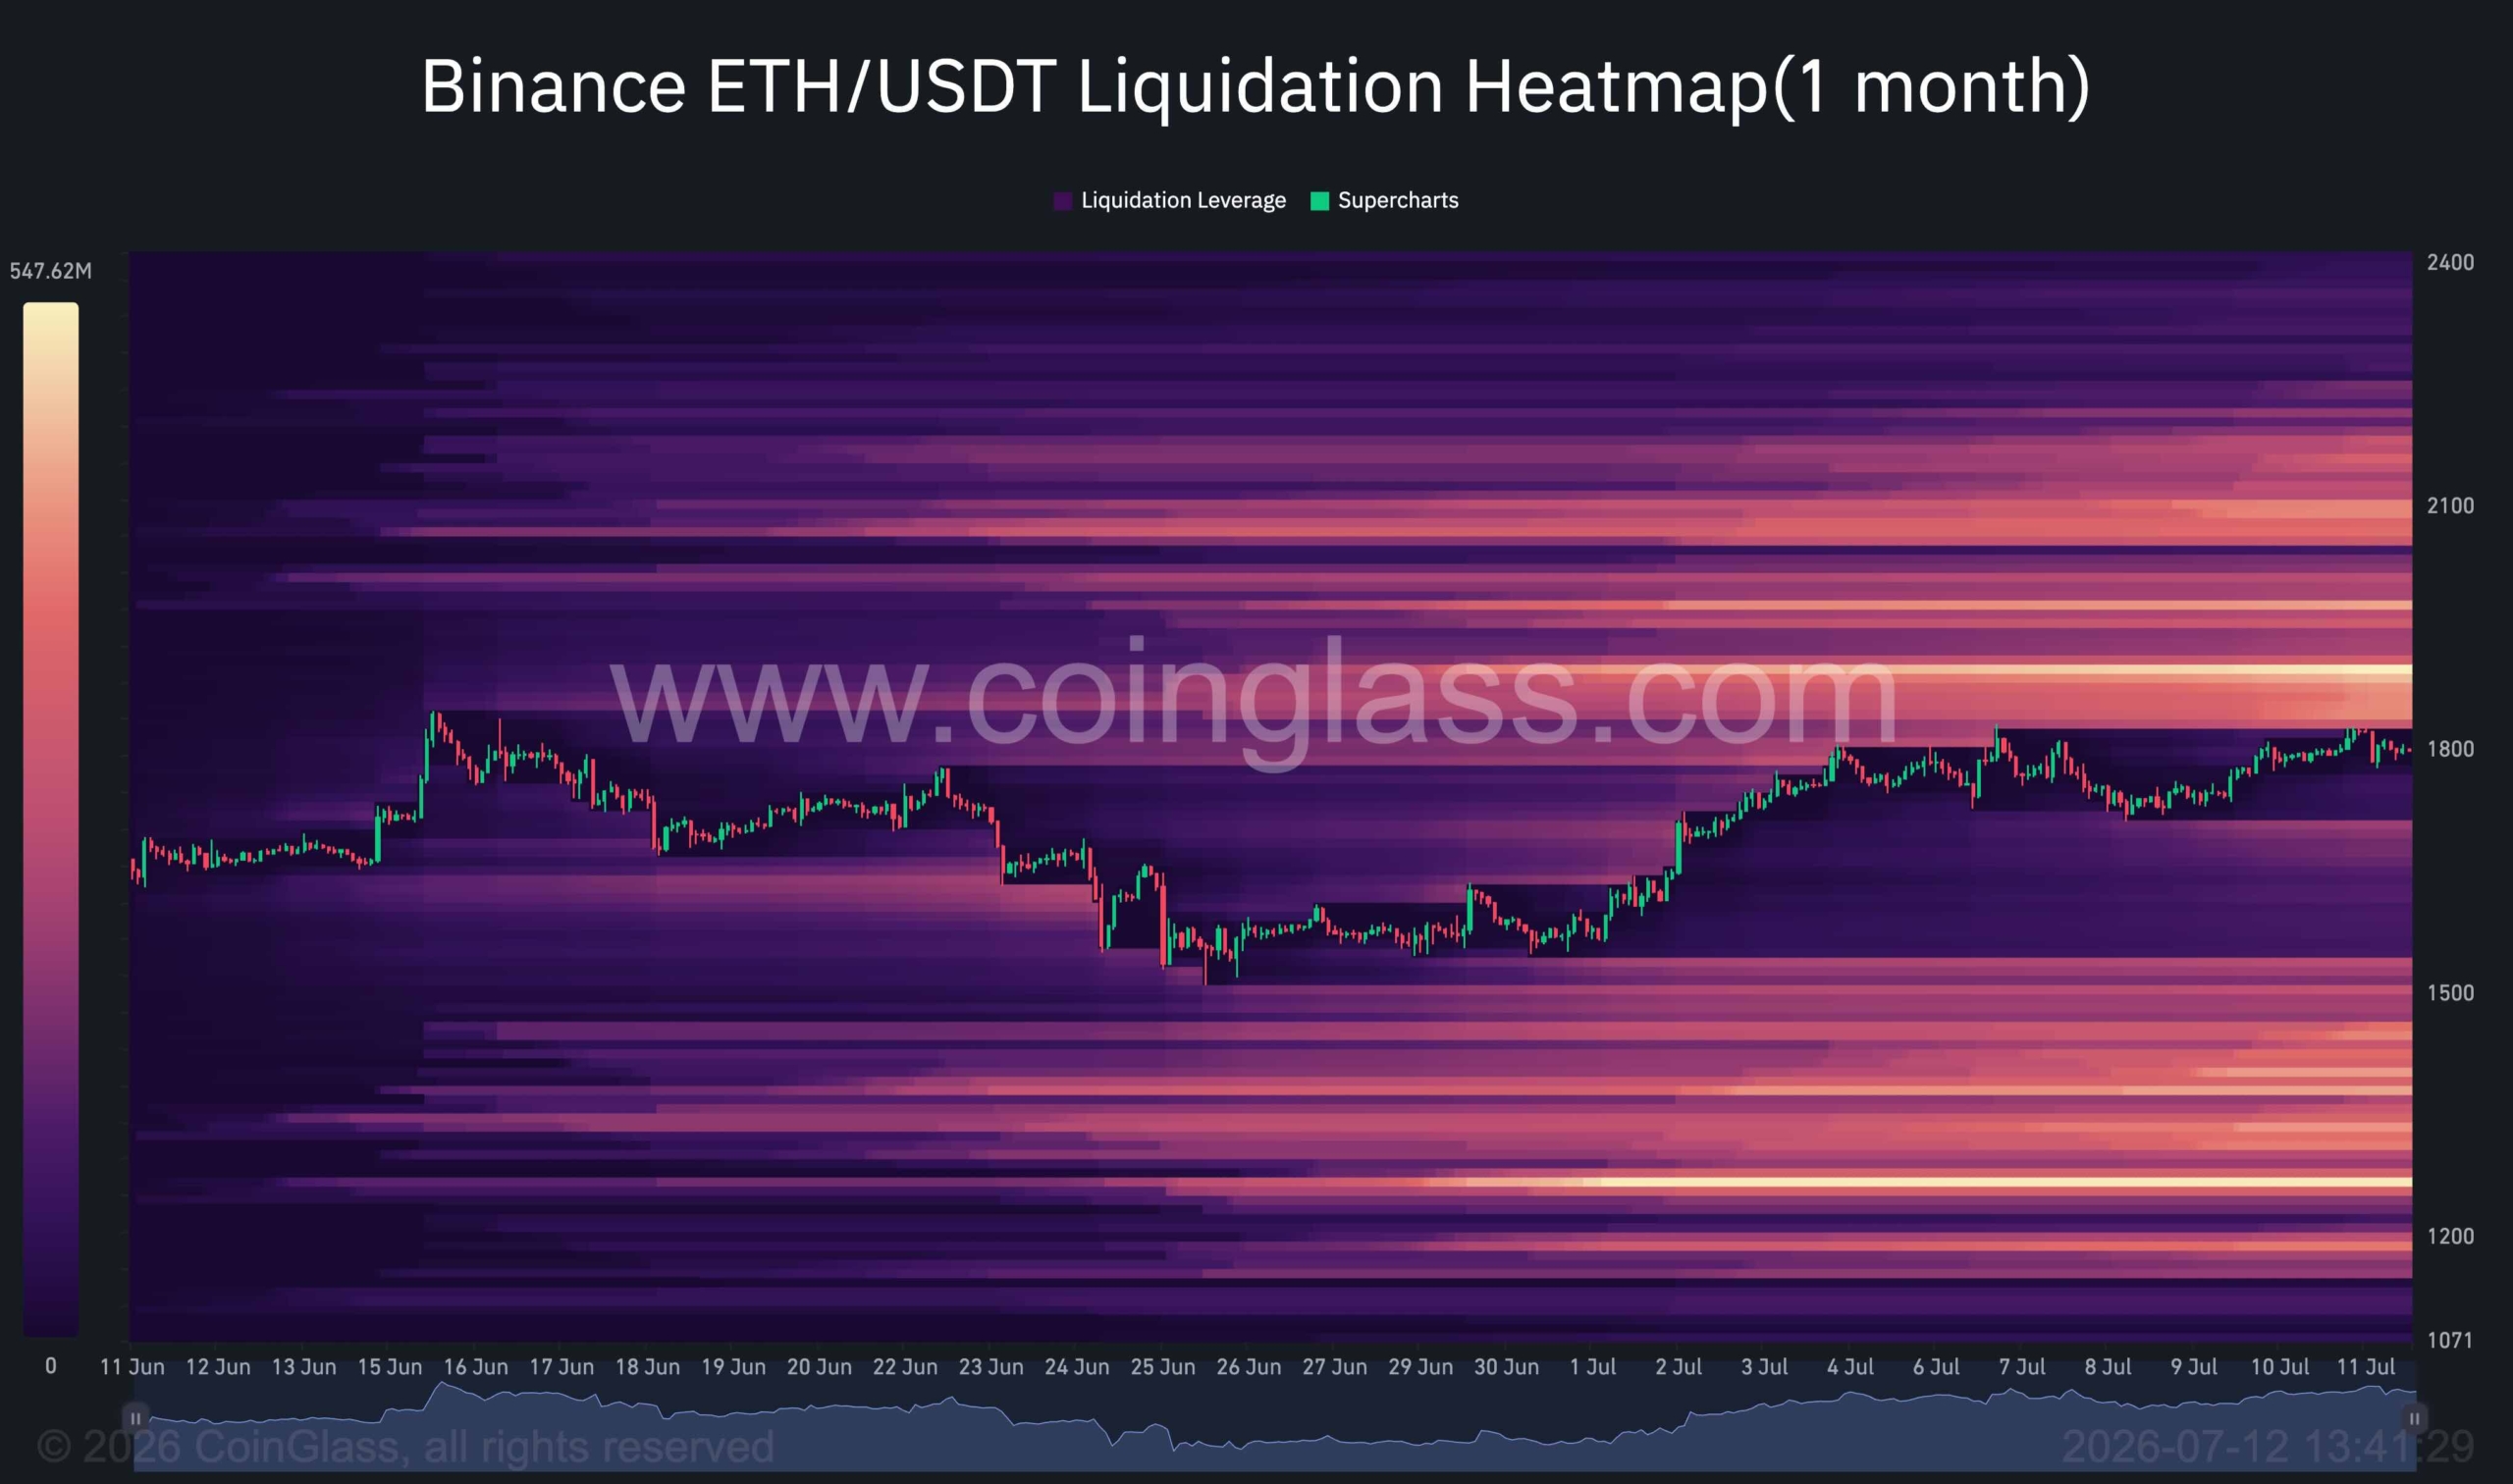
Sentiment Analysis
The one-month liquidation heatmap highlights a significant concentration of leveraged positions above the current market price, particularly within the $2K-$2.2K region.
These overhead liquidity clusters could act as a magnet for price in the coming sessions. If Ethereum successfully clears the descending trendline and continues its recovery, the market may accelerate toward this area as short liquidations fuel additional upside momentum.
However, the reaction after such a liquidity sweep may prove even more important than the rally itself. Once the $2K-$2.2K liquidity has been absorbed, the market will likely reveal whether buyers have accumulated enough strength to establish a sustainable bullish trend or whether the move was primarily a liquidity-driven squeeze.
If bullish momentum remains strong after clearing the overhead liquidity, Ethereum could enter a broader recovery phase. Conversely, failure to hold above that region would increase the probability of another significant decline, with price potentially rotating lower to target the sizeable liquidity clusters that remain beneath the current market. Such a sequence would fit the market’s tendency to move between major pools of leveraged liquidity before establishing its next directional trend.
Our Pepe price prediction for 2026 is a maximum price of $0.000025
In 2032, we expect the Pepe price to touch $0.00035.
The meme coin sector momentarily slowed down, hinting at a potential rally if the broader market stabilizes after its recent downturn. Specifically, PEPE coin prices display a bullish pattern, presenting an opportunity for a breakout based on the daily chart analysis.
Moreover, the volatility of meme coins is exacerbated by the prevailing market uncertainty. This causes fluctuations in PEPE prices as they oscillate in search of a solid support level to initiate a recovery.
Considering investing in Pepe crypto?
Explore our Pepecoin price prediction from 2026 to 2032. We offer an in-depth analysis of the anticipated price movements for the PEPE coin.
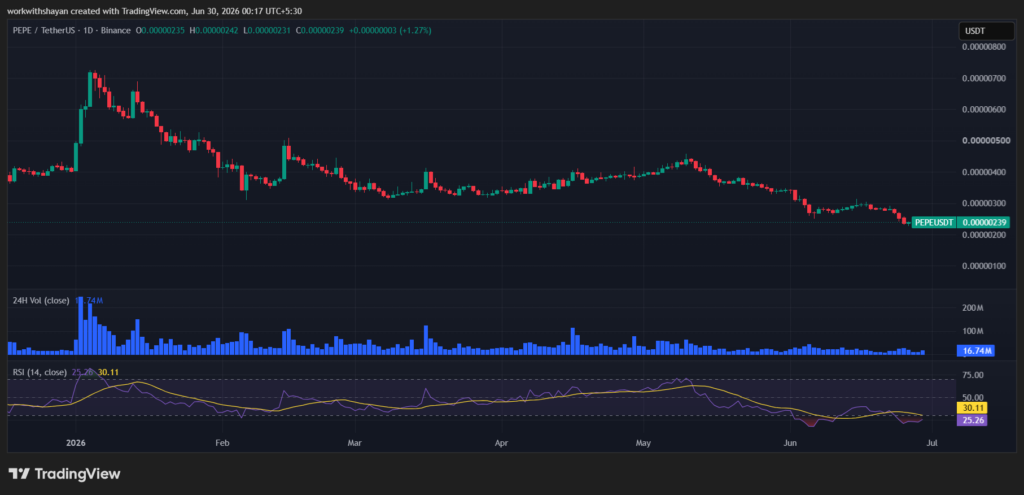
The PEPE price analysis for 29 June confirms Pepe faced bearish pressure as sellers pushed the price toward $0.00000235. Currently, sellers are dominating the pepe price chart.
Analyzing the daily price chart of Pepe coin, Pepe’s price witnessed a surge in bearish volatility over the last few hours. Buyers liquidated around immediate resistance channels. This resulted in a decline toward $0.00000235. The 24-hour volume surged to $29 million, showing an increase in trading interest. Pepe is trading at $0.00000235, declining over 0.1% in the last 24 hours.
The RSI-14 trend line has surged from its previous level and trades at level 35, hinting at a minor bullish trend. The SMA-14 level suggests volatility in the next few hours.
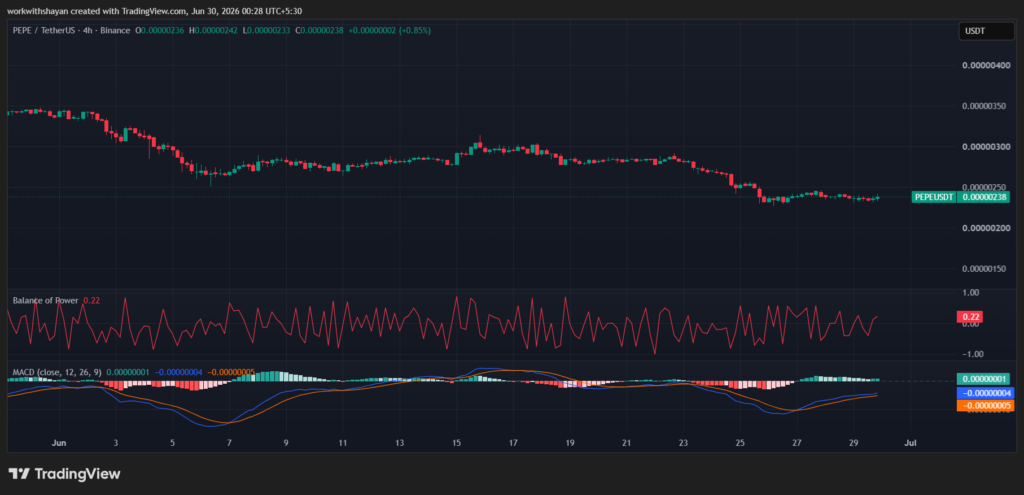
PEPE/USDT 4-hour price chart: Buyers aim for further surges
The 4-hour Pepe price chart suggests that bulls dominate as PEPE holds around EMA levels. Currently, bulls are aiming for a significant recovery.
The BoP indicator trades in a positive region at 0.22, showing that short-term buyers are taking a chance to accelerate an upward trend.
Additionally, the MACD trend line has formed green candles above the signal line, and the indicator aims for positive momentum, strengthening long-position holders’ confidence.
Pepe technical indicators: Levels and action
Daily simple moving average (SMA)
Period
Value
Action
SMA 3
$ 0.000002721
BUY
SMA 5
$ 0.000002846
SELL
SMA 10
$ 0.000003094
SELL
SMA 21
$ 0.000003360
SELL
SMA 50
$ 0.000003715
SELL
SMA 100
$ 0.000003599
SELL
SMA 200
$ 0.000004116
SELL
Daily exponential moving average (EMA)
Period
Value
Action
EMA 3
$ 0.000002789
BUY
EMA 5
$ 0.000002860
SELL
EMA 10
$ 0.000003034
SELL
EMA 21
$ 0.000003289
SELL
EMA 50
$ 0.000003546
SELL
EMA 100
$ 0.000003787
SELL
EMA 200
$ 0.000004634
SELL
What to expect from PEPE price analysis next?
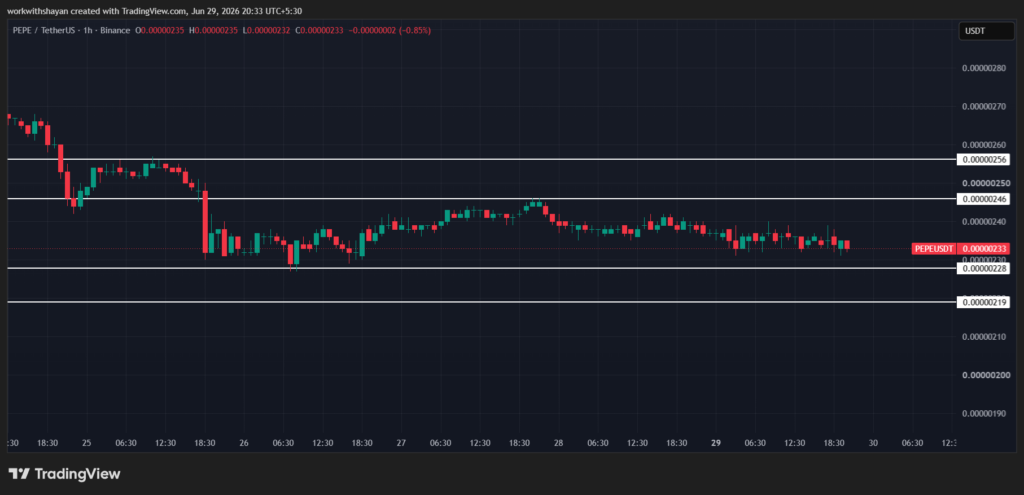
The hourly price chart confirms that Pepe attempts to drop below the immediate support line; however, bulls are eyeing a further recovery rally in the coming hours. If Pepe’s price holds momentum above $0.00000246, it will fuel a bullish rally to $0.00000256.
If bulls fail to initiate a surge, Pepe’s price may drop below the immediate support line at $0.00000228, beginning a bearish trend to $0.00000219.
Recent News on PEPE
LBank has upgraded LBank Pay to support direct payments in 20+ cryptocurrencies, including BTC, ETH, SOL, DOGE, TON, and PEPE, eliminating the need for USDT conversion.
Is PEPE A Good Investment?
Reviewing the Pepe project’s roadmap, it appears there are no detailed plans other than anticipation that $PEPE and similar meme coins will dominate. Given this lack of clear direction and with an already sizable community of over 764,000 Twitter followers, the project’s price growth potential may be capped.
However, meme coins have a reputation for offering significant returns, as their values can surge dramatically when supported by strong community movements.
This was evident when Pepe’s value skyrocketed by over 222% to reach a new all-time high (ATH) following its listing on the Binance exchange. A similar significant announcement in 2026 could propel Pepe to surpass its previous ATH.
Why is Pepe down today?
Pepe’s price faces minor selling around recent highs. This pushed the price of PEPE toward the intra-day low around $0.0000023.
Will Pepe Recover?
If buyers hold the price above the $0.000003 level strongly, we might see further upward rally in the Pepe price chart.
What is Pepe price prediction for 2026?
The Pepe price prediction for 2026 expects the meme coin to record a maximum level of $0.000025.
Will Pepe price reach $0.0001?
Pepe’s price might touch the $0.0001 mark by the end of 2031. However, this price milestone entirely depends on the utility of Pepe coin and future buying demand.
Will Pepe price reach $1?
Pepe has a great community, and the hype is high for the meme coin. If everything remains good, we might see Pepe’s price touch $1 soon or by 2060.
PEPE Price Prediction June 2026
If BTC price records a move toward $70K this month, we might see PEPE price skyrocketing. We expect the PEPE price to record minimum and maximum prices of $0.0000025 and $0.000004, respectively. The average price might be around $0.0000032.
Month
Potential low ($)
Potential average ($)
Potential high ($)
June 2026
0.0000025
0.0000032
0.000004
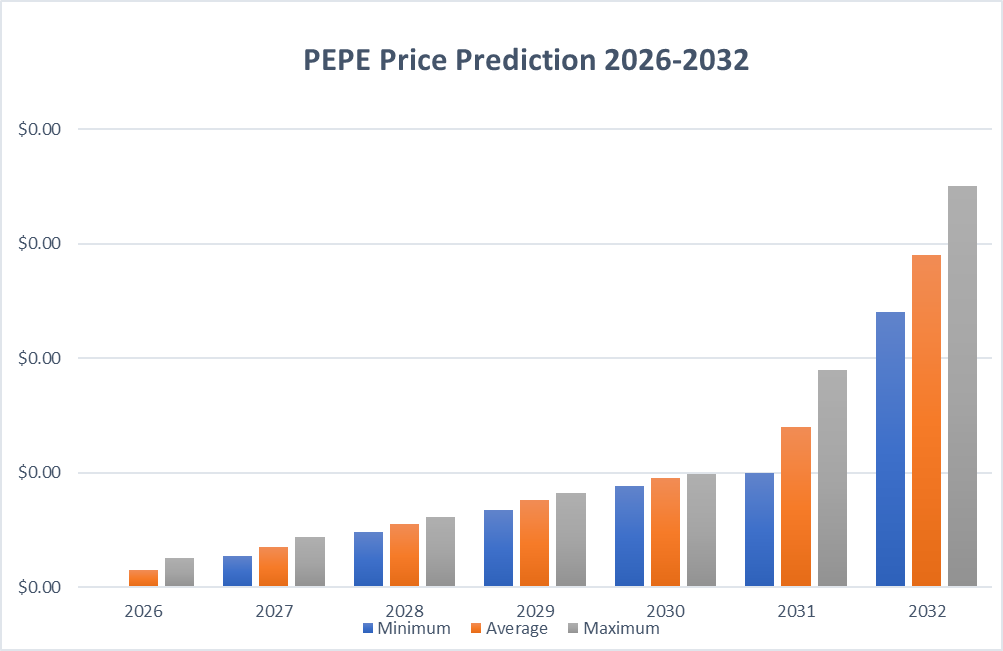
Pepe price prediction 2026
The Pepe roadmap is somewhat vague, with few definitive plans beyond the expectation that $PEPE and similar meme coins will dominate the market. Despite its robust community, this lack of clear direction might cap the project’s price potential.
Meme coins have a reputation for offering significant financial returns, as their values can surge rapidly when supported by their communities.
The impact of major announcements was evident when Pepe’s value soared by more than 222% following its listing on the Binance exchange, reaching an all-time high.
In 2026, Pepe’s minimum expected price is projected to be $0.000003. It may peak at a maximum value of $0.00002, with an average trading price of $0.000015 throughout the year.
Year
Potential low ($)
Potential average ($)
Potential high ($)
2026
0.000002
0.000015
0.000025
PEPE price predictions 2027-2032
Year
Minimum Price ($)
Average Price ($)
Maximum Price ($)
2027
0.000027
0.000035
0.000044
2028
0.000048
0.000055
0.000061
2029
0.000067
0.000076
0.000082
2030
0.000088
0.000095
0.000099
2031
0.0001
0.00014
0.00019
2032
0.00024
0.00029
0.00035
PEPE price forecast for 2027
Pepe must offer tangible value to reach a valuation comparable to Shiba Inu and Dogecoin. For instance, Shiba Inu is developing Shibarium, a layer-two scaling solution on Ethereum, alongside various protocols and tools for its community. Meanwhile, Dogecoin is enhancing tools and libraries that facilitate the integration of $DOGE as a payment option for businesses.
According to predictions and technical analysis, Pepe could achieve a minimum price of $0.000027 in 2027. The price may rise to a maximum of $0.000044, with an average expected trading price of $0.000035.
Pepe Price Prediction 2028
The forecast for 2028 suggests that Pepe will have a minimum price of $0.000048. The maximum price is projected to be $0.000061, with an average price of $0.000055 throughout the year.
Pepe price prediction 2029
By 2029, the lowest predicted price for Pepe is $0.000067. It might reach a maximum price of $0.000082, with the average price expected to be around $0.000076.
Pepe price prediction 2030
Based on forecasts and technical analysis, the price of Pepe in 2030 is expected to start at a minimum of $0.000088. It could reach a maximum of $0.000099, with an average trading value of $0.000095.
Pepe price prediction 2031
Drawing from deep technical analysis of past PEPE data, the price in 2031 is projected to have a minimum value of $0.0001. The maximum price could reach $0.00019, with an average value of $0.00014 throughout the year.
Pepe price prediction 2032
By 2032, the lowest predicted price for Pepe is $0.00024. It might reach a maximum of $0.00035, with the average price expected to be around $0.00029.
PEPE price prediction 2026-2032
Pepe price prediction: Analysts’ forecast
Firm name
2026
2027
Coincodex
0.00001623
0.00001320
DigitalCoinPrice
0.0000105
0.0000148
Cryptopolitan’s Pepe price prediction
The significant influence of major announcements on Pepe’s market performance was demonstrated when its value rose by over 222% after being listed on the Binance exchange, achieving a record high. Another prominent event could similarly propel Pepe to unprecedented levels.
Cryptopolitan predicts that, in 2026, Pepe’s minimum expected price is projected to be $0.000002. It may peak at a maximum value of $0.000025, with an average trading price of $0.000015 throughout the year.
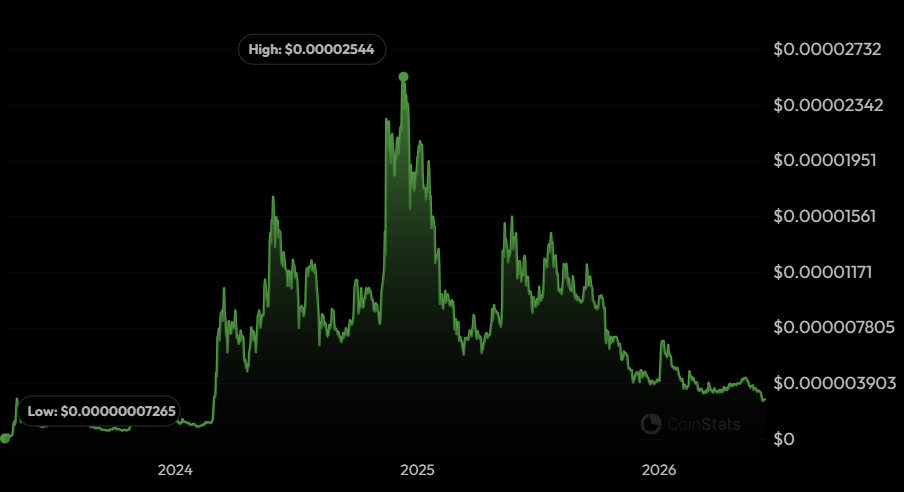
Initial Market Entry and Early Fluctuations: PEPE was introduced to the open market in May 2023, starting at $0.000001514. It experienced a peak at $0.000008117 in July 2023, followed by a dip to $0.0000006105 shortly after.
End of 2023 and Trends in 2024: By the close of 2023, the price of PEPE stabilized at $0.000001335. However, 2024 began with a downward trend, with the price dropping to $0.00001237 by mid-February.
Record High in March 2024: Amidst a surge in the memecoin sector, PEPE reached a new all-time high of $0.00001074 on March 14, 2024, but slightly decreased to $0.0000083 by March 21, 2024.
In May, the price of Pepe surged exponentially, and a new ATH was formed each week. On 27 May, Pepe price reached a new ATH at $0.00001718.
However, the price heavily declined in June as it broke below the crucial level of $0.00001.
In July, though the Pepe price touched $0.000012, it failed to maintain its momentum and dropped toward $0.0000093.
In August, Pepe’s price dropped toward the $0.0000058 level. However, it is now recovering slightly.
In September, the price of Pepe witnessed extreme fluctuation; however, it ended the month on a bullish note as it hit $0.000012.
Pepe price experienced an Uptober rally later as it surged toward the high of $0.000012 in October. However, the price is now declining below support channels.
In November, the price of Pepe skyrocketed above $0.000026.
In December, Pepe consolidated below $0.00002.
In January 2025, Pepe skyrocketed toward $0.000028, but it then declined to as low as $0.000010 in February.
Pepe price crashed in February as it dropped below $0.0000078.
In March, the price of Pepe declined heavily as it aimed for a low around $0.000005.
The price of Pepe attempted to surge above $0.00001 in April but it failed to meet buyers’ demand. This resulted in a bearish decline in the PEPE price chart. In early May, the price of Pepe skyrocketed toward $0.000013.
However, in early June, the price of Pepe declined toward the low of $0.00001. By June’s end, Pepe dropped toward $0.000009.
In July, PEPE price surged toward the high of $0.000015 but later declined below $0.00001 in early August.
By the end of August, the price of PEPE declined below $0.00001 again.
In September, PEPE price declined further toward $0.0000088.
The price of Pepe declined further in October and dropped toward $0.000005 in early November. By the end of November, the price of PEPE declined toward the low of $0.000004.
PEPE ended 2025 below $0.000004; however, it surged above $0.0000072 in early January.
By the end of January, the price of PEPE dropped toward $0.000004. In March, the price of PEPE declined toward $0.0000033.
In April, PEPE surged toward $0.000004. By the end of May, PEPE price dropped toward $0.0000034.


 FUD Hits 2026 High: Why It Could Be a Bullish Twist")