NEAR's Breakout Moment: A Hyperliquid Integration and a Platform Built for the "Intent Economy"
A high-profile endorsement, a major DeFi integration on near.com, and steady growth in chain abstraction have put NEAR back on traders' radars — even as price action stays volatile.
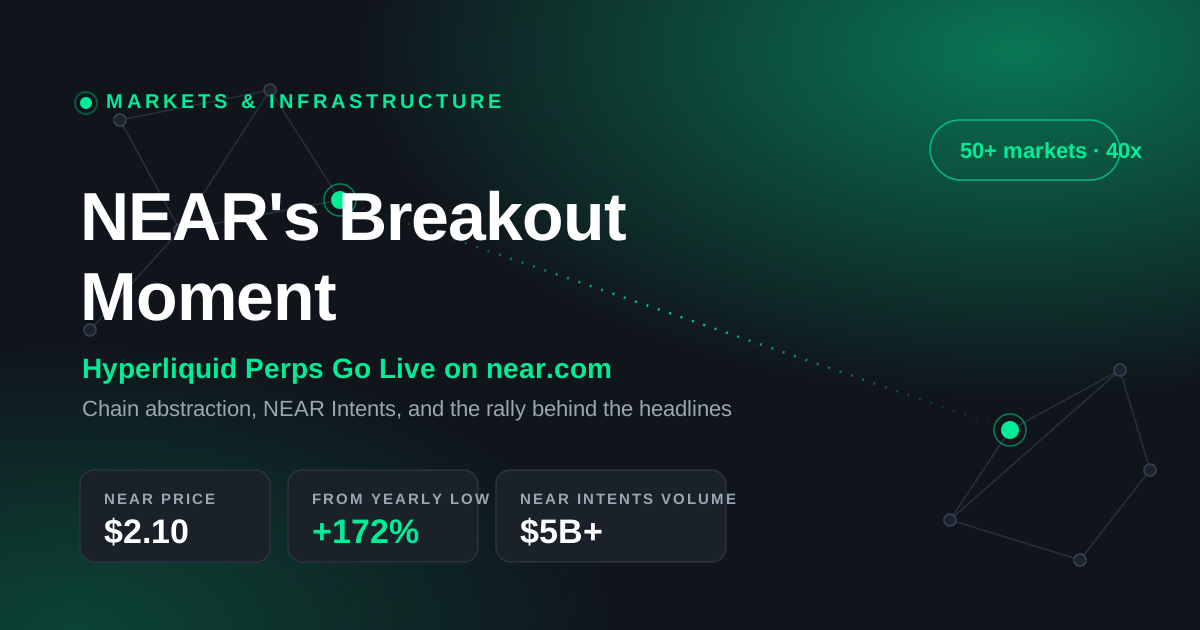
NEAR Price (mid-June 2026)
≈ $2.10
Market Cap
≈ $2.6B
Rally from yearly low
+172%
NEAR Intents volume
$5B+
After months of grinding through a broader altcoin slump, NEAR Protocol has reemerged as one of crypto's most-watched layer-1 stories. A combination of a high-profile endorsement, a major DeFi integration on its consumer-facing platform, and steady growth in its chain-abstraction infrastructure has put NEAR back on traders' radars — even as the token's price action remains volatile and far below its all-time highs.
The Surge: From "Holy Trinity" Hype to Hard Numbers
The most dramatic catalyst came when BitMEX co-founder and Maelstrom CIO Arthur Hayes grouped NEAR alongside Hyperliquid (HYPE) and Zcash (ZEC) as his "holy trinity" of altcoin picks. NEAR's 30% move stood out even as HYPE and ZEC also rallied sharply that day, outperforming Bitcoin over the same timeframe. Hayes framed each token around a distinct thesis — Hyperliquid for high-performance trading infrastructure, Zcash for privacy, and NEAR for scalability — and the endorsement carried extra weight given his fund's market influence.
"Intents is the next level of abstraction from blockchain. Every technological revolution removes another layer of complexity."
— @ilblackdragon, on the NEAR Protocol roadmap
That single-day pop pushed NEAR to a six-month high above $2.30, and it capped a broader run that saw the token jump roughly 172% from its lowest point of the year, a move that tracked gains across AI-narrative tokens.
Since then, the rally has cooled considerably. As of mid-June 2026, NEAR is trading in the $2.10 range, with a market capitalization of roughly $2.6 billion and daily trading volume around $434 million, putting it just inside the top 30 cryptocurrencies by market cap. That's still about 90% below its all-time high of $20.44, though more than 280% above its all-time low. Sentiment indicators have swung back toward caution — technical readings show NEAR in a bearish short-term trend with a Fear & Greed score signaling "Extreme Fear" — a reminder that the underlying narrative and the near-term price chart are telling somewhat different stories right now.
What's Driving the Fundamentals Case
Beyond the Hayes-fueled headlines, NEAR's bull case rests on a few concrete developments:
Dynamic resharding (Upgrade 2.13)
A major infrastructure upgrade slated for June 2026 introduces dynamic resharding, which automatically adds new shards as network demand grows — without requiring a governance vote or manual intervention each time the chain gets busy. This builds on NEAR's existing Nightshade sharding design, which earlier in its rollout had already increased network throughput by 12.5% with nine operational shards.
Post-quantum security
NEAR is integrating FIPS-204, a post-quantum cryptography standard, into its testnet, letting users upgrade account security against future quantum-computing attacks with a single transaction. The team is also exploring zero-knowledge proofs as a backstop for account ownership verification.
A potential Grayscale ETF conversion
Analysts are watching the SEC's review of a Grayscale NEAR product (GSNR) as a possible catalyst that could bring fresh institutional flows, similar to the inflow dynamics that have benefited Hyperliquid's recently launched ETFs.
The Hyperliquid Integration on Near.com
The integration generating the most immediate buzz is the arrival of Hyperliquid perpetuals directly inside near.com. NEAR Protocol announced that Hyperliquid perps are now live on near.com, letting users deposit assets from 35+ chains directly into HyperliquidX to access more than 50 markets with up to 40x leverage.
What makes this notable isn't just the access to deep perpetuals liquidity — it's how users get there. The integration is built on NEAR's "Intents" framework, which NEAR's team has been positioning as the next layer of abstraction above the blockchain itself. As the protocol's account on X put it, the old workflow required users to bridge to a chain, locate the right venue, and fund a new wallet before they could trade; now the flow is simply: open near.com, turn on perps, and trade — with "confidential perps" described as the next step in that roadmap.
This single feature is a showcase for NEAR's broader architectural pitch. NEAR combines User-Owned AI — ensuring agents act in users' interests — with Intents and Chain Abstraction, which eliminate blockchain complexity for goal-driven transactions across chains, on top of a sharded architecture built for scalability, speed, and low-cost execution. Rather than retrofitting AI onto existing infrastructure, NEAR was designed from day one as execution-layer infrastructure for AI agents and chain-abstracted commerce.
Platform Growth: Near.com and the Intents Network
The Hyperliquid integration sits on top of a chain-abstraction layer that has been quietly scaling for over a year. NEAR Intents, introduced in November 2024 and unveiled as a core piece of the Chain Abstraction initiative at ETHDenver 2025, lets users or AI agents specify a desired outcome while a network of solvers handles execution across chains, markets, or APIs — and as of November 2025 it had surpassed $5 billion in all-time transaction volume.
That liquidity layer is increasingly being plugged into other ecosystems. NEAR Intents integrated with Starknet, bringing intent-based, chain-abstracted swaps to Starknet users and allowing them to move assets from any of NEAR Intents' roughly 25 supported chains directly into the network. Around the same period, NEAR Intents was integrated into SimpleSwap — a self-custodial aggregator that has processed more than 20 million swaps — powering cross-chain execution across SimpleSwap's web app, mobile app, and API, which is already used by more than 150 applications.
On the consumer side, near.com itself has been adding features aimed at everyday users rather than crypto-native traders. The platform recently launched confidential payments, letting users send crypto in a private way that only the sender and recipient can see — a feature that contributed to the token's rally. Looking further out, a NEAR Mobile roadmap unveiled at NEARCON 2026 focuses on practical usability: full fee abstraction so users don't need to hold NEAR for gas, expansion into new blockchain ecosystems, customizable app themes, and deeper integration of assets and yield opportunities.
The Risks That Keep This a Two-Sided Story
None of this guarantees a sustained rally. Layer-1 competition remains intense, NEAR's token emissions from staking rewards add ongoing dilution pressure, and macro conditions — from rate policy to broader risk appetite — can swamp project-specific catalysts. The June 2026 resharding rollout and the fate of the Grayscale ETF application are the two most concrete near-term events that could move the needle in either direction, and the current "Extreme Fear" reading in technical indicators suggests the market hasn't yet priced in the more optimistic scenarios.
The Bottom Line
NEAR's recent surge was as much about narrative as fundamentals — an Arthur Hayes tweet can move a token 30% regardless of roadmap progress. But underneath the headline, the Hyperliquid integration on near.com represents a genuinely differentiated product: one-tap access to the deepest perpetuals liquidity in crypto, routed through an intents-based system that abstracts away bridging, wallets, and chain selection entirely. Combined with a growing roster of Intents integrations (Starknet, SimpleSwap), a scalability upgrade landing this month, and an early move into post-quantum security, NEAR is making a coherent case that it's building the infrastructure layer for an "agentic," chain-abstracted internet — even if the market's verdict on that thesis, for now, remains a work in progress.
Disclosure: This article is for informational purposes only and does not constitute financial advice. Cryptocurrency markets are highly volatile; do your own research before making investment decisions.
The average Sonic price prediction for 2026 is $0.03259.
Holders can anticipate a maximum price of $0.1574 in 2029.
By 2032, Sonic (S) might touch $0.2967
Sonic is a high-performance EVM Layer 1 blockchain built for DeFi applications, offering up to 400,000 TPS and sub-second finality. The network introduced its Fee Monetization (FeeM) program, allowing developers to earn up to 90% of the fees generated by their applications. Sonic also features a native Ethereum bridge called the Sonic Gateway, which includes a Fast-Lane transaction feature and a fail-safe security mechanism. For investors and traders following Sonic price prediction trends, these features are important because they support ecosystem growth, developer activity, and the chain’s long-term demand.
Sonic emerged from Fantom’s rebrand after Michael Kong announced the Sonic mainnet launch in March 2024. Fantom later fully transitioned to Sonic on January 16, 2025, as the project expanded through partnerships with Chainlink, Pyth Network, Alchemy, Dune, and Safe.
Sonic reached an all-time high of $1.03 in January 2025 before falling to a low of $0.0368 in February 2026. Investors’ questions remain. Will Sonic reclaim Fantom’s all-time high of $3.48? How high can Sonic (S) go in the coming years? Let’s take a look at Sonic’s price prediction and price prediction tool to answer these questions.
Sonic Price Prediction: An Overview
Cryptocurrency
Sonic
Token
S
Price
$0.02906
Market Cap
$83.71M
Trading Volume (24-hour)
$19.27M
Circulating Supply
2.88B S
All-time High
Jan 05, 2025 $1.03
All-time Low
Jun 05, 2026 $0.03036
24-h High
$0.040901
24-h Low
$0.040163
Sonic (S) price prediction: Technical analysis
Volatility
4.09% (Medium)
50-Day SMA
$ 0.04407
Price Prediction
$ 0.02376 (-25.50%)
14-Day RSI
37.59 (Neutral)
Green Days
11/30 (37%)
Sentiment
Bearish
Fear & Greed Index
12 (Extreme Fear)
200-Day SMA
$0.06032
Sonic price analysis S falls to a new all-time low as sellers stay in control
TL;DR Breakdown
Today’s Sonic price analysis shows strong bearish pressure as S falls to a fresh all-time low of $0.02768
Sonic’s current resistance is at $0.0321, while the immediate support remains at the all-time low of $0.0277
Today, Sonic is trading around $0.02924, down 6.32% in the last 24 hours
As of June 6, 2026, Sonic’s price analysis shows a bearish market structure. Sonic is currently trading at $0.02928, down 6.32% in the last 24 hours. Selling pressure increased today, driven by Sonic’s new all-time low price of $0.02768, underscoring the continued market dominance by bears. Although buyers managed to trigger a small recovery from the lows, it remains weak as the price continues to trade near historically depressed levels.
Sonic (S) price analysis 1-day chart
Analyzing the one-day chart for Sonic, it shows persistent selling pressure after the token recorded a fresh all-time low.S dropped to $0.02768, breaking below previous support levels and extending its broader downtrend that has been in place for several months.
The latest daily candle remains bearish despite a small recovery from the day’s low. The decline reflects weak market confidence, with sellers continuing to dominate price action. Sonic is now trading more than 97% below its all-time high of $1.03, showing the level of the long downtrend.
Trading activity has weakened over the past 24 hours, with volume falling by 26.14% to $18.93 million. The decline in volume suggests that market participation is cooling despite Sonic’s drop to a new all-time low, indicating limited buying interest at current levels.
S/USD Chart: TradingView
Technical indicators continue to favor sellers. The Relative Strength Index (RSI) has dropped to 21.9, placing Sonic deep in oversold territory. While such levels often precede temporary relief rallies, the indicator is yet to show any meaningful bullish divergence. The continued decline in RSI reflects strong bearish momentum and weak buying interest.
The MACD indicator remains negative as the MACD line trades below the signal line. Expanding red histogram bars suggest that downward momentum is still dominating the market despite today’s rebound from the all-time low. This setup indicates that sellers continue to control the broader trend.
Buyers need to reclaim the $0.0320 area before any meaningful short-term reversal can be considered. Until then, rallies may continue to attract selling pressure.
S’s technical analysis 4-hour chart
The 4-hour Sonic price chart shows bears still maintaining strong control of the market. Although the token has stabilized around the $0.0294 level, buying momentum remains weak as the broader trend continues to favor sellers.
The RSI on the 4-hour timeframe has dropped to 20.17, still in oversold territory. While this suggests selling pressure has become extreme, the indicator has yet to show a convincing recovery signal. The MACD indicator remains bearish.
S/USD Chart: TradingView
The MACD line continues to trade below the signal line, confirming that downward momentum is still dominant. However, the shrinking red histogram bars suggest that bearish momentum is beginning to slow, although buyers have not yet gained enough strength to reverse the trend.
The nearest resistance is at $0.0300, followed by a stronger barrier around $0.0320. On the downside, immediate support remains at the recently established all-time low of $0.02768. If bears force a break below this level, Sonic could face another low as price discovery continues.
Sonic technical indicators: Levels and action
Daily simple moving average (SMA)
Moving averages are calculated from the average closing price over a set period.
Period
Value
Action
SMA 3
$ 0.03570
SELL
SMA 5
$ 0.03739
SELL
SMA 10
$ 0.03926
SELL
SMA 21
$ 0.04228
SELL
SMA 50
$ 0.04407
SELL
SMA 100
$ 0.04316
SELL
SMA 200
$ 0.06032
SELL
By June 29, 2026, Sonic’s 200-day Simple Moving Average is projected to drop to $0.05181, while the 50-day SMA is estimated to reach $0.03714.
Daily exponential moving average (EMA)
Period
Value
Action
EMA 3
$ 0.03547
SELL
EMA 5
$ 0.03674
SELL
EMA 10
$ 0.03885
SELL
EMA 21
$ 0.04130
SELL
EMA 50
$ 0.04328
SELL
EMA 100
$ 0.04941
SELL
EMA 200
$ 0.08657
SELL
What can you expect from the Sonic price analysis next?
Sonic remains in a corrective trend, but Sonic’s price action is showing early signs of stabilization around the $0.0290 level, and many traders use candlestick charts to assess momentum. Each candlestick shows the opening, closing price, highest, and lowest prices for a chosen interval, helping analysts determine whether support is holding or a rebound may follow.
A successful defense of the $0.02768 support level could allow the token to recover toward $0.0300 and potentially $0.0320 in the coming sessions, according to Sonic key price levels and recent market activity. On the downside, a break below the all-time low of $0.02768 would likely expose Sonic to further weakness, with sellers attempting to establish new lower levels.
In a relatively small market, whales can control short-term moves. Until buyers reclaim the $0.0300–$0.0320 resistance zone, the overall market structure remains bearish despite oversold conditions appearing on technical indicators.
Why is Sonic down today?
Sonic (S) is trading around, down 12.44% over the last seven days, suggesting the broader trend remains bearish despite today’s modest recovery. With no major news catalyst driving recent price action, the decline appears to be due to typical altcoin volatility and profit-taking following earlier gains.
Is Sonic a good investment?
Sonic is a high-speed, scalable blockchain platform that competes with established chains such as Solana and Ethereum L2s, positioning itself as a performance-focused chain within the blockchain ecosystem. Despite its potential, investing in Sonic (S) involves risks typical of cryptocurrencies, including market volatility, so any current forecast should weigh whether it looks like a good buy right now.
While Sonic does not currently lead the market, it maintains a credible and stable position as a reliable, mid-tier chain. Sonic (S) network is also transitioning from a community-driven layer-1 to a more structured corporate model, which investors should factor in before they invest. Own research and assessing personal risk tolerance are essential for anyone considering S as a potential investment opportunity.
Will Sonic reach $5?
The price of Sonic could reach $0.1215 by 2030, with price predictions suggesting a high of $0.1678. The base case scenario for Sonic’s price by 2030 is projected to be around $0.1215, with potential highs depending on market conditions. However, achieving this depends on market conditions, overall technical factors, and fundamental factors.
Will Sonic reach $10?
Based on our technical analysis of multiple technical quantitative indicators, S’s price projections for 2032 estimate a range, with Sonic expected to reach about $0.2967 but not approach double-digit prices within the next 6 years. A move to $10 is not guaranteed; even by 2046, Sonic is expected to reach $0.8797, still far below $10 and requiring over 25,386% upside to hit that mark.
Is Sonic a safe network?
Sonic is regarded as a secure blockchain platform whose architecture differs from traditional blockchains, using its unique Lachesis consensus mechanism to enable high-speed, scalable transactions.
Its directed acyclic graph approach helps deliver theoretical throughput of up to 10,000 transactions per second with finality in less than 500 milliseconds. However, as with any blockchain network, users should exercise caution, use official channels, and follow best security practices to protect their assets.
Does Sonic have a good, long-term future?
Sonic shows potential for a strong long-term future, with price predictions suggesting significant growth by 2030 and beyond. Analysts forecast prices could reach between $0.1215 and lowest prices at $0.1678, driven by its unique blockchain technology, increasing adoption in decentralized applications, and robust ecosystem growth.
Ecosystem growth, fueled by increased developer activity and more developers joining the platform, is crucial for Sonic’s long-term success. Total Value Locked (TVL) in dApps is a critical metric for long-term growth, reflecting real-world usage and platform strength. Sonic also continues airdrop campaigns and support for liquid staking tokens to help boost TVL and revenue generation.
Additionally, the Sonic ecosystem has established a $25 million fund to attract builders and improve user metrics, further supporting future expansion. Future ecosystem expansion may also benefit from plans to pursue a Spot ETF and private investment vehicles on Nasdaq, though the long-term impact remains uncertain. However, market volatility remains a concern.
Recent news/opinion on Sonic (prev. FTM)
Sonic recently expanded its ecosystem focus through infrastructure and security upgrades, including USDC integration support and new stablecoin functionality via Flying Tulip. The developments aim to strengthen Sonic’s position as a developer-friendly EVM chain while improving on-chain utility and security, even as the token continues facing bearish pressure in the broader crypto market.
Sonic recently highlighted the growing adoption of its vertical integration model. The network revealed that its USSD stablecoin is generating approximately $80,000 in annualized real-world asset (RWA) yield without incentives, while Shadow’s AutoVault has already purchased around 350,000 S tokens through market activity.
Vertical integration on Sonic is moving from concept to data.
With zero incentives, $USSD is at ~$80K annualized RWA yield, while @ShadowOnSonic‘s AutoVault has already bought ~350K $S from market activity.
The Sonic price prediction for June 2026 suggests a modest recovery from current levels, with the price expected to range between $0.02881 and $0.03259. The average price is projected to be around $0.03259, as market sentiment, trading volume, and broader crypto market conditions continue to influence short-term price action.
Period
Potential Low ($)
Average Price ($)
Potential High ($)
Sonic (S) price prediction June 2026
$0.02881
$0.03259
$0.03259
Sonic price prediction 2026
In 2026, Sonic (S) is expected to trade between $0.02750 and $0.03789, with an average price of around $0.03270. This suggests relatively stable price action throughout the year, with modest upside potential if ecosystem growth and market sentiment improve.
Period
Potential Low ($)
Average Price ($)
Potential High ($)
Sonic Price Prediction 2026
$0.02750
$0.03270
$0.03789
Sonic price forecast 2027– 2032
price prediction chart
Year
Potential Low ($)
Average Price ($)
Potential High ($)
2027
$0.0499
$0.0581
$0.0662
2028
$0.1128
$0.1296
$0.1465
2029
$0.1169
$0.1372
$0.1574
2030
$0.1215
$0.1446
$0.1678
2031
$0.1545
$0.1717
$0.1889
2032
$0.2285
$0.2626
$0.2967
Sonic (S) price prediction 2027
The Sonic forecast for 2027 speculates that the price might reach a maximum of $0.0662 by 2027. On the lower end, corrections may pull the price to $0.0499 with an expected average trading price of around $0.0581. As an alternate modeled scenario, the predicted price for 2027 could be around $0.03998, representing a potential 1.90% increase.
Sonic (S) price prediction 2028
Sonic’s (prev. FTM) 2028 forecast of $0.1128–$0.1465, averaging $0.1296, is linked to growing adoption of its rebranded ecosystem. By then, expanded DeFi, NFT, and gaming use cases are expected to strengthen utility and demand. The projected rise in Sonic’s price by 2028 is supported by its Fee Monetization model and the fee burning mechanism, which incentivize developer activity and reduce token supply. Network scalability upgrades and rising developer engagement support gradual appreciation, while market cycles keep growth within range.
Sonic (S) price prediction 2029
In 2029, Sonic’s market price might stabilize at $0.3238 while attaining an average trading price of around $0.2698, and a minimum price of around $0.2158. The broader outlook points to $0.03250 by the end of 2026, $0.1464 by 2030, and $0.2327 by 2040, based on combined technical and fundamental factors.
Sonic (S) price prediction 2030
Sonic is expected to reach a maximum of $0.1678 by 2030. However, it could fall to $0.1215 with an average price of $0.1446.
Sonic (S) price prediction 2031
Sonic is projected to hit a high of $0.1889 in 2031. In the event of a price correction, it could drop to $0.1545 with an average of $0.1717
Sonic (S) price prediction 2032
Sonic is expected to reach a high of $0.2967 in 2032. The average trading price is expected to be $0.2626, and the minimum price is projected to be $0.2285.
Sonic price prediction 2026-2032
Sonic market price prediction: Analysts’ FTM price forecast
Firm Name
2026
2027
Coincodex
$ 0.02589
$ 0.06573
DigitalCoinPrice
$ 0.03189
$0.0817
It’s important to note that these analyst forecasts may be influenced by broader market rallies and shifts in market sentiment, which can drive Sonic’s price targets higher or lower depending on overall investor optimism or pessimism.
Cryptopolitan’s Sonic (S) price prediction
Our predictions show that the Sonic token could achieve a minimum value of $0.02750 in 2026. The Sonic price may reach a maximum value of $0.03789, with an average trading price of $0.03270 throughout 2026. Investor confidence, along with supply and demand dynamics, plays a key role in Sonic’s price action.
Fundamental events such as hacks and other real-world occurrences can significantly impact price movements. Please note that the content provided on this page is for informational purposes only and does not constitute investment advice. Conduct your own research before making financial decisions
Sonic’s (S) historic price sentiment
Sonic price history
Fantom (FTM) launched in 2018 at $0.0182, hit a low of $0.00229 in 2020, and peaked at $3.24 in 2021 during the DeFi boom.
Following the 2022 bear market, FTM recovered to $0.55 by early 2024 before rebranding to Sonic Labs in August 2024.
The 1:1 FTM-to-Sonic (S) token swap began in December 2024, with Binance completing it by January 2025.
Sonic hit a new ATH of $1.029 in January 2025, but steadily declined to around $0.33 by late August.
By early September 2025, Sonic traded stably between $0.3092 and $0.3126.
Early September, Sonic traded around $0.309–$0.313, showing relative stability compared to its August lows.
Mid-September – Price remained in the ~$0.30–$0.33 band, with minor upward drift toward ~$0.32.
Late September – The token approached $0.26, as reported by markets, showing a decline and increased volatility.
Early October – Trading price dropped further into the ~$0.23–$0.26 range, indicating a weakening trend.
By November 3, Sonic had fallen to approximately $0.122, marking a substantial decline from early September levels.
At the beginning of November 2025, Sonic (S) traded around $0.12–$0.14, occasionally spiking to roughly $0.17 before retreating.
Through mid-November, the price generally drifted downward, reaching a low near $0.10–$0.11 around November 21.
From late November to December 3, S recovered slightly — trading in a narrow band around $0.10–$0.11, suggesting consolidation and stabilization after the mid-month slump.
From early December, Sonic traded around $0.071–$0.075 on Dec 3–Dec 6, then moved higher through mid-December as the price climbed into the $0.085–$0.095 zone by Dec 14–Dec 17, reflecting increasing buying interest late in the year.
Into late December and early January, S stabilized in the $0.07–$0.08 range before rising above $0.08, closing around $0.082–$0.086 by Jan 4 2026, showing a modest recovery into the new year.
On January 4, 2026, Sonic was trading near $0.086–$0.090 after stabilizing from December weakness, with modest rebounds in the first week of January as buyers emerged off key support levels.
By February 3, 2026, Sonic had drifted lower toward roughly $0.065–$0.070, reflecting continued selling pressure and failed rallies, with price consolidating near the low end of its recent range.
Sonic (S) traded around $0.052 to $0.048 between Feb 3 and Feb 10, 2026, before declining toward the $0.041 to $0.039 range by late February amid steady selling pressure.
From early March to Mar 14, 2026, Sonic moved between $0.038 and $0.044 with a gradual rebound attempt as the price stabilized near the $0.040 support zone.
From March 14 to late March, Sonic drifted lower from $0.0514 toward $0.040–$0.042, unable to sustain any meaningful bounces amid broad market weakness.
By April 7, its price pressed critical $0.040 support at $0.0396–$0.0414 — dangerously close to its all-time low of $0.0368 set on February 28.
Sonic is trading at around $0.04951 at the start of May 2026.
By the end of May 2026, Sonic had retreated to around $0.040, erasing much of its early-May gains after a failed rally above $0.055 and stabilizing near a key support zone amid continued selling pressure.
At the start of June 2026, Sonic traded around $0.03136, extending its decline after losing the key $0.040 support level in late May.
XYO’s Layer 1 Gets 2–5x Faster as AI Demand for Verified Data Heats Up | Crypto Coin Show
Network Update·XYO Network·April 2026
XYO’s Layer 1 Gets 2–5x Faster as AI Demand for Verified Data Heats Up
XL1’s latest performance upgrade cuts block validation time significantly, as XYO Labs doubles down on its role as a data provenance layer for AI systems and physical infrastructure networks.
AA
Ashton Addison, Editor in Chief
Crypto Coin Show · April 2026
XYO Network
2–5×
Speed increase
~1mo
Dev time vs. 6 months prior
2018
CCS first covered XYO
Q3 ’25
XL1 mainnet launch
XYO Network has shipped a significant performance upgrade to XL1, its Layer 1 blockchain, delivering a 2 to 5 times improvement in block processing speed less than a year after the network’s Q3 2025 mainnet debut. The upgrade arrives as demand for verified, on-chain data provenance is accelerating across the AI sector — a use case XYO has been building toward since long before decentralized physical infrastructure networks became a mainstream narrative.
The improvements were developed in roughly one month, a timeline that would have required approximately six months under traditional development cycles. The team credits AI-assisted development tools with enabling that compression, using them for continuous performance profiling, unit test generation, and regression detection across builds.
What the Upgrade Actually Changes
The core speed gain comes from faster account balance indexing during block validation. When a node validates a new block, one of the more computationally expensive operations is retrieving current account balances. Improving how that data is indexed reduces the time it takes to finalize each block — and that improvement compounds across the whole chain.
For stakers, more blocks per unit of time means more XL1 rewards generated from staking XYO. It also means more XL1 burned through gas, which accelerates the protocol’s path from net-inflationary toward deflation — the point at which token burn from usage exceeds new issuance from block rewards.
How XL1 Token Economics Work
Users stake XYO to participate in the network and earn XL1 as a block reward. XL1 pays gas on the chain, and that gas is burned. Faster blocks means more XL1 issued to stakers and more burned through usage — tightening supply dynamics on both ends simultaneously.
The team also built in systematic regression testing: automated profiling benchmarks that compare performance against previous builds after each release, catching slowdowns before they accumulate. A chain that improves 10% in one build and regresses 10% in the next has not actually improved. Preventing that is a different engineering problem than raw optimization, and one the team now has automated tooling to address.
Why AI Needs What XYO Builds
XYO’s core infrastructure has always been about data provenance — the ability to record not just what a piece of data says, but where it came from, when it was captured, and by whom, in a way that is immutable and independently verifiable. That problem has become considerably more urgent as AI systems ingest larger volumes of data from uncontrolled sources.
Most large language models learn from the open internet, and the internet does not come with a chain of custody. Data may be inaccurate, synthetic, outdated, or derived from sources that were never authorized to share it. As AI becomes embedded in financial decisions, medical systems, and autonomous vehicles, the inability to audit what a model learned from is shifting from an academic concern to a legal and commercial one.
“Once provenance goes into a model, it becomes blurred and kind of lost. At some point they’re going to have to start having audit trails.”
Ari Trout, Co-founder & CEO, XYO Labs
XYO’s architecture separates raw data storage from the metadata required to verify it. The full dataset — a high-resolution sensor reading, a video frame, a precise location coordinate — lives off-chain in private storage. What goes on-chain is a hash, a timestamp, and a reduced version of the data: enough to prove the original existed at a specific time without exposing its contents. If the full data ever needs validation, it can be revealed and checked against the on-chain record. The team calls this “reveal on demand” privacy.
The Witness System: Micro-Consensus for Real-World Data
One of the more distinctive parts of XYO’s architecture is how it handles data from physical sources — IoT sensors, weather stations, GPS devices, cameras. Rather than trusting a single source, the protocol uses a witness-based system: multiple independent sources observe the same data point without knowing about each other, and their readings are compared. If four out of five agree and one is an outlier, the outlier gets flagged. If consensus is insufficient, the data is resampled.
This is micro-consensus applied to data collection rather than transaction validation — particularly relevant for the kinds of physical data AI systems are increasingly asked to act on, where a single compromised source could silently corrupt a model’s understanding of reality.
Storage Architecture
XL1 is deliberately designed to keep most data off-chain. Storing a 20-gigabyte video file on a blockchain is not practical, and XYO does not try to do it. Instead, the chain stores the provenance record — hash, timestamp, metadata — while the underlying data lives elsewhere. The principle mirrors how Ethereum’s off-chain indexers like Etherscan work: the source of truth is on-chain, but the full queryable picture is assembled by infrastructure that indexes against it.
Partners wanting higher-frequency data commits — more timestamps per second for a given sensor stream — can now do so at the faster block rate without degrading the rest of the network.
Physical AI and the Road Ahead
XYO tracked location data from its founding, and autonomous vehicles represent a natural next frontier. A self-driving car generates continuous streams of camera, LIDAR, and sensor data that must be distilled in real time by an edge device before any of it can be acted on. The car cannot stream raw video to a remote server and wait for instructions — decisions happen at the edge, from compressed metadata. But the original sensor data and a provenance record of how the edge device processed it still has audit value for liability, safety review, and model improvement.
The same logic applies to home robots, industrial drones, and any physical AI system where something going wrong generates a question: what did it actually do, and what was it seeing when it did it? XYO’s infrastructure is designed to answer that question without requiring every frame to live on a public ledger.
Developer Access
Developers can connect to XL1 now via browser wallet injection, a JavaScript SDK, or direct RPC endpoint calls. SDKs for Go, Kotlin, and additional languages are in development, with AI-assisted porting accelerating the timeline considerably compared to traditional manual porting.
AI as a Development Tool, Not Just a Use Case
The efficiency gains in XL1’s latest release were themselves produced using AI. The team used AI coding assistants to accelerate development, generate test coverage, run profiling benchmarks, and catch regressions that would otherwise require manual review. The result is a team that can iterate on its blockchain in weeks rather than quarters — a meaningful advantage in an environment where protocol development speed increasingly determines competitive position.
It is an example of what XYO’s co-founder describes as tooling mattering more than raw compute: giving a system the right tools to operate efficiently, rather than simply throwing more resources at it. The same principle that makes XYO relevant to AI data infrastructure is the one that made its latest upgrade possible.
Watch: Ari Trout on XYO Layer 1, AI Data Verification & DePIN
Full conversation with XYO Labs co-founder and CEO Ari Trout covering the XL1 performance upgrade, data provenance architecture, AI tooling, witness-based consensus, and the role of physical infrastructure in on-chain AI.
The Hyperliquid price prediction anticipates a high of $58.45 by the end of 2026.
In 2029, it will range between $136.37 and $155.85, with an average price of $146.11.
In 2032, it will range between $233.78 and $253.26, with an average price of $243.52.
Hyperliquid is a leading decentralized exchange (DEX). It has its own Layer 1 blockchain, and HYPE is its native token, which is used for staking, governance, and payments within the ecosystem.
One of the key features of Hyperliquid, along with its high-speed platform, is that it offers crypto perpetual futures for trading by its users without the need to own the asset. The platform supports a number of cryptocurrencies, including but not limited to BTC, ETH, SUI, AVAX, and SOL, to name a few.
Technically, the Hyperliquid blockchain is based on two protocols, namely HyperEVM and HyperBFT; combined, they help provide high-speed trading and Ethereum-based smart contracts with reliability to support the Hyperliquid ecosystem.
The Hyperliquid platform revolves around community participation, as token holders have voting rights to govern and influence developments taking place on the platform.
On November 29, 2024, Hyperliquid conducted an airdrop of its native token, HYPE, but unlike other players, it was selective in allocating the airdrop to only 94,000 users with an average value of $45,000 to $50,000, making it one of the most worthy airdrops in crypto history.
Let’s take a deep dive into what the future holds for the HYPE token in Cryptopolitan’s Hyperliquid price prediction for 2026 and beyond.
Overview
Cryptocurrency
Hyperliquid
Token
HYPE
Price
$38.41 (-1.44%)
Market Cap
$9.85B
Trading Volume
$260.05M
Circulating Supply
256.39M HYPE
All-time High
$59.30 (Sep 18, 2025)
All-time Low
$3.2 (Nov 29, 2024)
24-hour High
$39.32
24-hour Low
$38.08
Hyperliquid Price Prediction: Technical Analysis
Metric
Value
Price Prediction
$28.87 (-24.77%)
Price Volatility (30-day variation)
12.63%
50-Day SMA
$33.47
200-Day SMA
$34.22
Market Sentiment
Bullish
Fear & Greed Index
13 (Extreme Fear)
Green Days
17/30 (57%)
Hyperliquid Price Analysis
TL;DR Breakdown:
Hyperliquid price analysis confirms a downward trend at $38.41.
Cryptocurrency has lost 1.44% of its value.
HYPE token faces strong resistance around the $43.29 range.
On March 27, 2026, Hyperliquid price analysis revealed a downward trend for the altcoin. The coin is trading at $38.41 after finding resistance at $40.36. From an overall perspective, the currency lost a significant 1.44% in its value in the last 24 hours. The decrease creates relatively unfavorable circumstances for investors, as the altcoin is now shedding value. However, market conditions appear risky, as the token may continue to correct following the recent dip.
HYPE/USDT 1-day chart analysis
The one-day price chart of Hyperliquid Coin confirmed a bearish trend in the market. The cryptocurrency’s value decreased to $38.41 during the day, as bears strive to suppress the price further. At the same time, a red candlestick on the price chart signifies the presence of bearish elements. Sellers are leading the price action, as the coin is losing value as a result of the return of the bearish trend.
The distance between the Bollinger Bands defines the level of volatility. This distance is wide, leading to high volatility levels, as the bands are expanded. Moreover, the upper limit of the Bollinger Bands indicator, indicating resistance, has shifted to $43. Conversely, its lower limit, indicating support, has moved to $32.
The Relative Strength Index (RSI) indicator is trending in the neutral region. The indicator’s score has decreased to 55 today. This condition is reflected by a downward-pointing RSI curve. If selling activities continue to intensify, the indicator’s reading can decrease further towards the index 50.
HYPE/USDT 4-hour chart analysis
The four-hour price analysis of Hyperliquid also indicates negative sentiment in the market. The HYPE/USD price has decreased to $38.42 over the past few hours as selling pressure returns. The increasing volatility also suggests a high probability of an imminent reversal or further price depreciation.
The Bollinger Bands have slightly diverged as the distance between them has increased, resulting in high volatility levels. This condition typically signifies more market unpredictability. Technically, the upper Bollinger Band has shifted to $41, indicating a resistance level. Conversely, the lower Bollinger Band has moved to $37, indicating a strong zone of support.
The RSI indicator is trending in the neutral region for now. The indicator’s value has decreased to 44 in the last four hours. Overall, selling activity remained high during the last four hours of the day, which has resulted in a decrease in the indicator’s score.
Hyperliquid Technical Indicators: Levels and Action
Daily simple moving average (SMA)
Period
Value ($)
Action
SMA 3
35.63
BUY
SMA 5
36.06
BUY
SMA 10
38.13
BUY
SMA 21
36.65
BUY
SMA 50
33.47
BUY
SMA 100
29.91
BUY
SMA 200
34.22
BUY
Daily exponential moving average (EMA)
Period
Value ($)
Action
EMA 3
36.01
BUY
EMA 5
34.01
BUY
EMA 10
31.26
BUY
EMA 21
29.10
BUY
EMA 50
29.76
BUY
EMA 100
32.98
BUY
EMA 200
34.79
BUY
What to expect from Hyperliquid price analysis?
Hyperliquid price analysis gives a bearish prediction regarding ongoing market events. The coin’s value decreased to $38.41 in the past 24 hours, as it is receiving negative sentiment today. According to an overall analysis, the currency lost 1.44% in its value today. Technical indicators give bullish signals, but the price charts showcase a bearish market scenario at the time of writing.
Why is Hyperliquid down?
The cryptocurrency market is showing negative trends, and HYPE is receiving the same sentiment. Moreover, it is encouraging that HYPE marked a new ATH a few months ago, on September 18, 2025. However, from a broader perspective, the HYPE price decreased to $38.41, losing 1.44% in its total value today.
Is Hyperliquid a Good Investment?
HYPE has growing utility, and its Ethereum compatibility helps it steal a share of DeFi industry. While the technical analysis can change from bullish to bearish, price predictions paint a different picture. However, a risk analysis is recommended.
Will Hyperliquid reach $50?
The current price action does justify predicting a $50 target. In the cryptocurrency market, things change rapidly, but if the token maintains its price levels, a rally can be initiated. It can be expected that HYPE will reach above $50 by any time in 2026 once again, as it did in September and October.
Can Hyperliquid Coin reach $100?
According to Hyperliquid price prediction, HYPE price might surpass $100 in 2028. The highest price HYPE could attain that year is expected to be above $123.38.
Will Hyperliquid reach $500?
According to crypto analysts’ price predictions, Hyperliquid may not reach this level in the next five years. Considering the current market cap of the token, it seems like far target.
Will Hyperliquid reach $1000?
Per the Cryptopolitan’s HYPE price prediction, Hyperliquid is unlikely to reach $1000 before 2032.
How high can Hyperliquid go?
The highest expected price for Hyperliquid is $253.26, which it will achieve in 2032.
Does Hyperliquid have a good long-term future?
Hyperliquid is trading higher than its December 2025 price levels, making it an ideal time for buyers to enter the market. Given its current price and a favorable future valuation of $253.26 by the end of 2032, the asset appears to be a worthwhile investment.
Recent News/Opinions on Hyperliquid
Cryptopolitan reported that Hyperliquid is now offering Brent and WTI futures. The oil trades are available through the HIP-3 framework on the XYZ exchange, as traders bet high on oil as it smashed through $100 for the first time in years. It is important to remember that XYZ:CL, representing WTI oil, entered the top 5 of the most traded futures in the past week.
The Hyper Foundation announced that it will contribute 1 million hype tokens to support the creation of the Hyperliquid Policy Center. The Foundation said the policy center will have a positive impact in favor of clear regulations for decentralized finance.
The Hyper Foundation will contribute 1M HYPE tokens to support the creation of the Hyperliquid Policy Center.
The tokens will be unstaked later today. The Hyperliquid community will benefit from having representation in Washington, D.C., and we are confident that under… https://t.co/Vgo95Nrr17
This month, Hyperliquid is expected to reach a high of $40.48, with an average price of $29.32 and a minimum trading price of $19.78.
Hyperliquid Price Prediction
Minimum price
Average price
Maximum price
Hyperliquid price prediction March 2026
$19.78
$29.32
$40.48
Hyperliquid Price Prediction 2026
The price of HYPE is predicted to reach a minimum value of $14.31 in 2026. Traders can anticipate a maximum value of $58.45 and an average trading price of $48.70 throughout this year.
HYPE Price Prediction
Minimum price
Average price
Maximum price
Hyperliquid price prediction 2026
$14.31
$48.70
$58.45
Hyperliquid Price Predictions 2027 – 2032
Year
Potential Low ($)
Potential Average ($)
Potential High ($)
2027
71.43
81.17
90.91
2028
103.90
113.64
123.38
2029
136.37
146.11
155.85
2030
168.84
178.58
188.32
2031
201.31
211.05
220.79
2032
233.78
243.52
253.26
Hyperliquid (HYPE) price prediction 2027
The year 2027 will experience more bullish momentum. According to the Hyperliquid price prediction, it will range between $71.43 and $90.91, with an average trading price of $81.17.
Hyperliquid crypto price prediction 2028
The Hyperliquid price prediction climbs even higher into 2028. According to the projections, the price of HYPE will range between $103.90 and $123.38, with an average of $113.64.
Hyperliquid coin price prediction 2029
According to our Hyperliquid (HYPE) price prediction for 2029, we expect a maximum price of $155.85, a minimum price of $136.37, and an average price of $146.11.
Hyperliquid price prediction 2030
As per the HYPE price prediction for 2030, it will reach a maximum price of $188.32 and a minimum price of $168.84, with an average price of $178.58.
Hyperliquid price prediction 2031
The Hyperliquid forecast for 2031 suggests a price range of $201.31 to $220.79 and an expected average trading price of $211.05. This long-term prediction also hinges on HYPE’s rising global recognition and adoption.
Hyperliquid prediction 2032
The Hyperliquid price forecast for 2032 is a high of $253.26. According to the HYPE coin price prediction, it will reach a minimum price of $233.78 and average at $243.52.
While the short-term sentiment keeps flickering, we anticipate Hyperliquid will trade higher in the coming years. The coin will achieve a high of $58.45 before the end of 2026. In 2027, it will range between $71.43 and $90.91, with an average of $81.17. However, you should note that HYPE is still quite volatile. Negative market sentiment, such as market crashes, could derail the predictions.
The native token of Hyperliquid, called HYPE, was launched on November 29, 2024, through an airdrop targeted at a limited number of only 94,000 users.
This was one of the most lucrative airdrops, with an average allocation of value of $45,000 to $50,000.
Hyperliquid kept away from venture capitalists, who usually get most of the tokens in usual airdrops; rather, 76% of the supply was slated for user-centric initiatives.
Usually, tokens dump after airdrops until the market momentum picks up, but Hyperliquid’s approach helped garner trust, and the token jumped from $4 to $35 from November 2024 to December 22, 2024.
Hyperliquid’s market cap improved during this period, reaching above $8 billion, showing significant growth, as it received super positive market sentiment.
In late December and early January 2025, the HYPE token corrected down to $20.24, shedding significant value as per crypto market data.
Price stabilized through February as it traded in a range of $19.92 to $27.42 before taking a dive at the end of February, when the broader trend turned bearish again.
HYPE stumbled to $12.34 by mid-March, and it touched a low of $10.21 on April 7, 2025, which significantly decreased the market capitalization.
The token saw nothing but improvement in the remainder of the month of April, and its price surged to $18.57 by the end of the month.
On June 16, 2025, HYPE reached a high price of $45.57. A month later, on July 14, it marked another all-time high of $49.75, and on August 27, it discovered the $50.99 level with changing market dynamics.
On September 18, HYPE achieved its ATH at $59.30, and in October, it corrected to $50. At the start of December, the HYPE token price fell to the $31 range.
At the start of 2026, the HYPE token was trending near $25, and in March, it increased to the $33 range, with the broader crypto market still in bearish mode.
Pharos Secures Strategic Investment from GCL New Energy at Nearly $1 Billion Valuation
Press ReleaseMarch 13, 2026
Pharos Secures Strategic Investment from GCL New Energy at Nearly $1 Billion Valuation
Advancing Web3 Infrastructure and Energy Industry Integration — marking a blueprint for decentralized protocols interfacing with mainstream capital markets.
~$1BValuation
HKEXGCL Listing (0451)
Layer 1Parallel Blockchain
RWAInstitutional Focus
Hong Kong — March 13, 2026
Pharos, the high-performance parallel Layer 1 blockchain designed for institutional-scale financial infrastructure, today announced the strategic expansion of its capital partnership with GCL New Energy (HKEX: 0451). GCL New Energy has finalized its investment in Pharos at a valuation of nearly $1 billion.
The investment positions Pharos to drive the transition of Real-World Asset (RWA) markets from conceptual pilots to massive-scale, sustainable industrial commercialization.
Defining the Standard for Web3-Mainstream Integration
The transaction follows GCL New Energy’s initial announcement on January 8, 2026, and was finalized after completing regulatory disclosure procedures required by the Hong Kong Stock Exchange (HKEX). This process represents a sophisticated alignment of commercial ambition and regulatory rigor.
Unlike typical Web3 funding rounds, the finalization of this supplemental disclosure marks a milestone in institutional transparency. It demonstrates that Pharos has successfully codified its technical value into a framework that meets the standards of public-market regulators and global financial institutions. For the broader Web3 ecosystem, Pharos has established the first blueprint for interfacing decentralized protocols with mainstream capital.
Bridging Blockchain Infrastructure and Energy Markets
GCL New Energy is an industry leader in “Power-Compute Integration” — the synergy of AI computing and energy infrastructure — and has successfully launched pioneering blockchain-based solutions for energy revenue tokenization and cross-border settlement.
Through this partnership, the companies will collaborate on:
Tokenization of renewable energy assets
Decentralized energy trading systems
Carbon footprint tracking and verification
Pharos’ parallel execution architecture is designed to support high-throughput financial infrastructure, enabling more efficient asset settlement, improved transparency, and greater liquidity for real-world assets. Together, the companies aim to establish a framework that connects on-chain financial systems with real-world energy infrastructure, creating new opportunities for digital asset markets backed by tangible economic activity.
Market Validation from Traditional Capital Markets
Unlike many valuations within the Web3 sector, this investment reflects pricing from a publicly listed company with participation from traditional institutional investors. The partnership provides external market validation of Pharos’ infrastructure strategy while demonstrating how blockchain platforms can align with traditional capital markets and regulated industries.
Expanding our partnership with GCL New Energy is an important milestone for Pharos. This collaboration brings together Web3 infrastructure and a global energy leader to explore how blockchain technology can be integrated into real-world industries. The investment reflects confidence in our long-term vision, and we look forward to building the next generation of financial infrastructure together.
— Wish Wu, Co-Founder & CEO, Pharos
About Pharos
Pharos is the inclusive financial Layer 1 for RealFi, where real value and institutional-grade assets circulate onchain and are composable with decentralized assets, becoming the new infrastructure of global finance for all.
Pharos combines modular architecture, deep-parallel execution, and built-in compliance to power real-time finance onchain. Built by leadership and engineers from Ant Group, the project is backed by Hack VC, Faction VC, and other global TradFi investors.
Solana is consolidating near the $85 support level as traders assess whether the recent selling pressure has exhausted itself. Technical analysts view this price zone as critical to determining whether the cryptocurrency can establish a genuine recovery base or if bearish momentum will reassert control.
Solana’s Market Position and Network Context
Solana has emerged as one of the most significant layer-one blockchain platforms, competing directly with Ethereum and other established networks for developer adoption and transaction volume. The protocol’s appeal centers on its high throughput capacity and relatively low transaction costs, which have attracted substantial institutional interest and decentralized finance (DeFi) applications.
The current price consolidation arrives amid a broader reassessment of alternative layer-one blockchains within the cryptocurrency market. As Bitcoin dominance fluctuates and capital rotates between asset classes, Solana’s technical positioning carries implications beyond individual traders—it reflects institutional confidence in non-Ethereum smart contract platforms more broadly.
Over the past eighteen months, Solana has faced significant headwinds including the FTX collapse (which had deep ties to the Solana ecosystem), network stability concerns, and competitive pressure from newer layer-one and layer-two scaling solutions. These challenges have compressed valuations and tested the conviction of long-term network supporters.
Stabilization Signals Emerge
After a period of sustained downward pressure, Solana has begun displaying tentative signs of stabilization. The moderation in selling momentum observed by technical researchers suggests that market conditions may be shifting toward equilibrium, at least in the near term.
The consolidation pattern taking shape on Solana’s charts shows progressively higher lows—a structurally constructive development that typically indicates accumulation activity at support levels. This gradual price floor is characteristic of markets where buyers are willing to step in at discounted valuations, even as the broader trend remains challenged.
The consolidation pattern currently forming on Solana’s chart is characterized by gradually higher lows, a structurally constructive development that suggests accumulation activity near support.
— MakroVision Research, Technical Analysis
However, the bigger picture remains decidedly bearish. Solana continues trading well below a descending red trendline that defines the asset’s primary downtrend. Until price action decisively breaks above this resistance, technical evidence suggests that selling pressure retains the upper hand.
Key Level
The $85 support zone represents the foundation for any near-term recovery attempt. A breakdown below this level would likely accelerate selling and open the door to further downside exposure.
Industry Dynamics and Competitive Landscape
The layer-one blockchain sector has undergone substantial consolidation and maturation since the 2021 bull market. Projects that once competed on theoretical capabilities are now being evaluated on actual adoption metrics, developer activity, and transaction volume. Solana’s network activity remains respectable relative to peers, though not at the levels required to attract maximum capital inflows.
Several competing platforms have made significant progress capturing developer mindshare and transaction volume. Polygon, Arbitrum, and Optimism have each carved out meaningful positions in the scaling ecosystem. Meanwhile, newer entrants like Aptos and Move-based chains have attracted substantial venture funding and developer interest. This competitive environment has pressured Solana valuations and created structural headwinds against sustained rally momentum.
Network fundamentals tell a mixed story. Solana’s validator set remains robust, and development activity on the protocol has continued despite market volatility. However, the narrative around Solana has shifted from “fastest blockchain” to “reliable but not revolutionary,” a perception shift that has genuine consequences for capital allocation decisions.
The $100 Breakout Test
The most critical technical threshold for Solana’s immediate outlook is positioned near $100, where the descending trendline converges with price resistance. A decisive break above this level would mark the first meaningful bullish signal in the current market structure.
For bulls to establish credibility, they must accomplish more than a brief bounce. A sustained reclaim of the $100 area—and the trendline that has capped upside attempts—would constitute a genuine inflection point. Such a move could catalyze renewed accumulation and potentially shift the technical narrative from defensive to constructive.
Conversely, if price rallies toward $100 only to face sharp rejection, the message would be unambiguous: bears maintain control and the downtrend remains intact. Repeated rejections at this trendline would reinforce that lower prices represent the path of least resistance.
Technical Scenario
A clear breakout above $100 with volume confirmation would signal that the bearish structure has been broken. Failure to hold above this level on a second or third attempt would suggest the downtrend remains durable.
What’s Required for Recovery Credibility
Several conditions must align for Solana to transition from consolidation to genuine recovery. First, the $85 support level must hold—a breakdown here would invalidate the constructive consolidation pattern and likely trigger fresh selling.
Sustained price action above $100 with rising volume confirmation
Establishment of higher lows and higher highs across multiple timeframes
Breaking decisively through the descending red trendline with follow-through buying
Rejection of lower prices and building support at progressively higher levels
The current consolidation near $85 should be viewed as a critical test, not a guaranteed recovery. Market structure remains weighted to the downside, and bulls must demonstrate through price action that they possess sufficient conviction to push through meaningful resistance levels.
For context on broader market dynamics affecting crypto prices, factors beyond Solana’s technical picture are also playing a role. Macro conditions, network developments, and flows into alternative protocols all influence investor positioning in mid-tier cryptocurrencies.
Market Implications and Institutional Interest
Solana’s price action carries significance beyond individual token holders. Institutional investors use layer-one blockchain performance as a barometer for sector health and capital rotation patterns. A successful recovery above $100 would likely trigger institutional rebalancing and could signal renewed confidence in non-Ethereum infrastructure investments.
Conversely, a failure to sustain above key resistance would reinforce a narrative of declining competitive positioning relative to established alternatives. This distinction matters for venture capital allocations, exchange listings, and the flow of developer talent toward Solana versus competing ecosystems.
The timing of this consolidation phase is noteworthy given broader cryptocurrency market cycles and regulatory developments. As institutional adoption increases and regulatory frameworks clarify, blockchain networks with established operational track records and substantial developer ecosystems are likely to capture disproportionate capital flows.
Near-Term Implications
The consolidation zone Solana is currently forming represents a compression before expansion. Either bulls will find sufficient buying interest to challenge the $100 trendline, or bears will force price back toward lower support levels that lie further down the chart.
For the bullish scenario to gain credibility, holding the $85 support level remains non-negotiable. A sustained reclaim of the $100 area would represent a genuine inflection point warranting increased optimism.
— Technical Analysis Review
Traders monitoring Solana should focus on volume characteristics during any move toward $100. An advance accompanied by declining volume would suggest weak conviction, while rising volume would indicate genuine accumulation pressure pushing the asset toward overhead resistance.
The next few weeks will likely prove decisive. If bulls can establish foothold above $100, the narrative shifts toward recovery potential. If bears defend this level aggressively, it would reinforce that Solana remains trapped in a downtrend with limited near-term upside.
Conclusion: Pivotal Moment for Layer-One Positioning
Solana’s consolidation near $85 represents more than a technical price pattern—it reflects a crucial inflection point for competitive positioning within the layer-one blockchain sector. The cryptocurrency’s ability to reclaim territory above $100 and establish genuine recovery momentum will likely determine whether it can maintain relevance as a primary development platform or faces gradual displacement by competitors offering superior scalability or network effects.
For broader context on cryptocurrency market developments, Solana’s price action is being watched closely as a barometer for how alternative layer-one blockchains are positioning relative to Bitcoin dominance. The technical framework developing at these levels could have implications beyond Solana itself, potentially signaling capital rotation patterns affecting the entire alternative-layer-one sector.
Until evidence emerges that the bearish structure has fundamentally broken, investors should approach rallies toward $100 with measured expectations. The consolidation pattern near $85 may represent opportunity for some, but it has not yet proven itself as a launching pad for sustained recovery. Market participants should demand clear evidence of conviction through volume and sustained price action before establishing significant bullish positions based on this technical setup.
Get weekly blockchain insights via the CCS Insider newsletter.
The Sui network’s native token, SUI, is positioning itself at a technical juncture where institutional accumulation typically accelerates, with price action near $1.28 suggesting that meaningful moves could materialize once the token clears the $2.00 resistance level. Market structure analysis indicates SUI is in a compression phase—a period of low volatility that historically precedes significant directional expansion in cryptocurrency markets.
Understanding Sui’s Market Position
Sui represents a significant entry in the competitive layer-1 blockchain ecosystem, designed to address scalability and user experience challenges that have constrained broader cryptocurrency adoption. Launched by Mysten Labs, the network employs a horizontal scalability model that distinguishes it from competitors like Solana and Avalanche. Understanding SUI’s technical fundamentals provides crucial context for evaluating its price action beyond pure technical analysis.
The layer-1 blockchain market has matured considerably since 2022, with institutional investors now differentiating between projects based on genuine technological advantages rather than pure speculation. Sui’s focus on object-centric programming and parallel processing capabilities has attracted developer interest, which historically correlates with long-term token performance. This fundamental strength provides additional conviction to bullish technical signals currently forming in SUI’s price structure.
Smart Money Accumulation Signals
Technical analysts tracking institutional behavior have identified SUI at a stage where large market participants typically begin building positions. The weekly chart reveals an intact long-term ascending channel, with price currently hovering near support trendlines that have attracted sustained demand.
The market structure shows a bullish order block positioned between $0.80 and $1.15, signaling where institutional buying interest has historically been concentrated. This formation suggests the foundation for upside movement remains intact if resistance levels are breached with conviction.
This is how big trends are built, slowly, then suddenly. Liquidity is cleared, demand is active, and patience gets rewarded.
— Crypto Patel, Technical Analyst
The distinction between institutional and retail participation matters significantly here. Smart money typically accumulates during periods of low volatility and indecision, while retail traders often enter after visual confirmation of upward movement. This creates a natural advantage for those patient enough to recognize compression phases. Institutional activity in SUI has notably increased following major network upgrades and partnerships with enterprise platforms, suggesting that large players are positioning for growth periods aligned with fundamental catalysts.
Key Price Levels
SUI is currently trading around $1.28 with near-term support near $1.50 and initial resistance at $2.00. A sustained break above $2.00 could signal the beginning of a new trend phase with projected targets at $5, $10, and $20 based on technical measurements.
Current Consolidation Range
The token is consolidating within a tightening range that reflects balanced market indecision between buyers and sellers. Support holds near $1.50, while the $2.00 level represents the first significant resistance that would need to be overcome for confirmation of bullish continuation.
This consolidation pattern is textbook market behavior before breakouts. The compression suggests that momentum is being built beneath the surface, even as price action appears static on shorter timeframes. Volume analysis will be critical in determining which direction the eventual break occurs.
For context on broader market movements affecting layer-1 solutions like Sui, readers may want to review Ethereum’s performance and how competition among smart contract platforms influences investor allocation decisions. The competitive dynamics in this space have intensified as institutional capital flows toward platforms demonstrating tangible technological advantages and real-world adoption metrics.
Market Implications and Industry Context
SUI’s technical setup occurs within a broader industry shift toward infrastructure evaluation rather than hype-driven speculation. The cryptocurrency market has increasingly demanded proof of network utility, developer ecosystem health, and actual transaction volume. Sui has demonstrated measurable progress across these metrics, with transaction throughput and developer activity rising consistently throughout 2024.
Market analysts have noted that institutional investors now scrutinize blockchain metrics such as unique active addresses, developer commits, and transaction settlement finality when making allocation decisions. Sui’s improvements in these areas provide fundamental support for technical price patterns. This represents a maturation of crypto markets toward fundamentals-based valuation—a shift that could substantially benefit well-positioned projects during bull market phases.
The broader cryptocurrency market environment also influences SUI’s trajectory. Bitcoin’s dominance, overall market capitalization trends, and regulatory developments in key jurisdictions all create the macroeconomic backdrop within which Sui operates. Currently, risk-on sentiment in traditional finance coupled with increasing institutional cryptocurrency allocations suggests a favorable environment for high-conviction altcoin positions with strong technical setups.
Technical Scenarios
Bullish Breakout Potential
If SUI sustains trading above $2.00 on expanding volume, technical projections suggest a multi-stage rally could unfold. The first target would be $2.50, followed by progressively higher levels if momentum continues.
A clean breakout above $2.00 would confirm trend continuation and suggest that institutional accumulation during the consolidation phase has positioned the market for expansion. This scenario would be most likely if volume expands noticeably at the resistance level, indicating genuine buying pressure rather than mere price touches.
Sustained volume expansion above $2.00 could drive the next leg of the trend toward $2.50 and beyond.
— Market Structure Analysis
In this scenario, longer-term investors would benefit from waiting for this decisive breakout rather than attempting to trade the consolidation range, as it would provide clearer evidence of directional commitment from institutional players. Historical precedent from similar bottoming patterns in other layer-1 tokens suggests that breakouts from these compression phases can accelerate rapidly as short-sellers capitulate and momentum traders add to winning positions.
Downside Risks and Support Levels
The bearish scenario requires monitoring support levels with equal attention. If SUI fails to hold above $1.50, a further decline toward $1.20 becomes plausible, potentially triggering accelerated selling pressure.
Such a breakdown would indicate that institutional demand was weaker than the technical setup suggested, or that external market factors overwhelmed the positive structure. Volume would be the confirming factor—high-volume breaks of support are more likely to lead to sustained declines than low-volume touches.
Support at $1.50 must hold to maintain near-term bullish structure
Support at $1.20 represents the secondary level before broader range extension
Resistance at $2.00 is the critical hurdle for trend confirmation
Volume expansion is essential for confirming any directional break
Current momentum indicators reside in neutral territory, reflecting genuine indecision in the market. This neutrality is actually a prerequisite for significant moves—when momentum is extremely overbought or oversold, reversals occur. Neutral momentum means the market hasn’t yet decided direction, making it primed for movement once the consolidation breaks.
Trading Strategy Considerations
For active traders operating within the consolidation range, key price levels offer natural entry and exit points. Using support at $1.50 and resistance at $2.00 as range boundaries helps manage risk and define profit targets based on technical structure.
However, range trading carries the risk of being caught in a false move that suddenly breaks the range and accelerates beyond initial targets. This is why monitoring live price action and volume data is essential for traders managing positions in SUI during this compression phase.
Position sizing becomes especially important in situations like this, where a decisive move in either direction could generate substantial percentage moves quickly. Traders should size positions accordingly so that a breakout doesn’t force them out of positions they intended to hold longer-term.
Risk Management Note
The consolidation phase presents both opportunity and risk. While breakouts can be explosive, false breaks that briefly pierce resistance before reversing are common. Always define stop-loss levels before entering any position, and adjust them as the trade develops in your favor.
For longer-term investors focused on directional conviction rather than short-term trading, waiting for a decisive breakout from this consolidation is the prudent approach. A clear break above $2.00 with volume confirmation would provide stronger evidence of trend direction and reduce the risk of entering during a false move that could reverse quickly.
The Sui network’s technical recovery and the broader market context for layer-1 blockchain developments also warrant monitoring, as network fundamentals can reinforce or contradict technical signals.
Looking Forward: What Catalysts Matter
SUI’s trajectory over the coming months will likely be influenced by both technical factors and fundamental catalysts. Network upgrade announcements, major partnership developments, and improvements in developer ecosystem metrics could provide the additional conviction needed to sustain a breakout above $2.00. Conversely, regulatory concerns, competitive pressures from other layer-1 solutions, or broader cryptocurrency market weakness could invalidate the current bullish technical setup.
The cryptocurrency market’s maturation means that tokens increasingly move in tandem with technological progress and real-world adoption metrics rather than purely on speculation. SUI’s positioning as a scalable, developer-friendly blockchain makes it well-suited for the next phase of crypto market evolution, provided technical price patterns align with fundamental progress.
SUI’s current positioning represents the kind of market setup that separates patient market participants from those seeking quick profits. The compression phase signals that material moves are likely, but timing remains uncertain. Those who recognize this setup and position accordingly stand to benefit when institutional demand finally becomes visible on the charts.
Get weekly blockchain insights via the CCS Insider newsletter.
XION’s Walletless Blockchain Now Available to 2,400+ Institutions Through Fireblocks Integration
The integration accelerates institutional adoption of XION and unlocks new avenues for stablecoin expansion, corporate engagement, and institutional participation in its ecosystem.
New York, NY, October 7, 2025
XION, the first consumer-centric Layer-1 blockchain designed for mainstream adoption, today announced a strategic integration with Fireblocks, the industry-leading digital asset infrastructure provider trusted by 2,400 institutions to secure over $10 trillion in digital asset transactions.
The integration brings XION’s ecosystem into Fireblocks’ secure custody and settlement platform, enabling enterprises, financial institutions, and global brands to access blockchain-based services with the compliance and security standards they already trust.
Unlike most blockchains that remain narrowly focused on DeFi, XION is building for global, everyday use. Through Fireblocks, institutions can now seamlessly launch programs across payments, loyalty, gaming, and tokenization, eliminating the barriers of wallets, seed phrases, and unpredictable gas fees.
For institutions, this integration addresses some of the biggest hurdles to blockchain adoption. Other chains often force enterprises to build their own wallet infrastructure, manage seed phrases, and contend with volatile gas costs. Fireblocks already provides custody, settlement, and compliance at scale, while XION introduces a consumer-first environment where onboarding looks like a standard app.
The combination removes key adoption barriers, allowing Fortune 500 companies and large enterprises to scale blockchain programs without introducing new security or regulatory risks, while still obtaining verifiable on-chain proofs of every action.
“Supporting XION reflects our commitment to enabling secure institutional participation in next-generation blockchain ecosystems. By integrating with XION’s user-friendly infrastructure, we’re helping institutions access a network designed for real-world adoption.”
— Ezra Solomon, Strategy Lead, Blockchain and Staking at Fireblocks
“Integrating with Fireblocks is a key development milestone for XION. It brings the scale and credibility of one of the most trusted institutional providers into alignment with our mission to take blockchain to the mass market.”
— Anthony Anzalone, XION Founder
About XION
XION is the consumer-first Layer-1 blockchain that makes crypto invisible yet indispensable. With walletless onboarding, gasless transactions, and easy account creation, XION removes barriers between users and blockchain technology. From gaming to global brands, XION enables mass adoption by proving what is real, secure, and human.
Peace Through Trade Blockchain Announced as Premier Sponsor of Futurist Miami 2025
Peace Through Trade Blockchain
Empowering Global Commerce Through Sustainable Innovation
Miami, Florida — September 16, 2025
The Peace Through Trade Blockchain (PTT), a sustainable, geopolitically neutral Layer-1 Proof-of-Work blockchain designed with a regulation-first approach under Singapore compliance, and one of the world’s first fully AI-integrated blockchains, is proud to announce its role as the Premier Sponsor of the upcoming Blockchain Futurist Conference Miami 2025, taking place on November 5–6, 2025 in Miami, Florida.
For more than 4.5 years, the Peace Through Trade team has worked to develop a blockchain ecosystem that is both scalable globally and positive for the planet. By aligning with global regulatory standards and building sustainability into its core infrastructure, PTT represents a new generation of blockchain — one that empowers commerce while furthering peace through trade.
Showcasing the PTT Wallet
At Futurist Miami 2025, the Peace Through Trade Blockchain will unveil its next-generation mobile wallet, designed to give users real-world financial utility.
Key features include:
Native support for PTT Coin
Built-in swap functionality that enables users to seamlessly exchange PTT Coin for:
U.S. Dollar stablecoin
Singapore Dollar stablecoin
Gold-backed stablecoin
Silver-backed stablecoin
Integration into the broader Peace Through Trade ecosystem for transparent, secure, and insured commerce
“Peace Through Trade Blockchain is also one of the very few Layer-1 projects worldwide — alongside names like Ethereum, Solana, and BNB Chain — to have developed and released a mobile wallet directly tied to its Layer-1 infrastructure, underscoring the uniqueness and strategic value of this achievement.”
This wallet represents a practical bridge between digital and traditional assets, reinforcing PTT’s mission of building trust, sustainability, and accessibility in the global blockchain economy.
A Vision for Global Impact
PTT: The Bitcoin for Small & Medium Business
Peace Through Trade is already engaged in meaningful discussions worldwide with community leaders, small and medium sized business owners, and global manufacturers, positioning itself as a trusted partner for building a secure, transparent, and insured Web3 ecosystem.
Beyond payments, PTT is laying the foundation for:
Future Layer-2 solutions, including a global social media network and a global marketplace built on the PTT blockchain
Geopolitically neutral platforms, offering permanent digital commons for trade, dialogue, and collaboration
A long-term mission to become the “Bitcoin for Small Business,” delivering faster, safer, and more affordable cross-border payments for SMEs, institutions, and consumers worldwide
The Futurist Miami Blockchain Conference — recognized as one of the industry’s leading gatherings — will serve as the stage for Peace Through Trade Blockchain to share its vision and showcase the transformative power of its platform on November 5–6, 2025.
About Peace Through Trade Blockchain (PTT)
The Peace Through Trade Blockchain (PTT) is a sustainable, geopolitically neutral Layer-1 Proof-of-Work blockchain, developed in accordance with Singapore’s legal and regulatory frameworks. Built for global scalability, PTT combines energy efficiency, transparency, regulatory compliance, and full AI integration with a mission of empowering humanity through equitable access to secure commerce — advancing World Peace Through Trade.
Lightchain AI is quietly drawing attention on influencer podcasts and discussions while Cardano’s roadmap delays cause more questions among the crypto community. The intelligent design and consistent advancement of the project have made it a hot issue among intellectuals looking for the next significant blockchain invention.
Lightchain AI is gaining traction not through hype but rather by real interest in its scalable and utility-driven approach. Its presale raised $20.9 million and tokens are priced consistently at $0.007.
Cardano is under doubt about timelines, but Lightchain AI is gathering support among builders and investors ready for a more quick and intelligent blockchain solution.
Cardano Faces Scrutiny Over Persistent Roadmap Delays
In 2025, Cardano is being watched ever more closely as its roadmap continues to face delays after it previously promised decentralization and scalability. Founder Charles Hoskinson has revealed the end of the original roadmap, which culminated with events such as the Plomin hard fork and the on-chain ratification of the Cardano Constitution, while crucial projects such as Hydra and Leios continue without a commitment to further funding, working “under at risk conditions”. These delays have caused concerns in the community, mainly about the staking function and other functionalities that have been promised.
With the creation of the Constitutional Committee and later DRep election, the present transfer of governance is seen as a chance to solve these problems by acting as mo re transparent and more involved community servant. Still to be seen, though, whether such policies will prove successful in boosting confidence rebuilding and development.
Key Influencer Endorsements Give Lightchain AI Visibility
As important players start supporting the project for its practical use and technical innovation, lightchain artificial intelligence is becoming more and more visible in the crypto scene. Lightchain AI’s AI-integrated Layer 1 design, dynamic pricing model, and optimized gas structure are attracting respected voices unlike fleeting hype tokens.
These sponsorships are helping to hasten demand at a pivotal point as the Bonus Round is under progress at a set $0.007 price. Influencers are stressing Lightchain AI’s distributed validator and contributor nodes, forthcoming public repository launch, and $150,000 grant program meant to support AIVM-powered development.
Lightchain AI keeps growing outside of early adopters as more credible leaders offer their optimistic view gains traction among larger investor audiences who give utility and transparency top priority.
From Podcasts to Portfolio: Lightchain AI Is Changing the Crypto Scene
From buzzing podcasts to investor portfolios, Lightchain AI is generating waves in the crypto space and inspiring enthusiasm everywhere. Its dynamic gas optimization, lightning-fast execution, and modern AI-integrated blockchain architecture help to explain de velopers and investors fl ocking to it.
The Transparent AI Framework guarantees completely verifiable and auditable AI computations, so adding still another layer of trust. Lightchain AI is firmly establishing itself as a game-changer in distributed technology as the countdown to the mainnet launch gets under way. Blockchain’s future just became smarter—and it is happening right now!