Bitcoin has started showing early signs of weakness after its recent recovery rally toward the $80K resistance region. The market is now confronting a technically important supply zone where sellers have become increasingly active, raising the probability of a broader corrective phase in the short term.
Bitcoin Price Analysis: The Daily Chart
On the daily chart, BTC has recently shown several bearish signs as the price struggles to maintain bullish momentum around the crucial $80K resistance level. This area coincides with a strong confluence of supply, including the upper boundary of the broader ascending channel and the 200-day moving average near the $82K mark. The repeated inability to reclaim this region highlights the presence of aggressive sellers and growing distribution pressure in the market.
As a result, the probability of an expanded bearish retracement has increased notably. If sellers maintain control, Bitcoin could gradually decline toward lower support zones, with the $75K region acting as the first key demand area. A deeper correction could then expose the broader support zone around $70K-$71K, which previously acted as a significant accumulation range for buyers.
BTC/USDT 4-Hour Chart
On the 4-hour timeframe, the market has recently broken below a key ascending trendline that had supported the latest bullish structure since the rebound from the $60K region. This bearish breakdown serves as an early warning sign that momentum is fading and sellers are gradually gaining dominance over the market.
Additionally, many participants who accumulated BTC during the recent capitulation toward the $60K support zone now appear to be securing profits and reducing exposure near resistance. This behavior has increased selling pressure around the $80K region and further supports the possibility of another corrective leg in the coming days. If bearish momentum accelerates, the price could continue its decline toward the highlighted demand zones at $76K and eventually the $71K region.
Onchain Analysis
From a liquidation perspective, the Binance BTC/USDT heatmap reveals a substantial concentration of liquidity resting beneath the current market price, particularly around the $77K region. Historically, the market tends to gravitate toward these high-liquidity zones, as they fuel larger directional moves through forced liquidations.
This growing liquidity cluster below the market further aligns with the current bearish technical structure observed across both higher and lower timeframes. As long as Bitcoin remains below the critical resistance confluence around $80K-$82K, the probability of a liquidity-driven decline toward the lower clusters remains elevated.
Physicist Giovanni Santostasi says Bitcoin’s long-term price trajectory is not best understood as an S-curve, speculative bubble, or simple exponential trend, but as a power law similar to patterns found in cities, biology and other natural systems. Speaking with Nathalie Brunell on the May 12 episode of the Coin Stories podcast, the director of the Scientific Bitcoin Institute argued that Bitcoin’s historical data points to roughly $1 million per coin in about eight years and $10 million in roughly 20 years.
Santostasi explained his Bitcoin Power Law thesis in detail. His core claim is that Bitcoin’s price has followed a nonlinear mathematical relationship with time since the network’s early trading history. In his formulation, Bitcoin’s price is proportional to time raised to a power of roughly 5.8 to 5.9, often rounded to six. That exponent, he said, is not just a curve-fitting artifact but a “fingerprint” of the system.
“With bitcoin we found a similar relationship where the price is proportional to the time,” Santostasi said. “So the age of bitcoin, how many years, you can measure it in days, you can measure it in years. And then you take the power and that power is 5.8.”
Bitcoin Is Growing Like A City
He acknowledged that Bitcoin remains volatile in the short term, with wars, crises and liquidity shocks producing large deviations. But he argued those moves are oscillations around a deeper trajectory.
According to Santostasi, Bitcoin’s power law currently implies a central price level around $120,000, while the market has recently traded below that level. He said the lower statistical band, which he described as a kind of floor, is currently near $56,000 to $57,000. He also cited a correlation coefficient of 0.97 for the power law fit, arguing that only around 3% of Bitcoin’s long-term price variation is not described by the model.
A key part of Santostasi’s thesis is that Bitcoin behaves more like a networked organism than a corporate asset. He compared Bitcoin to cities, which he said grow through bottom-up interaction and tend to endure far longer than corporations. Cities, in his telling, follow power laws because their value emerges from networks of people freely interacting, building and exchanging information.
“Bitcoin is like a city,” Santostasi said. “Bitcoin is like tooth and nails and thorns and shells, these natural forms. To me, if you can simplify this message — and because it’s not poetry, it’s science actually, it’s based on data — it is one of the most convincing orange-pilling arguments that you can make.”
The physicist contrasted that with exponential growth, which he associated with systems that expand quickly but eventually hit resource limits. He cited corporations as an example, saying most die within 150 years, while cities such as Rome can persist for millennia. That distinction led to one of the more provocative implications of the discussion: corporations backed by Bitcoin, Santostasi suggested, could theoretically become more city-like in their durability.
“This is one of the reasons why I want Saylor to start adopting this language of a power law,” he said, referring to Strategy executive chairman Michael Saylor. “He could say exactly that. We are turning corporations into cities.”
Santostasi also argued that Bitcoin’s address growth supports the thesis. He said Bitcoin addresses have grown as a power law with time cubed, while price reacts to address growth roughly according to a square relationship, similar to Metcalfe’s Law. Combining those two relationships, he said, produces the observed price relationship of time to the sixth power.
“If you double the number of addresses, the price goes up to four,” Santostasi said. “If you triple it, it goes to nine. So it’s a power law with the square.”
That framework also leads Santostasi to reject the common view that Bitcoin adoption should be modeled primarily as an S-curve, like refrigerators, televisions or other consumer technologies. Those products, he argued, are not networks in the same way Bitcoin is. Bitcoin’s social, monetary and technical layers make it closer to the internet or a city than to a household appliance.
Still, Santostasi stopped short of presenting the forecast as certainty. Asked how confident he is that Bitcoin will reach roughly $1 million per coin in about eight years and $10 million in roughly 20 years, he put the probability near 90%, while leaving room for failure conditions. He said continued capital inflows, larger institutional participation and new pools of capital are necessary for the path to remain intact.
Over the past week, Cardano’s ADA has surged 6%, making it one of the best-performing top-15 cryptocurrencies.
Numerous analysts have recently spotted that the asset has been following a similar pattern witnessed during previous bull cycles, suggesting this could be just the beginning of a major rally.
‘Printing by the Plan’
Earlier this month, ADA came close to reclaiming the $0.30 mark, reaching its highest level since mid-March. It currently trades around $0.27, while its market capitalization remains above $10 billion.
The asset is often among the most talked-about cryptocurrencies and becomes the subject of price predictions. One popular analyst who recently touched upon the matter is JAVON MARKS. The X user claimed that ADA continues to maintain a similar structure to that observed in 2021 and shows “signs of strength.” They set a target of $2.91, meaning that the price could be gearing up for a whopping 10x pump.
Prior to that, Sssebi opined that ADA had been consolidating over the past few months, as it did towards the end of 2024, which was later followed by a price increase above $1.30. That said, the analyst believes a surge above $1 is still in play this year.
For their part, Vuori Trading argued that ADA is still “printing by the plan” and sits in a “strong buy level.” The analyst envisioned a staggering jump to as high as $14, occurring sometime between Q3 2027 and Q1 2028.
Ali Martinez has also given his two cents lately. He emphasized the importance of the $0.25 support zone, noting that it has repeatedly acted as a major inflection point for the token.
For instance, in January 2023, ADA bounced off $0.25, resulting in an 88.27% jump over the following weeks. In September that year, this level again served as firm support, sparking a 243% surge.
More Bullish Signals
ADA’s Relative Strength Index (RSI) also supports the bullish case for further price increases. The ratio of the technical analysis tool has plunged to 22, indicating the asset has entered oversold territory and could be gearing up for a move north.
ADA RSI, Source: RSI Hunter
The RSI measures the speed and magnitude of recent price changes and provides traders with vital information about potential price reversal points. It runs from 0 to 100, and conversely, anything above 70 is interpreted as a warning for an impending pullback.
Dogecoin is facing a confusing technical setup as technical analysis warns of a major higher-timeframe move that could first send DOGE into a deeper accumulation zone. The chart appears bearish at first glance, but the inverted price scale changes the reading, turning the projected drop into a longer-term bullish setup that points to $1, $2, and eventually $5.
Dogecoin Is Approaching Its Smart Money Zone
Technical analysis done by a crypto analyst known as Crypto Patel is built around the idea that Dogecoin may still need to push lower before its larger upside cycle begins. Crypto Patel’s 3-week DOGE/USD chart on TradingView covers over a decade, from 2014 to a projected 2028, and it shows repetitive price action. The key detail, however, is that the chart is inverted for emphasis, meaning the bearish-looking projection actually points to a bullish long-term move.
The chart shows Dogecoin inside a descending channel that has guided the price for years. The first major phase began with a rejection at the upper trendline before the 2017 cycle, followed by a large move that eventually gave way to another long correction. A second major base formed around early 2021, which later led to Dogecoin’s explosive run during the last meme coin mania.
Crypto Patel appears to be comparing the current structure to those earlier phases. The third setup on the chart is developing right now, where Dogecoin looks like it is rejecting at the upper trendline of the descending channel.
What’s Next For Dogecoin?
The marked rejection zone around the current area shows that the Dogecoin price could still revisit as low as $0.07 in the accumulation range for a bottom before a strong higher-timeframe reversal. According to Crypto Patel, retail traders will sell the bottom, but smart money traders are already setting alerts.
Interestingly, on-chain data support this notion of smart money movements and whales that are accumulating Dogecoin. Recent on-chain data in early May shows that Dogecoin whales recently recorded their busiest day in six months, and most of this activity is accumulation moves.
If Dogecoin breaks below the current range without strong spot demand, the move could still drag the price deeper into Crypto Patel’s $0.10 to $0.07 accumulation band. However, the projection shows the Dogecoin price reversing around the accumulation band and embarking on a rally, with the analyst pointing at $1, $2, and $5 targets.
Crypto Patel’s $1, $2, and $5 targets are very bullish, especially because Dogecoin is down by 85% from its 2021 all-time high of $0.7316.
At the time of writing, Dogecoin is trading at $0.109. The first major checkpoint would be confirming daily and weekly closes above $0.10, reclaiming higher resistance levels around $0.15 to $0.20, and confirming that the current structure has moved out of a long corrective phase.
Our ENA price prediction expects a maximum of $0.82 in 2026.
In 2032, we expect the ENA price to achieve $7.38.
Ethena is a stablecoin project built on Ethereum that offers USDe, a fully decentralized coin pegged to the US dollar.
Unlike stablecoins such as USDC or USDT, USDe doesn’t depend on banks or centralized companies for reserves. Instead, it uses a cash-and-carry trading strategy to keep its value equal to the dollar.
For investors who prioritize decentralization, USDe could be an appealing choice — especially since it currently offers staking rewards above 9%. However, critics caution that since the project is still new, it’s uncertain whether USDe’s high yields and dollar peg can remain stable during a market downturn.
Based on these developments, we’ve compiled our Ethena price prediction from 2026-2032. In this article, we’ll find out “Will ENA reach $10?” and explore the factors behind ENA price prediction.
Overview
Cryptocurrency
Ethena
Ticker
ENA
Price
$0.13 (-2.3%)
Market cap
$917 million
Trading volume (24-hour)
$50 million
Circulating supply
8.49B ENA
All-time high
$1.52 (11 April, 2024)
All-time low
$0.09428 (24 February, 2026)
ENA technical analysis
Metric
Value
Current Price
$0.13
Price Prediction
$ 0.07926 (-25.13%)
Fear & Greed Index
40 (Fear)
Sentiment
Bearish
Volatility
11.29% (Very High)
Green Days
13/30 (43%)
50-Day SMA
$ 0.09998
200-Day SMA
$ 0.1973
14-Day RSI
45.85 (Neutral)
ENA price analysis
Resistance for ENA is at $0.1389
Support for ENA/USD is at $0.1267
The ENA price analysis for 11 May confirms that ENA witnessed bearish pressure as it dropped toward $0.13. However, the ENA price is preparing for a recovery rally.
Ethena price analysis 1-day chart: ENA price triggers bearish momentum
Analyzing the daily price chart of ENA tokens, ENA witnessed a bearish correction after sellers pushed the price toward support lines. Sellers are now aiming for a hold below the immediate Fib channels around $0.13. The 24-hour volume surged toward $24 million, showing an increase in trading interest today. Ethena’s price is currently trading at $0.13, which has dropped by over 2.3% in the last 24 hours.
The RSI-14 trend line has dropped from its previous level but hovers within the neutral region at 67, showing that bulls are controlling momentum. The SMA-14 level suggests volatility in the next few hours.
ENA/USDT 4-hour price chart: Buyers aim big above EMA levels
The 4-hour ENA price chart suggests that ENA experienced a bullish activity around EMA lines, creating a positive sentiment on the price chart. Currently, buyers aim for a strong rebound above the EMA20 trend line.
The BoP indicator trades in a bearish region at 0.39, suggesting that sellers are trying to build pressure near support levels and trigger downward correction.
Additionally, the MACD trend line has formed red candles below the signal line, and the indicator aims for negative momentum, strengthening selling positions.
ENA price predictions: Levels and action
Daily simple moving average (SMA)
Period
Value
Action
SMA 3
$ 0.1018
BUY
SMA 5
$ 0.1024
BUY
SMA 10
$ 0.1051
SELL
SMA 21
$ 0.1076
SELL
SMA 50
$ 0.09998
BUY
SMA 100
$ 0.1108
SELL
SMA 200
$ 0.1973
SELL
Daily exponential moving average (EMA)
Period
Value
Action
EMA 3
$ 0.1017
BUY
EMA 5
$ 0.1026
BUY
EMA 10
$ 0.1043
SELL
EMA 21
$ 0.1042
SELL
EMA 50
$ 0.1057
SELL
EMA 100
$ 0.1304
SELL
EMA 200
$ 0.1917
SELL
What to expect from ENA price analysis next?
The hourly price chart confirms bears are making efforts to prevent the ENA price from an immediate surge. However, if the ENA price successfully breaks above $0.1389, it may surge higher and touch the resistance at $0.1484.
If bulls fail to initiate a surge, ENA price may drop below the immediate support line at $0.1267, resulting in a correction to $0.1155.
Is ENA a good investment?
Whether ENA is a good investment depends on your goals and how much risk you’re comfortable with. Ethena has been ranked among the 100 cryptocurrencies. Still, there are questions about its demand, given its similarity to algorithmic stablecoins — a concept that lost trust after LUNA’s collapse in 2022. Even so, Ethena has shown strong performance during market surges, making it a solid project in the crypto market.
If you believe in the project’s future and don’t mind the ups and downs, it might be worth putting in a small amount.
Why is the ENA price down today?
ENA’s price gained selling pressure around recent highs, resulting in a strong downward push. This created a push toward $0.13.
Will Ethena price recover?
If buyers hold above the $0.15 level, we might see a comeback in buying demand.
Will ENA reach $10?
ENA price might reach the $10 mark in 2035 if buying demand surges and ENA attracts altcoin investors.
Will ENA reach $100?
The $100 mark is a distant dream for ENA. This price level is achievable in the long run if ENA continues to expand its offerings and attract buying demand.
Is Ethena a good long-term investment?
ENA has gained popularity due to strong community support. However, conducting thorough research into their long-term potential is crucial to determine if they represent a viable long-term investment.
Recent news/ Opinion on ENA
BlackRock sent a letter to regulators, defending a proposed rule that would limit tokenized reserve assets to 20%. It said this cap could impact its BUIDL fund, which supports Ethena’s USDe and Jupiter’s JupUSD.
Ethena (ENA) price prediction May 2026
Over the last few days, ENA prices have aimed to surge above crucial Fib levels. If the BTC price aims for a hold above $80K in May, we might see a solid surge in the ENA price.
According to technical analysis, the ENA price might record a maximum level of $0.17 and a minimum of $0.075, with an average value of $0.13 throughout May.
ENA price prediction
Potential low
Potential average
Potential high
ENA Price Prediction May 2026
$0.075
$0.9
$0.12
Ethena Forecast 2026
By the end of 2026, ENA price is expected to attain an average level of $0.64. The Ethena price prediction 2026 expects a minimum price of $0.06 and a maximum price of $0.82.
ENA price prediction
Potential low
Potential average
Potential high
ENA Price Prediction 2026
0.06
0.64
0.82
Ethena Price Predictions 2027-2032
Year
Minimum Price ($)
Average Price ($)
Maximum Price ($)
2027
0.9001
0.9258
1.1
2028
1.3
1.35
1.55
2029
1.98
2.03
2.31
2030
2.85
2.95
3.46
2031
4.26
4.37
5
2032
6.24
6.42
7.38
Ethena Price Prediction 2027
Ethena’s price forecast expects a minimum value of $0.9001 in 2027. The maximum value could be around $1.10, with an average trading price of approximately $0.9258.
Ethena Price Prediction 2028
Ethena’s price in 2028 is expected to reach a minimum level of $1.30 and a maximum level of $1.55, with an average forecast price of about $1.35.
Ethena Price Prediction 2029
The price of Ethena in 2029 is predicted to reach a minimum value of $1.98. It could rise to a maximum of $2.31, with the average trading price estimated at $2.03.
Ethena Price Prediction 2030
According to forecasts and technical analysis, Ethena is expected to reach a minimum price of $2.85 in 2030. The token could achieve a maximum level of $3.46, while the average trading price is projected to be around $2.95.
Ethena Price Prediction 2031
Based on in-depth technical analysis of past data, the price of Ethena in 2031 is expected to reach a minimum of $4.26. The maximum price could be $5.00, with an average value of about $4.37.
Ethena Price Prediction 2032
In 2032, Ethena’s price is forecasted to reach a minimum level of $6.24, a maximum level of $7.38, and an average trading price of approximately $6.42.
Ethena Price Prediction 2026-2032
Ethena market price prediction: Analysts’ ENA price forecast
Firm Name
2026
2027
Coincodex
$0.6829
$0.5555
CoinDCX
$0.8
$1
Cryptopolitan’s Ethena price prediction
At Cryptopolitan, we are bullish on the ENA price movements as the coin is expected to surge to new highs by the end of this year. By the end of 2026, ENA price is expected to attain an average level of $0.64. The Ethena price prediction 2026 expects a minimum price of $0.06 and a maximum price of $0.82.
ENA historical price sentiment
ENA Price History: Coinmarketcap
Ethena’s price history from mid-2024 to late 2025 shows a period of intense volatility marked by sharp fluctuations in both price and market capitalization. In early 2024, Ethena traded strongly, reaching highs around $1.20 in April, supported by high trading volumes exceeding $8 billion.
However, by mid-2024, the token began to decline steadily, closing near $0.38 by July as investor sentiment weakened and market activity cooled.
The latter half of 2024 saw further instability. Ethena’s price dropped as low as $0.20 in September, reflecting a major correction phase in the broader crypto market.
Despite these setbacks, the token demonstrated resilience, climbing back above $1.00 by December 2024. This late-year rally suggested renewed interest from traders and potential ecosystem developments.
In 2025, Ethena continued to experience wide swings. The token opened the year near $1.25 but faced sustained downward pressure through the spring, dipping below $0.30 by June.
A strong recovery followed in the third quarter, with prices surpassing $0.70 in August and stabilizing near $0.50 by October. Throughout this period, Ethena’s market cap ranged from $1 billion to over $5 billion.
In early November, the price of ENA declined toward $0.3. By the end of November, ENA declined below $0.23.
ENA ended December on a bearish note by trading around $0.2. By January 2026, the price of ENA dropped toward $0.13.
In February, the price of ENA dropped toward $0.1. ENA price declined further in March and touched a low around $0.08 in early April.
That puts a 1,150% increase as a 2031 target inside a market that is still trying to prove it can hold the $80,000 area.
CryptoSlate’sBitcoin page shows BTC near $80,200 on May 9, with a market capitalization near $1.61 trillion and an all-time high of $126,198 set on Oct. 6, 2025.
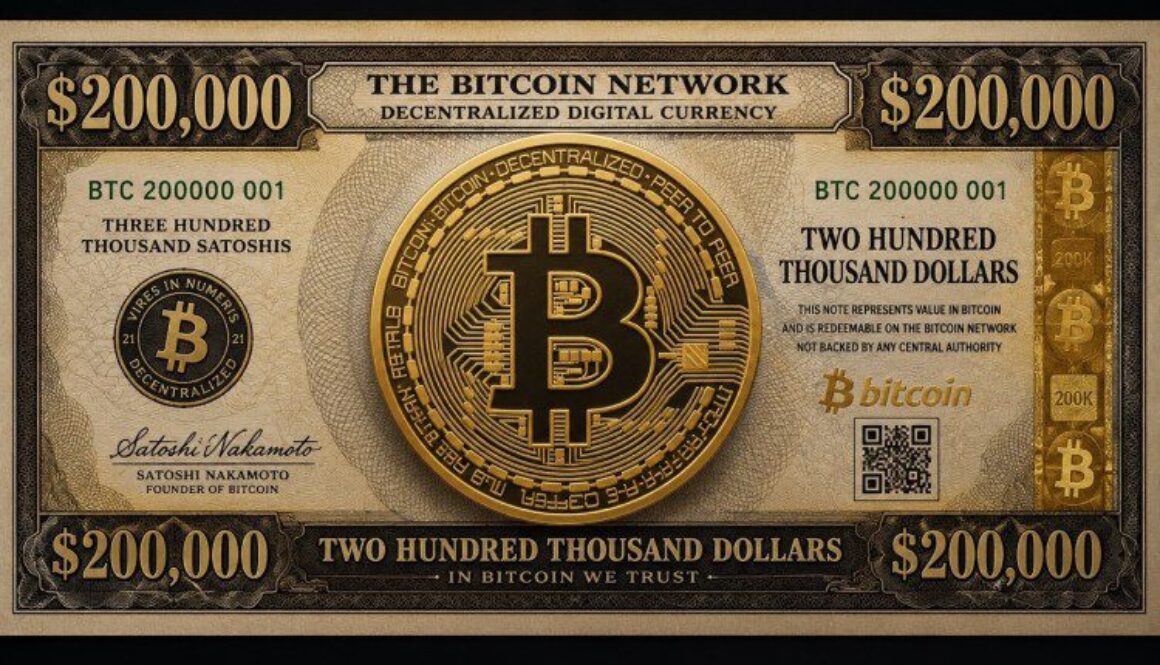
A move to $200,000, another price target being batted around lately, would require Bitcoin to rise roughly 2.5 times from that level. A move to $1 million would require roughly 12.5 times.
Bitcoin has produced larger percentage moves before, but the current forecast cycle now rests on a market question: whether the latest institutional demand is strong enough to absorb coins being sold into the rebound.
Bitcoin price chart showing projected Bitcoin cycle highs and pullbacks across multiple halving periods.
Why seven-figure math is back
The VanEck call lands alongside other seven-figure frameworks. Bitwise CIO Matt Hougan laid out a formal $1 million model in March, arguing that Bitcoin can reach seven figures by gaining share as the store-of-value market expands.
In his model, the market grows to about $121 trillion over 10 years, and Bitcoin reaches $1 million if it captures about 17% of the total.
That is a different time horizon from Sigel’s reported five-year view, but the logic overlaps. Both depend less on a single trading catalyst and more on Bitcoin becoming a larger part of how institutions, advisers, sovereign entities, and younger investors think about long-term savings outside the fiat banking system.
VanEck’s own research desk had already published a longer-range version of that argument. In a 2024 Bitcoin 2050 scenario, the firm modeled a possible $2.9 million Bitcoin price by 2050 if BTC becomes a meaningful medium of exchange and reserve asset.
That report used assumptions around trade settlement, reserve holdings, and Bitcoin scaling infrastructure. The newly reported call is more immediate, but it comes from the same broad research posture: Bitcoin as a macro asset whose valuation depends on adoption beyond crypto-native buyers.
If the thesis is only a trading call, the next resistance level carries most of the weight. If the thesis is that adoption math, ETF flows, portfolio allocation, sovereign reserve behavior, and the size of the global store-of-value market carry more weight than a single weekly candle.
The near-term price frame is less clean. Fundstrat’s Tom Lee’s $200,000 to $250,000 Bitcoin range for 2026 should also be part of the conversation.
Prior CryptoSlate coverage had already placed Lee’s $200,000 forecast among a wide 2026 target set that also included more conservative and more aggressive institutional calls.
Arthur Hayes, the Maelstrom CIO and BitMEX co-founder, is cited as aiming for a shorter-term $125,000 target tied to liquidity and war-driven spending.
Together, those calls make Bitcoin look like it is re-entering a target-heavy phase. Hayes’ framework is macro-liquidity and event-driven. Lee’s is a 2026 market-cycle view.
Bitwise’s model is a store-of-value share calculation. VanEck’s reported call compresses a seven-figure outcome into roughly half a decade.
That difference should keep us grounded. A cluster of bullish forecasts can shift sentiment, but the market structure still has to carry the price there. The Fear and & Greed Index still sits firmly in the ‘fear’ category.
Recent CryptoSlate coverage framed Bitcoin’s rebound above $80,000 as a live test between seller supply and ETF demand. Long-term holders have been taking profits into strength, while spot Bitcoin ETF buyers have helped absorb supply.
That standoff is why the $90,000 area keeps appearing as the next upside test.
The bullish version is straightforward. If ETF demand continues to absorb coins from older holders, the low-$80,000 range could become a base rather than a ceiling. From there, a move toward $90,000 would provide the market with evidence that institutional access is doing real price-discovery work, rather than merely softening a rebound.
That would still leave $200,000 as a stretch target. It would, however, make six-figure 2026 targets easier to discuss without treating them as detached from traded demand.
A market that can hold $80,000, push through $90,000, and do it on broad spot demand would look more compatible with the Fundstrat-style bull case than a market that keeps rejecting the same supply zone.
The failure case is just as important. If ETF demand fades while long-term holders continue selling into rallies, the $1 million conversation becomes a long-horizon adoption argument rather than an explanation for the current price.
In that case, the five-year and 10-year targets can remain intellectually coherent while the 2026 market still struggles to escape its range.
That tension separates price targets from the evidence that would make them relevant now. Bitcoin can leave the $1 million debate unresolved for now. It needs to show whether the buyers who arrived through ETFs and institutional channels are still willing to absorb supply near levels that recently acted as resistance.
The practical threshold is therefore smaller than the largest target on the board. A clean $90,000 push would not validate seven-figure math, but it would show that the market can handle seller pressure while fresh capital still reaches spot Bitcoin products.
What would change the market signal next
Bitcoin needs to hold the low-$80,000 area and then attack $90,000 with enough spot demand to make the move look durable.
ETF flow data, long-term holder distribution, and any fresh confirmation of the VanEck comments will carry more weight than another round number from an executive or strategist.
The seven-figure targets are moving the debate away from whether Bitcoin can regain its 2025 high and toward whether the asset can claim a larger share of global savings. That is a much larger argument than a technical breakout, but it still needs the current market to cooperate.
For now, the credible takeaway is that institutional researchers are again willing to publish or defend seven-figure math while the market tests whether ETF-era demand can turn $80,000 from a stress point into a launch point.
Chainlink (LINK) has been trading in a tight range between $9 and $9.50 over the past week, but one technical indicator suggests that the consolidation may be replaced by heightened volatility in the near future.
The recent whale accumulation and other bullish elements point to a higher probability of an upward move.
Prepare for Potential Turbulence
Several hours ago, the renowned analyst Ali Martinez disclosed that LINK’s Bollinger Bands have squeezed on the 3-day chart. The metric, developed by John Bollinger in the 1980s, uses a moving average flanked by two channels (upper and lower) that widen in volatile markets and narrow when things calm down. Squeezing the bands usually foreshadows a major move, but it offers no clarity on whether a rally or pullback is on the horizon.
The majority of analysts who have touched on the asset lately believe an upside is the more likely option. X user Celal Kucuker claimed that LINK’s graph looks “solid and strong,” envisioning a pump to $100 during the next bull market.
For their part, CRYPTOWZRD suggested that the asset could be at a crossroads as its performance remains deeply correlated to Bitcoin’s price action.
“Above $9.55, we’ll see a further bullish move. Below, random movement will take place,” they predicted.
The Whales Step in
X user CryptoBusy revealed that whales (investors holding over 1 million LINK tokens each) have increased their exposure recently. As explained by the analyst, this move aligns with the latest real-world asset developments surrounding Chainlink and is a pattern historically linked to regime shifts.
Such accumulation is typically viewed as bullish for the price because it signals strong conviction from the big holders, which can encourage smaller players to follow their lead. It is important to note that whales are known as experienced, better-informed investors, suggesting they may be preparing for upcoming news that could positively impact LINK’s valuation.
The declining amount of tokens stored on exchanges is another factor that may favor the bulls. Earlier this week, LINK saw its largest daily net outflow since December of 2025. When investors move their holdings into self-custody, those tokens are less likely to be sold quickly. This, in turn, creates conditions that can support a possible price increase.
Our SEI price prediction anticipates a high of $0.21 by the end of 2026.
In 2028, it will range between $0.35 and $0.43, with an average price of $0.36.
In 2030, it will range between $0.78 and $0.91, with an average price of $0.81.
The Parallel Stack, a robust, open-source framework designed for crafting rollups and Layer 2s that harness parallel processing, is now on SEI V2. The stack enhances Ethereum’s performance by addressing the most common bottlenecks Layer 2 blockchains face. Such developments are anticipated to drive SEI value over the long term.
Regarding price performance, SEI shows signs of trading higher; however, it remains influenced by broader market sentiment. How high will SEI go? Is SEI a good investment? What will SEI’s value be in 2026? Will SEI rise? Read on and discover the SEI price prediction from 2026 to 2032.
Overview
Cryptocurrency
Sei
Ticker
SEI
Current price
$0.05937
Crypto market cap
$414.16M
Trading volume
$25.61M
Circulating supply
6.97B
All-time low
$0.007989 on Aug 15, 2023
All-time high
$1.14 on Mar 16, 2024
24-hour high
$0.06063
24-hour low
$0.05885
SEI price prediction: Technical analysis
Metric
Value
Volatility (30-day variation)
8.66%
50-day SMA
$0.06359
200-day SMA
$0.1522
Sentiment
Bearish
Green days
10/30 (33%)
Fear and Greed Index
21 (Extreme Fear)
SEI price analysis
On April 28, SEI’s price dropped 0.89% in the past 24 hours and was up 12.02% over the past 30 days. Its 24-hour trading volume dropped 28.39% to $26 million, signaling low conviction in the market trend.
The chart shows SEI is moving sideways at $0.06 following a months-long bear run. Its MACD histogram shows waning positive momentum with falling trading volumes signaling less trading interest. Traders are waiting to see if SEI will reclaim $0.08 if it bounces back.
The 4-hour chart highlights SEI’s run in the last 7 days. The trend shows it trades at its highest price range this month. A drop below $0.058 could send SEI back to previous lows with support at $0.053.
SEI technical indicators: Levels and action
Daily simple moving average (SMA)
Period
Value
Action
SMA 3
0.06129
SELL
SMA 5
0.06147
SELL
SMA 10
0.05921
BUY
SMA 21
0.05762
BUY
SMA 50
0.05885
BUY
SMA 100
0.07032
SELL
SMA 200
0.1103
SELL
Daily exponential moving average (EMA)
Period
Value
Action
EMA 3
0.06114
SELL
EMA 5
0.06088
SELL
EMA 10
0.05982
SELL
EMA 21
0.05858
BUY
EMA 50
0.06136
SELL
EMA 100
0.07667
SELL
EMA 200
0.1168
SELL
What to expect from the SEI price analysis next?
SEI remains bearish, with the trend indicating it is moving sideways. A drop from the current level could send SEI to $0.05. Short-term indicators signal consolidation.
Why is SEI down?
Sei’s price decline occurred without a specific negative catalyst in the last 24 hours. Instead, the move extends a broader bearish trend.
Recent news
As part of SEI’s SIP-3 (Giga Upgrade) initiative for mid-February, the coin is set to part with its initial EVM architecture. The inbound IBC transfers are to be disabled as part of the initiative.
Will SEI reach $1?
According to the Cryptopolitan price prediction, SEI will rise above $1 in 2031, reaching a high of $1.37.
Can Sei Coin reach $10?
Per the Cryptopolitan price prediction, SEI is unlikely to reach $10 before 2031.
Will SEI reach $100?
Per the Cryptopolitan price prediction, SEI is unlikely to reach $100 before 2031.
Does SEI have a good long-term future?
According to Cryptopolitan price predictions, SEI will trade higher in the years to come. However, factors like market crashes or difficult regulations could invalidate this bullish theory
Is SEI a good investment?
SEI has growing utility, and its EVM compatibility helps it steal a share of Ethereum’s dominance. While the technical analysis is bearish, price predictions paint a different picture.
SEI price prediction April 2026
SEI will average at $0.106 in April. The price will range between $0.049 and $0.136.
Month
Potential low ($)
Potential average ($)
Potential high ($)
April
$0.049
$0.106
$0.136
SEI price prediction 2026
This year, SEI will trade between $0.07 and $0.18, with an average of $0.21.
Year
Potential low ($)
Potential average ($)
Potential high ($)
2026
0.0708
0.1758
0.2078
SEI price prediction 2027 – 2031
Year
Potential low ($)
Potential average ($)
Potential high ($)
2027
0.2459
0.2529
0.2946
2028
0.3539
0.3640
0.4261
2029
0.5210
0.5392
0.6199
2030
0.7849
0.8065
0.9054
2031
1.1300
1.17
1.3700
2032
1.6600
1.7200
2.0200
SEI crypto price prediction 2027
The SEI forecast climbs higher into 2027. It will range between $0.2459 and $0.2946, with an average price of $0.2529.
SEI coin price prediction 2028
The analysis suggests a further acceleration in SEI’s growth in 2028. According to the Cryptopolitan price forecast, it will trade between $0.3539 and $0.4261, with a year-round average of $0.3640.
SEI token price prediction 2029
Based on SEI’s price movements in 2029, the maximum price is $0.6199, the minimum is $0.5210, and the average is $0.5392.
SEI price prediction 2030
The SEI coin price prediction for 2030 suggests a price range of $0.7849 to $0.9054 and an expected average trading price of $0.8065. This long-term prediction also hinges on SEI’s rising global market recognition and adoption.
SEI prediction 2031
SEI forecast for 2031 sets the high at $1.37. On the lower side, it will drop to a low of $1.13, with an average price of $1.17.
SEI price prediction 2032
Per expert predictions, the price of SEI will range between $1.66 and $2.02, with an average of $1.72.
SEI market price prediction: Analysts’ SEI price forecast
Firm
2026
2027
2028
Gate.com
$0.05354
$0.005434
$0.06993
Coincodex
$0.09070
$.1431
$0.09405
Cryptopolitan SEI price prediction
SEI key price levels are expected to rise in the coming years, according to price prediction tools. The coin will reach a high of $0.2078 before the end of 2026. In 2028, it will range between $0.35 and $0.43, with an average of $0.36. However, SEI is still highly volatile. Negative market sentiment, such as market crashes, could derail the predictions. Always seek independent professional consultation for investment advice.
DOGE price may reach $0.162142 by the end of 2026.
By 2028, DOGE may potentially achieve a peak price of $0.3423.
By 2032, DOGE might touch $0.702617 with an average trading price of $0.675593.
Propelled by a dedicated community of part-time developers and enthusiastic internet supporters, Dogecoin is poised for significant growth in the coming years. Despite relying on borrowed code due to limited resources, its popularity continues to soar, with tens of thousands of social media followers advocating for supply limitations. However, the Dogecoin ecosystem is expected to develop and expand over time. Having touched its ATH at $0.7376, will DOGE reach $1?
Let’s get into the Dogecoin price prediction and technical analysis.
Overview
Cryptocurrency
Dogecoin
Token
DOGE
Price
$0.102 (+5.44%)
Market Cap
$17.28B
Trading Volume (24-hour)
$2.98B
Circulating Supply
169.58B DOGE
All-time High
$0.7316 May 08, 2021
All-time Low
$0.00008547 May 07, 2015
24-hour High
$0.102
24-hour Low
$0.09674
Dogecoin price prediction: Technical analysis
Current Price
$0.102
Price Prediction
$0.1130 (14.35%)
Fear & Greed Index
21 (Extreme Fear)
Sentiment
Neutral
Volatility
1.96%
Green Days
17/30 (57%)
50-Day SMA
$0.09341
Dogecoin price analysis
TL;DR Breakdown:
Dogecoin price analysis shows a bullish trend with the price jumping to $0.102.
The coin reports 5.44% gains in its value for the past 24 hours.
The DOGE coin faces immediate resistance around the $0.106 level.
As of April 17, 2026, Dogecoin’s price analysis reveals a bullish trend. The memecoin’s value significantly increased to $0.102 today, as it shows 5.44% gains over the last 24 hours. The current situation suggests the presence of buying pressure around the recent highs, as the memecoin found support and is racing today.
Dogecoin 1-day price chart analysis
The one-day chart for Dogecoin indicates a solid bullish trend with buying momentum continuing near local highs for the altcoin. The memecoin’s price increased to $0.102 today, as green candlesticks on the 1-day chart shows the return of a larger bullish trend. The immediate support for Dogecoin is also present at the $0.094 level.
The distance between the Bollinger Bands defines the intensity of volatility. This distance is widening, leading to comparatively high volatility levels. Moreover, the upper limit of the Bollinger Bands indicator, indicating the breached resistance level, has shifted to $0.0988, whereas its lower limit, indicating support, has moved to $0.0874.
The Relative Strength Index (RSI) indicator is trending in the neutral area. The indicator’s curve has reached 64 in the past 24 hours. The indicator gives a buy indication as it moves upward, hinting at the presence of bullish elements.
DOGE/USD 4-hour price analysis
Buyers’ support is present above the SMA, which is evident from the appearance of green candlesticks, as bulls are trying to maintain their lead. The DOGE/USD pair is facing high volatility as it approaches the $0.101 level. This comparatively increased volatility signals more volatile price movements in the coming hours. The increasing number of buying positions is currently pushing the DOGE price toward the local resistance of $0.106.
The Bollinger Bands have diverged, and the distance between the indicator’s arms is now wide, leading to high volatility levels. This situation signifies increased market movements. The upper Bollinger Band is now at $0.101, which indicates a resistance level. Conversely, the lower Bollinger Band is at $0.0910, showing the support level.
The Fear and Green Index, a price prediction tool, shows a reading of 21 (Extreme Fear); however, the RSI indicator is in the overbought region on the 4-hour chart as well. Over the last four hours, its value has increased to 72. This situation hints at the presence of support from the buying side, and further appreciation seems possible if bulls succeed in a break above the current price level of $0.102.
Dogecoin technical indicators: Levels and action
Daily simple moving average (SMA)
Period
Value ($)
Action
SMA 3
0.09571
BUY
SMA 5
0.09440
BUY
SMA 10
0.09386
BUY
SMA 21
0.09245
BUY
SMA 50
0.09341
BUY
SMA 100
0.1040
SELL
SMA 200
0.1365
SELL
Daily exponential moving average (EMA)
Period
Value ($)
Action
EMA 3
0.09659
BUY
EMA 5
0.09545
BUY
EMA 10
0.09422
BUY
EMA 21
0.09352
BUY
EMA 50
0.09573
BUY
EMA 100
0.1065
SELL
EMA 200
0.1304
SELL
What can you expect from the DOGE price analysis next?
Dogecoin price analysis gives a bullish prediction following current market sentiment, as the coin’s value significantly increased to $0.102 in the past 24 hours. If buyers keep dominating and overwhelm the market, DOGE’s price might trigger further gains and retest the $0.106 resistance. Conversely, if the bearish trend revives, the meme coin may dip toward the $0.0908 support zone.
Is DOGE a good investment?
Dogecoin has strong potential for growth due to its high adoption and strong community. However, DOGE is highly volatile, and its unlimited supply raises questions about its future price. Social media news and trends also highly affect the meme coin, so diversification and your own research are advised. The coin is expected to touch the $0.198174–$0.252221 level by 2027.
Why is DOGE up?
DOGE’s price has been trading at $0.102 over the last 24 hours, with buying interest resurging. After the DOGE price found support around local lows, buyers took control and pushed the price toward resistance levels, as the memecoin is now trending in green.
What is the expected value of Dogecoin in 2026?
Dogecoin is expected to trade at an average price of $0.135119 in 2026.
Will DOGE reach $0.50?
If the broader cryptocurrency market turns bullish, DOGE will join the rally. As a meme coin, it runs mostly on positive speculation. It’s expected that the coin will touch this level by November 2030, which makes it worth the effort to explore Dogecoin.
Will DOGE reach $1?
Considering Dogecoin’s current value, $1 is still a far-reaching target. However, robust community support can push this meme coin near $1, but not before 2032. However, this is not investment advice, and one must seek professional consultation or carry out their own research to create an investment strategy. As all cryptocurrency investments carry risk, due to the market volatility that may affect the future performance of the crypto assets.
Will DOGE hit $10?
Despite the risk involved with meme-based crypto pairs like Dogecoin, they can still shoot up on positive momentum. However, the market speculates that DOGE cannot reach the $10 level in the foreseeable future.
How much is $500 worth of Dogecoin right now?
$500 is worth nearly 5,550 DOGE in April; however, this amount changes based on day-to-day price fluctuations.
Does DOGE have a good long-term future?
Most well-known altcoins are trading at lower levels, and looking at DOGE, it’s also trading below its average price of the last year. Currently, the coin is trading below the previous year’s peak price of $0.434, which was observed in January 2025, but the trend is expected to change, and a positive outbreak can be expected. The DOGE/USD pair is expected to reach the $0.702617 mark by 2032, so it can be a good decision to buy Dogecoin, and also holding it for longer can be beneficial.
Recent news/opinions on Dogecoin
Cryptopolitan reported that Dogecoin’s market activity has risen by 28% following reports of a potential SpaceX IPO. Dogecoin’s active addresses rose from 57,000 to 73,000. Usually, an increase in users often signals wider adoption, but the activity has yet to translate into market gains.
Dogecoin price prediction April 2026
In April 2026, DOGE could maintain a trading range of $0.0871 to $0.117. The current Dogecoin price prediction suggests an average price of $0.092.
DOGE price prediction
Minimum price
Average price
Maximum price
DOGE price prediction April 2026
$0.0871
$0.092
$0.117
Dogecoin price prediction 2026
In 2026, DOGE could maintain a trading range of $0.0719 to $0.162142, with an average price of $0.135119.
DOGE price prediction
Minimum price
Average price
Maximum price
DOGE price prediction 2026
$0.0719
$0.135119
$0.162142
Dogecoin price predictions 2027 – 2032
Year
Minimum price
Average price
Maximum price
2027
$0.198174
$0.225198
$0.252221
2028
$0.288253
$0.315277
$0.3423
2029
$0.378332
$0.405356
$0.432379
2030
$0.468411
$0.495435
$0.522459
2031
$0.55849
$0.585514
$0.612538
2032
$0.648569
$0.675593
$0.702617
Dogecoin price prediction 2027
Dogecoin’s forecast for 2027 presents an optimistic outlook for the coin. Traders can expect a maximum price of $0.252221, an average trading price of $0.225198, and a minimum price of $0.198174.
Dogecoin price prediction 2028
In 2028, DOGE could reach a maximum price of $0.3423, an average trading price of $0.315277, and a minimum price of $0.288253, which is quite higher than the current Dogecoin price.
Dogecoin price prediction 2029
According to the Dogecoin price forecast for 2029, traders can expect a maximum price of $0.432379, an average trading price of $0.405356, and a lowest price of $0.378332.
Dogecoin price prediction 2030
Dogecoin’s forecast for 2030 presents a positive outlook for the memecoin. The maximum expected price is $0.522459, with an average trading price of $0.495435. The predicted minimum price for Dogecoin is $0.468411.
Dogecoin price prediction 2031
According to the Dogecoin price forecast for 2031, traders and investors can anticipate a maximum market value of $0.612538, a minimum price of $0.55849, and an average trading price of $0.585514.
Dogecoin price prediction 2032
According to the Dogecoin price forecast for 2032, traders can expect minimum and maximum prices of $0.648569 and $0.702617, and an expected average DOGE price of $0.675593.
Cryptopolitan’s Dogecoin price predictions for 2026 suggest a minimum of $0.0719, an average of $0.135119, and a maximum of $0.162142. Our analysis shows that DOGE could cross $0.730818 by 2032.
Dogecoin historic price sentiment
DOGE price history. Chart by Coinmarketcap
2013 was the beginning of Dogecoin, and it surged to $0.0004 in the first days of trading. By March 2014, the coin attempted a breach of $0.001 but failed, closing the year at $0.0001.
In the subsequent years, Dogecoin faced immense competition from new coins, including Stellar, Neo, and Monero, which dragged the coin’s price further down.
According to the Dogecoin historical market records, it traded in a strict range of $0.002 to $0.0036 for most of 2019.
In January 2021, DOGE saw significant gains, closing the month at $0.037. Subsequently, Dogecoin attained an ATH of $0.7376 on May 8, 2021, but lost 76% of its value, closing the year at $0.1703.
In 2022, Dogecoin maintained an average market price of about $0.07. The coin began trading around $0.08 in 2023 and closed the year at $0.08955, maintaining its market capitalization, as per crypto market records.
In 2024, Dogecoin (DOGE) began consolidating around $0.08, surged above $0.2 during March’s bull run, fluctuated between $0.1011 and $0.1759 through mid-year, spiked to $0.4312 in November, and ended the year at $0.314.
In January 2025, DOGE clocked the highest price of $0.41; however, after shedding 38% value, it stepped down to $0.258 in February.
In March, DOGE’s value decreased further as it dipped to the $0.20 range, and April saw the lowest DOGE price of $0.142. However, in May, the meme coin recovered to the $0.249 mark, as the bearish momentum faded.
On July 20, 2025, Dogecoin peaked at $0.274, and at the start of August, DOGE was trending near $0.214.
At the start of October, Doge was trading above $0.21, and at the start of November, it hovered near $0.187.
By the end of December, the price of the memecoin declined toward $0.122, as Dogecoin’s price movements were in a downward direction mostly.
At the start of 2026, Dogecoin was trading near $0.118, and in March it came down to $0.093; the current DOGE sentiment is bearish.
In April, Dogecoin has been maintaining its price channel and is trending near $0.090 with the current market sentiment tilting towards the bearish side.
Our TON price prediction anticipates a high of $4.35 in 2026.
In 2028, it will range between $7.26 and $9.49, with an average price of $7.60.
In 2030, it will range between $17.71 and $20.42, with an average price of $18.27.
TON (The Open Network) is a decentralized protocol designed by Telegram and created by the community. The protocol is a distributed supercomputer, or “super server,” comprising TON Blockchain, TON DNS, TON Storage, and TON Sites. The native token for the TON ecosystem is called Toncoin.
“Will TON ever go up? Can TON reach $10? Where will TON be in five years?” These are the questions traders and investors ask. Let’s answer them and more in our Toncoin price prediction.
Overview
Cryptocurrency
Toncoin
Ticker
TON
Current price
$1.38
Market cap
$3.44B
Trading volume
$118.07M
Circulating supply
2.48B
All-time high
$8.24 on Jun 15, 2024
All-time low
$0.3906 on Sep 20, 2021
24-hour high
$1.44
24-hour low
$1.39
TON price prediction: Technical analysis
Metric
Value
Volatility
4.73% (Medium)
50-day SMA
$1.28
200-day SMA
$1.91
Market sentiment
Bearish
Green days
18/30 (60%)
Fear and Greed Index
21 (Extreme Fear)
TON price analysis
On Apr 14, TON’s price was down 2.62% over 24h but up 6.99% over 30 days. Its trading volume fell by 6.25% to $117M, indicating waning trading interest.
The MACD histogram indicates positive momentum this week, as it trades above the $1.30 support level. The Relative Strength Index (RSI) at 60.74 is in the neutral region.
TON’s negative momentum is rising, limiting further upside. Short term support and resistance levels are at $1.24 and $1.48, respectively. The RSI is neutral (48.35).
TON technical indicators: Levels and action
Daily simple moving average (SMA)
Period
Value ($)
Action
SMA 3
1.59
SELL
SMA 5
1.46
SELL
SMA 10
1.30
BUY
SMA 21
1.25
BUY
SMA 50
1.28
BUY
SMA 100
1.42
SELL
SMA 200
1.91
SELL
Daily exponential moving average (EMA)
Period
Value ($)
Action
EMA 3
1.28
BUY
EMA 5
1.31
BUY
EMA 10
1.39
SELL
EMA 21
1.48
SELL
EMA 50
1.60
SELL
EMA 100
1.84
SELL
EMA 200
2.30
SELL
What to expect from the TON price analysis next?
If TON holds above the $1.30 swing low support, it will continue to trade sideways; a break below would risk a test toward $1.10. Watch for a recovery above the 5-day EMA at $1.31 to signal stabilization.
Is TON a good buy?
According to Cryptopolitan price predictions, TON will trade higher in the years to come. However, factors such as market crashes or stringent regulations could invalidate this bullish theory.
Will TON reach $10?
Yes, TON should rise above $10 in 2029. The move will come as the market recovers to previous highs.
Will TON reach $100?
Per the Cryptopolitan price prediction, TON is unlikely to reach $100 before 2031.
Will TON reach $1,000?
Per the Cryptopolitan price prediction, TON is unlikely to reach $1000 before 2031.
Does Toncoin have a future?
TON has had a bullish run since its inception despite seasonal market corrections. The TON blockchain has a vibrant community of users and developers. Looking ahead, Toncoin has the potential to trade higher in the coming years.
Recent news
TON’s blockchain ecosystem conference, set for May in Dubai, has been canceled amid the escalating conflict in the Middle East.
TON price prediction April 2026
The TON April price prediction ranges from $1.27 to $2.20. It will average at $1.60.
Period
Potential low ($)
Potential average ($)
Potential high ($)
April
1.27
1.60
2.20
TON price prediction 2026
As 2026 unfolds, TON remains bullish, as evidenced by the price registering higher highs. The price will range between $0.97 and $4.35. The average price for the month will be $2.23.
Year
Potential low ($)
Potential average ($)
Potential high ($)
2026
0.97
2.23
4.35
TON price prediction 2027-2032
Year
Potential low ($)
Potential average ($)
Potential high ($)
2027
4.48
4.80
5.71
2028
7.26
7.60
9.49
2029
11.84
12.22
14.29
2030
17.71
18.27
20.42
2031
24.31
25.16
30.81
2032
35.21
37.37
45.12
TON price prediction 2027
The TON token prediction climbs even higher into 2027. According to the prediction, Toncoin’s price will range from $4.48 to $5.71, with an average of $4.80.
Toncoin (TON) price prediction 2028
The analysis suggests a further acceleration in TON’s price. TON will trade between $7.26 and $9.49. It will average at $7.60.
TON price prediction 2029
According to the Toncoin forecast for 2029, the price of TON will range from $11.84 to $14.29, with an average of $12.22.
TON price prediction 2030
The TON price prediction for 2030 is $17.71 to $20.42. The average price of Toncoin will be $18.27.
TON price prediction 2031
The Toncoin price forecast for 2031 has a high of $30.81. However, when the market corrects, TON will reach a minimum price of $24.31 and an average of $25.16.
TON price prediction 2032
The year 2032 will experience more bullish momentum. According to the TON price prediction, it will range between $35.21 and $45.12, with an average trading price of $37.37.
TON price prediction 2026 – 2032
TON market price prediction: Analysts’ TON price forecast
Platform
2026
2027
2028
Coincodex
$2.05
$2.63
$3.41
Gate.com
$1.22
$1.31
$1.53
Cryptopolitan TON price prediction
Our predictions show TON will achieve a high of $4.35 in 2026. In 2028, it will range between $7.26 and $9.49, with an average of $7.60. In 2030, it will range between $17.71 and $20.42, with an average of $18.27. Note that the predictions are not investment advice. Seek independent professional consultation or do your research.
Ton network launched in 2018 as the Telegram Open Network (TON) but was later renamed “The Open Network” and taken over by the TON Foundation.
In June 2020, all Toncoin tokens (98.55% of the total supply) became available for mining.
The tokens were placed in special Giver smart contracts, enabling anyone to mine until 28 June 2022. Users mined around 200,000 TON daily.
All the tokens were mined in two years, marking the completion of the distribution event.
On September 20, 2021, TON registered its all-time low price at $0.3906.
Its first significant break came in November 2021. Over the past few days, the coin has slid from $0.8 to $4.5.
It corrected in 2022, reaching a low of $0.9.
In 2023, it ranged between $1.1 and $2.5.
In 2024, it registered another bull run, rising from $2.11 to its all-time high of $8.24 on Jun 15, 2024.
It corrected later, trading at $5.2 in October and $4.98 in November, when it started recovering.
The recovery saw the coin rise above $6.5 in December.
It then crossed into 2025, trading at $5.5. From there, it entered a bear market, falling below $3.8 in February and $3.0 in May. It crossed into June, trading at $3.20, and it maintained the level into August. In October, it fell to $3.00, and in November to $2.50.
In December, it traded at $1.60 and rose above $1.80 in January 2026. The trend reversed in February, falling below $1.40. In April, it traded at $1.20 mark.