

Why Bitcoin crashed below $60K as support fails when buyers are needed most
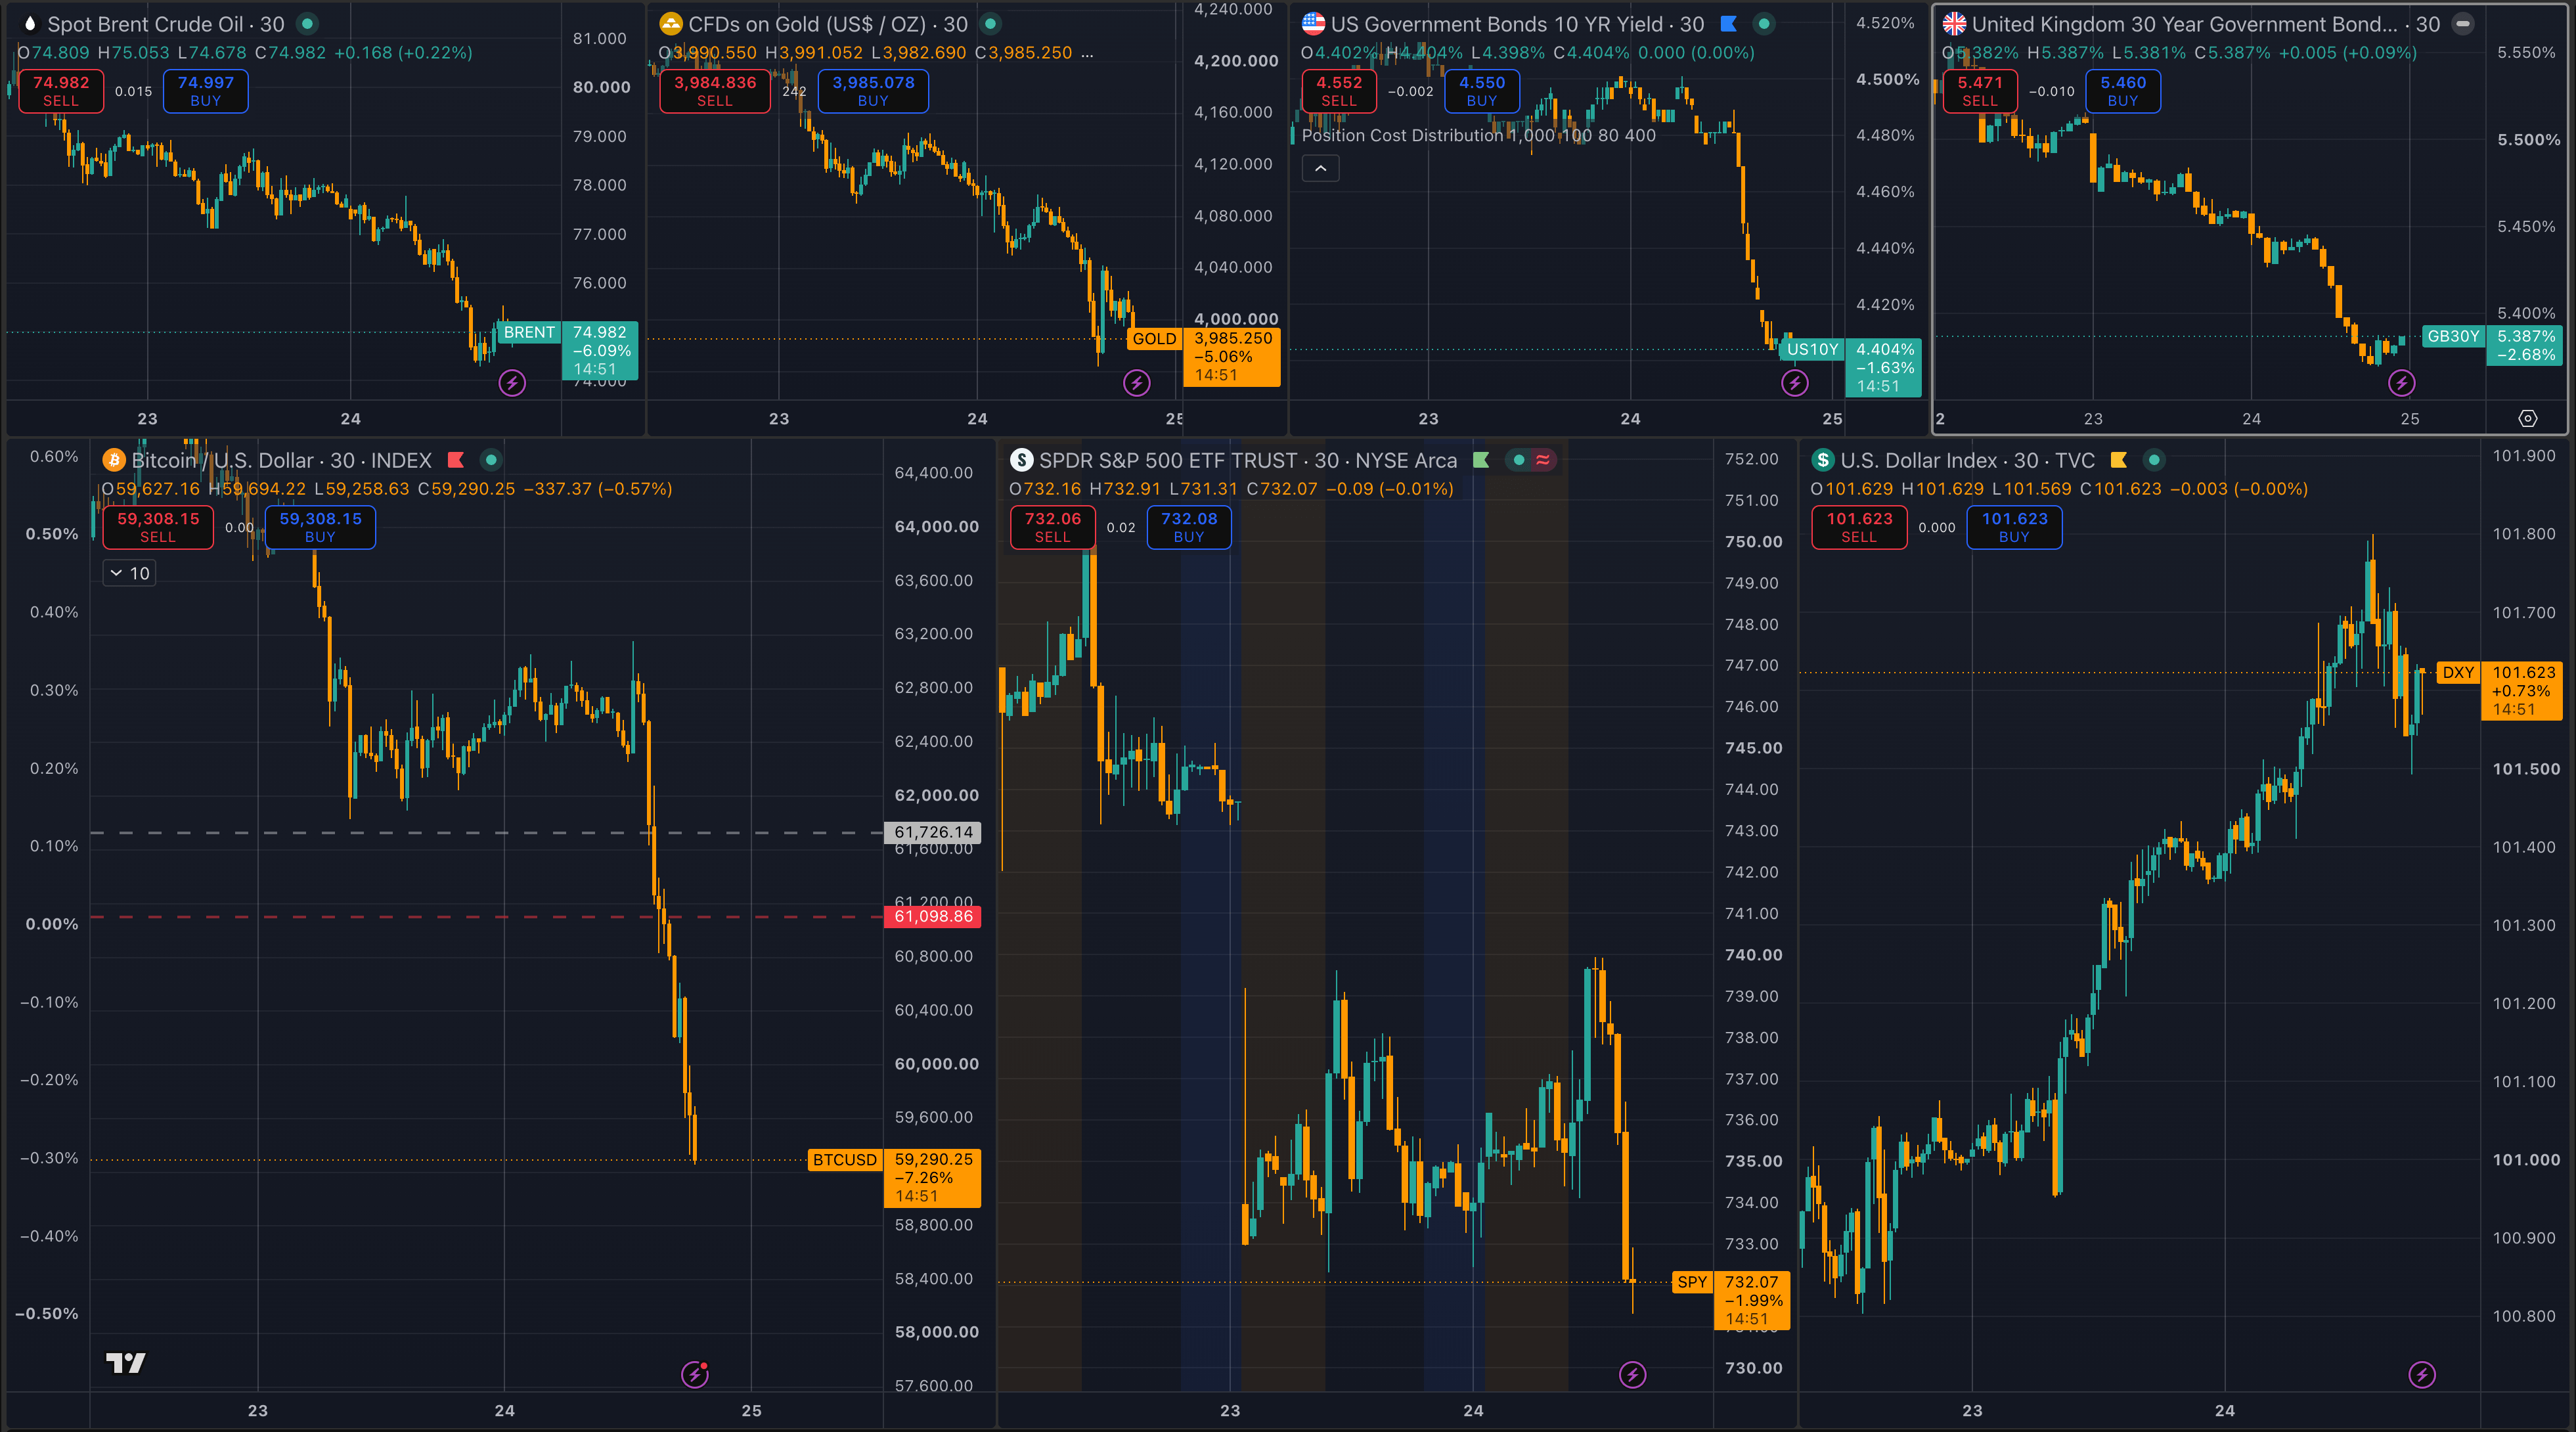
Bitcoin’s break below $60,000 on June 24 exposed the market’s timing problem: sellable coins moved closer to exchanges while ETF demand weakened and leveraged traders cut risk.
CryptoSlate market data shows Bitcoin trading near $59,340, down 4.05% over 24 hours and 9.03% over seven days.


That price puts BTC below one of the market’s most visible support areas just as selling pressure was becoming easier to trace.
The clearest signal came from CryptoQuant, which flagged roughly 7,600 BTC moving into Binance as panic selling picked up. At these market levels, that represents about $479 million in potential sell-side pressure.
Potential is the key qualifier. Exchange inflows show sellable supply moving closer to a venue where it can hit the market, while the $60,000 area was already under pressure.
That is the key difference between a simple price move and a market-structure break. Bitcoin fell as new supply became more available and some of the market’s usual absorbers looked weaker.
Sell pressure reached the venue first
Exchange inflows become more important when they arrive near a crowded level. A move of 7,600 BTC into Binance gains force when set alongside other pressures already building around support.
CryptoQuant’s separate market-deterioration context pointed to weakening conditions around the move, reinforcing the view that the break was driven by a stack of pressures rather than a single clean headline catalyst.
When Bitcoin is hovering at a level as visible as $60,000, traders do not need a single event to trigger selling. They need a reason to doubt that buyers will keep absorbing supply.
That doubt was visible in the flows. Lookonchain reported negative net flows in spot Bitcoin ETFs on June 24, with 1D net flow at -2,548 BTC and 7D net flow at -6,728 BTC.
Still, ETF flows represent only one demand channel, but they have become one of the clearest public gauges of whether institutional-facing demand is adding support or removing it.
When those flows turn negative while exchange inflows rise, the market receives two signals at once. More coins may be available to sell, while one of the most-watched demand channels appears weaker.
ETF outflows were one part of the break, rather than the sole reason, but they help explain why the move accelerated once $60,000 gave way.
The price context added to the pressure. CryptoSlate’s broader crypto market and Bitcoin data shows BTC still holding market dominance but trading with a sharp seven-day decline.
In that setting, dip buying had to fight both spot supply and deteriorating confidence. The same combination also made each new flow update more important, because traders were watching whether the market still had enough absorption to turn a break into a reset.
That is the direct answer to why the break accelerated: new sellable supply appeared while the market’s public demand channel was weakening. The move turned a familiar support test into an absorption test, forcing traders to judge whether buyers were stepping in, whether support had stopped doing its job, and whether leverage would add another round of selling below the line.
Leverage turned the break into a faster move
The second layer was leverage. Lookonchain separately reported that a whale closed an 800 BTC long after Bitcoin fell below $61,000.
One large, long closure only shows a single example of discretionary risk being cut, but the timing is still important. It came before the $60,000 line fully stabilized.
That dynamic changes how support fails when leveraged positions are involved. Spot selling can push the price to a level.
Leverage can make the next leg faster because traders who expected a bounce are forced to reduce exposure or exit when the level fails. That is where liquidation dashboards become part of the story rather than a side detail.
CoinGlass data shows Bitcoin liquidation pressure, with repeated BTC long liquidation alerts near $59,650 to $59,670 as the price traded below $60,000, consistent with the move’s shape. As the price pushed through support, long exposure was being cleared near the new lower range.
The breakdown should therefore avoid a bearish prediction frame. The evidence leaves room for a bounce, but it also shows that the market’s ability to absorb selling weakened precisely when more sellable supply and forced risk reduction became visible.
That makes the liquidation sequence a sign of stress in the support zone rather than a standalone forecast for the next leg.
The distinction changes what traders should watch next. If the break was mainly panic selling into stronger hands, the market should begin to show signs of repair quickly: fewer exchange inflows, calmer liquidation alerts, and ETF flows that stop bleeding.
If those signals fail to appear, the same evidence points to a different conclusion: $60,000 was not redistribution, but failed support.
The sequence also keeps the focus on market plumbing rather than sentiment alone.
The next signal is absorption
A quick bounce above $60,000 would be incomplete if it arrives without calmer flows underneath. The more important question is whether the market can absorb supply without leaning on forced buying or a temporary short squeeze.
For the redistribution case to improve, Binance inflows need to slow after the 7,600 BTC move. ETF flows need to stabilize after the reported 1D and 7D outflows.

Long liquidation pressure needs to cool rather than migrate to lower bands. A $60,000 reclaim would carry more weight if it came with signs of calmer positioning.
The failed-support case gains weight if the opposite happens. Continued exchange inflows would suggest sellers are still preparing to use deep liquidity.
More ETF redemptions would imply weaker demand from institutional investors. Further long liquidations below the near $59,650 level would indicate that the market is still clearing leveraged exposure rather than rebuilding spot demand. Bitcoin is currently testing that exact area.
Strategy and MSTR anxiety also play in the background, as confidence among large Bitcoin holders affects market psychology. However, as of press time, there is independent evidence of direct BTC selling.
The market points elsewhere: sellable coins moved toward Binance, ETF flows were negative, a whale long was closed below $61,000, and liquidation pressure appeared as BTC traded under $60,000.
That makes the $60,000 break a test of absorption more than a simple support failure. Bitcoin can still turn panic selling into redistribution if buyers step in while flows calm.
If they fail to do so, the break has already shown where the weakness sits: new selling reached the market before backstop buyers showed enough strength to catch it.
The post Why Bitcoin crashed below $60K as support fails when buyers are needed most appeared first on CryptoSlate.