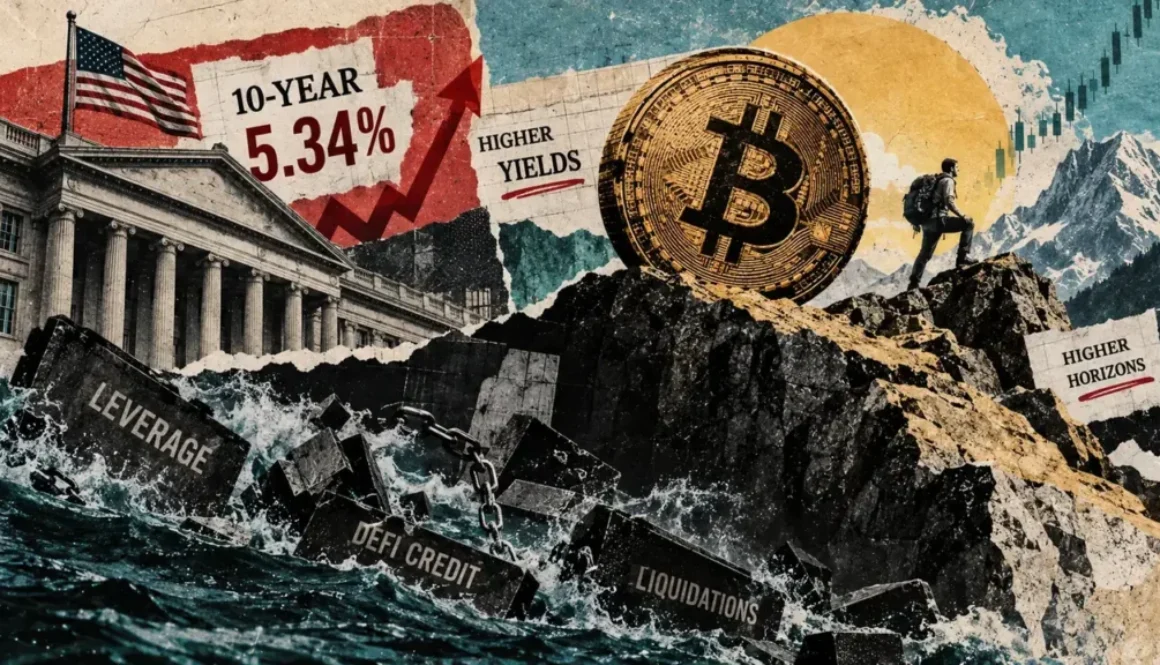
Bitcoin’s price suddenly jumped toward $70K earlier today as investors reacted to an unexpected intervention in the US government bond market.
As CryptoPotato reported, the price tapped almost $70,000, leaving more than $1 billion in liquidated positions across the derivatives market. This is pretty much the highest BTC has traded since the middle of June.
The catalyst for that move appears to have been an announcement on behalf of the US Treasury Department, which will be doubling (at least) the maximum size of liquidity-support buybacks for longer-dated government debt, raising them from $2 billion to at least $4 billion per operation. The changes will start on September 9th and remain in place through November 4.
Why the Treasury’s Move Matters for Bitcoin
The announcement came after increased stress in the bond market. The 30-year Treasury yield touched 5.34% on Tuesday, which was its highest level since 2007. This came amid persistent inflation concerns, heavy government borrowing, and worries about the overall US fiscal outlook.
As Politico reported, the government is stepping up purchases of older Treasury securities as pressure builds in the long end of the market. And the market’s reaction was immediate. The 30-year yield dropped toward 5.20%, while the 10-year yield also moved lower.
This prompted a move in stocks, gold, and crypto, all of which moved up, while the dollar weakened. Lower bond yields can make non-yielding and riskier assets relatively more attractive.
Did the US Government Finally Blink?
In a detailed thread on X, the Kobeissi Letter described the decision as the intervention it had been expecting since July 31. That was when long-term US borrowing costs were already reaching very high levels – unseen since before the global financial crisis (as mentioned above).
TKL argued that the government has a strong incentive to prevent yields from rising indefinitely because its interest bill is becoming increasingly expensive.
Still, the program should not be confused with Federal Reserve quantitative easing (QE). Treasury buybacks are usually designed to improve trading liquidity in older securities, and the additional purchases remain small relative to the enormous Treasury market.
For Bitcoin’s price, however, this entire ordeal showed exactly how sensitive the asset is to changes in yields, the dollar, and expectations for financial-market liquidity. It’s true that many tech stocks also moved up throughout the past few hours, but none of it has been as pronounced as the jump in crypto prices.
Japan’s economy is finally growing again after 30 lost years, JPMorgan Asset Management strategist David Lebovitz says. The escape from the Lost Decades is real, and crypto may end up paying for it.
The Lost Decades were Japan’s long slump after its 1990 bubble burst, when prices fell and rates stayed near zero. That cheap money quietly funded risk bets around the world, including crypto.
Timeline chart of BOJ policy rates from 1990 to 2026 against USD/JPY, Source: BeInCrypto
Japan’s Lost Decades Made the Yen the World’s Cheapest Money
Japan’s slump had one global side effect. The Bank of Japan (BOJ) held rates near zero from 1999. It even went negative in 2016 and stayed there until 2024.
That made the yen the cheapest money on Earth. Investors borrowed it for almost nothing and bought assets that paid more, from US bonds to tech stocks. Traders call this the yen carry trade.
Crypto grew up inside that easy-money era. So did every other risk asset.
Crypto Growth Trajectory
Japan’s recovery is now closing the tap.
The Recovery Comes With a Bill
The good news is real. JPMorgan Asset Management global strategist David Lebovitz made the case in a televised interview. Japan is posting nominal growth, meaning growth in cash terms, for the first time in decades, he said.
“Japanese economy is generating nominal growth for the first time in decades,” said.
However, growth brought inflation, and inflation crushed the yen. The currency hit a 40-year low near 164 per dollar in July. In real terms, it was the cheapest since the 1960s, the Council on Foreign Relations notes.
Japan and the U.S. spent $88 billion propping it up. The relief lasted two weeks before the rescue faded. The dollar is back near 159.50 yen.
US Treasury Secretary Scott Bessent says the real fix is higher Japanese rates. Markets agree and price another hike by October, Japan’s third in 12 months.
Voters are pushing the same way. Analyst account Bull Theory noted that 71% disapprove of Prime Minister Sanae Takaichi’s handling of living costs.
THE US IS PUSHING JAPAN TOWARD A DECISION THAT COULD BREAK ITS ECONOMY
US and Japan jointly intervened to support the yen, with Japan alone reportedly spending $88 billion.
It temporarily pushed the yen from nearly ¥164 to ¥155 per dollar. But it has already weakened back to… pic.twitter.com/jwZcHKlnK9
Higher rates already sting at home. They sit at their highest since 1995, and Japan’s biggest insurers are nursing $96 billion in bond losses.
Crypto Has Seen This Squeeze Before
The last one was brutal. In July 2024, a surprise BOJ hike blew up the carry trade. The Bank for International Settlements (BIS) documented the shock in a bulletin. Bitcoin (BTC) fell about 25% in one week to near $49,000. Japan’s stock market had its worst day since 1987.
Bitcoin Price Performance on July 31, 2026. Source: TradingView
The trade survives because the rate gap is still wide. US rates sit at 3.50% to 3.75%, while Japan’s are at 1%. Every new hike makes cheap yen less cheap.
For now, markets are calm. Bitcoin trades near $64,700, little changed in 24 hours, per BeInCrypto Markets data.
Not everyone expects pain. BitMEX co-founder Arthur Hayes argues a Fed-backed yen defense could add liquidity and pump Bitcoin instead.
Japan waited 30 years for this recovery. Crypto is about to learn what defending it costs. The first answer comes at the BOJ’s September and October meetings.
After two consecutive painful months in which they lost billions of dollars, the spot Bitcoin ETFs finally turned the page in July, but inflows were still modest.
Meanwhile, the exchange-traded funds tracking the performance of the largest altcoin enjoyed the month more, attracting over 2x more fresh capital.
Bitcoin ETFs in July
March and April were quite bullish for the spot BTC ETFs as the financial vehicles attracted well over $3 billion. However, the trend changed violently in May when they lost $2.43 billion. June became the worst month on record, as investors pulled out just over $4.5 billion. In total, the net outflows for May and June stood at nearly $7 billion, and the cumulative total flows dropped from over $58 billion to $51 billion.
July started more positively, with almost $200 million in net inflows during the first full week. Another $76 million followed during the second, and a more modest $34 million in the third. The trend was obvious as the initial high numbers gradually declined, aligning with the underlying asset’s controversial and sporadic price performance and ultimately leading to a very modest increase throughout the month.
The last week in July was once again in the red, with investors pulling $61.53 million out of the funds. Friday was the most painful day, as the total net outflows stood at over $265 million. As such, the month ended with $172.42 million. On one hand, green finally overcame the red wave, but on the other, the number was nowhere near enough to offset some of the recent losses.
ETH ETFs Do Better
The Ethereum ETFs entered July after a similarly painful two-month streak, in which they lost $541 million in May and another $529 million in June. However, investors were more persistent, and the actual net inflows for July were at a more respectable $365.17 million, thus outpacing the BTC ETF flows by over 2x.
Moreover, the ETH ETFs closed all four full weeks of July in the green, including the last one, which saw only one day in the red. Perhaps this investor behavior is among the reasons behind the underlying asset’s major resurgence in July. As reported earlier, ETH ended the month with a substantial 20% increase, making it the best in precisely a year.
All eyes are now on August, which hasn’t been ETH’s most favorable month historically, but there are some major double-digit exceptions.
Bitcoin’s latest retreat below $80,000 shows how quickly the bond market has reclaimed control of crypto trading, even after lawmakers advanced one of the industry’s most closely watched regulatory bills.
Data from CryptoSlate showed that the top asset was trading at $79,083 as of press time, down more than 3% after another failed attempt to hold above $82,000.
Blockchain analytical firm Santiment attributed the reversal to a “buy the rumor, sell the news” market reaction to the Senate Banking Committee’s approval of the CLARITY Act. This was a policy milestone that would typically improve sentiment across digital assets by moving market-structure legislation closer to a full Senate vote.
However, the rally attempt faded as traders shifted their focus back to Treasurys.
The 10-year Treasury yield moved above 4.5% for the first time since June 2025, while the 30-year yield climbed toward 5.1%. Jim Bianco of Bianco Research said the long bond was only 8 basis points away from a fresh 19-year high.
US 30-Year Yield (Source: Bianco Research)
That move has raised the return threshold for Bitcoin exposure. Higher yields make cash, bills, and longer-dated government debt more competitive, while BTC is trying to recover a key technical level.
Nicolai Sondergaard, a research analyst at Nansen, told CryptoSlate that rising yields are narrowing the compensation investors receive for holding assets such as Bitcoin.
According to him:
“The 10-year Treasury yield pressing toward multi-month highs is compressing the risk premium available to assets like BTC, which remain structurally sensitive to the real rate environment. At current levels, the cost of holding zero-yield assets rises meaningfully when alternatives offer 4.5% risk-free.”
The result is a market where crypto-specific progress is no longer enough to carry price action on its own. Washington has improved the industry’s policy outlook, but the rates market is setting the near-term allocation decision.
ETF outflows show where the rate pressure is landing
SoSoValue data show the funds were on pace for more than $700 million in weekly outflows, the largest weekly retreat since late January. The pullback removes a key source of spot demand as Bitcoin tries to reclaim the $82,000 area and move back above its 200-day moving average.
The ETF channel has become central to Bitcoin’s market structure since the funds began trading, providing institutions with a regulated, liquid way to add exposure. When those flows weaken, the spot market loses one of the clearest sources of marginal demand.
Lacie Zhang, a research analyst at Bitget Wallet, told CryptoSlate that higher yields have made institutional buyers more selective because government debt now offers a stronger return profile.
She said:
“Rising US Treasury yields are acting as a clear macro headwind for Bitcoin. As yields move higher, the relative appeal of government debt improves, raising the opportunity cost of holding a volatile, non-yielding asset like BTC.”
Moreover, the weaker ETF picture is being reinforced by on-chain spot-flow data.
CryptoQuant data show that Cumulative Volume Delta has deteriorated across major venues after stronger readings in March. According to the firm, monthly averages of $50 million on Binance and $30 million on Coinbase have slipped to about $6.5 million and $5.7 million, respectively.
Bitcoin Spot Net Volume Delta on Binance and Coinbase (Source: CryptoQuant)
The indicator also briefly turned negative on May 8, pointing to a weaker balance between buyers and sellers. That leaves Bitcoin trading around a major pivot zone, with thinner spot support than during the earlier phase of the rally.
Moreover, the macro backdrop has also become less supportive for risk assets. The unresolved conflict between Iran and the US has added uncertainty around growth and inflation, even after President Donald Trump initially suggested the conflict would last only a few weeks.
Bitcoin’s hedge case remains longer term
Despite this current market situation, the broader investment argument for Bitcoin has not disappeared.
Analysts at Bitunix told CryptoSlate that while the higher treasury yields can pressure BTC in the short term by draining liquidity and reducing speculative appetite, the same forces could strengthen the case for scarce, non-sovereign assets.
According to the firm, if investors are demanding greater compensation for US deficits, debt issuance, and inflation risk, Bitcoin’s fixed supply could continue to attract buyers looking for an asset outside the sovereign credit system.
However, that argument is more likely to influence long-term strategic allocation than short-term positioning.
For now, Bitcoin appears dependent on two catalysts: a retreat in Treasury yields or a recovery in ETF inflows strong enough to absorb the rate shock.
Without either, price action could remain boxed between support in the upper $70,000s and resistance near $82,000.
Stablecoins and tokenized Treasurys draw cautious capital
In light of the current rate environment, crypto traders are repositioning their capital in the market.
Nansen’s Sondergaard said smart-money wallets have moved incrementally toward stablecoins over the past two weeks, showing a preference for flexibility over directional exposure.
This shift points to caution rather than a full exit from the market as the traders seek fresh market catalysts for their trades.
Marcin Kazmierczak, co-founder of RedStone, told CryptoSlate that the risk-free yields above 4% have become a direct competitor to non-yielding assets while strengthening demand for tokenized real-world assets.
Data from Token Terminal shows that tokenized US Treasurys have reached a record high of $15.35 billion in value, up from about $8.9 billion at the start of the year. This represents a 70% growth in under five months.
US Tokenized Treasury (Source: Token Terminal)
According to Kazmierczak, that growth shows capital is still moving through blockchain rails, but with a stronger preference for products tied to short-duration government debt. He added:
“BlackRock BUIDL, VanEck VBILL, Apollo ACRED, Hamilton Lane SCOPE, Franklin Templeton BENJI are all live in production today. Institutions get 4%+ yield with 24/7 settlement, programmable collateral, and composability with DeFi.”
This shift gives the current market cycle a different shape from earlier rate shocks.
Now, Bitcoin is absorbing pressure from a stronger bond market, while another corner of the crypto industry is expanding because that same bond market now offers yield worth tokenizing.
Bitcoin continued to hold near $68,000, a key long-term support level, this morning as traders waited for President Donald Trump’s latest deadline for Iran.
The tension built after Trump said on Truth Social that “a whole civilization will die tonight” as his 8 P.M. Eastern deadline for a deal with Iran approached.
The warning came alongside reports of strikes on Iranian oil infrastructure on Kharg Island, sharpening fears that the confrontation could move from deadline politics to a more disruptive energy shock.
These tensions have left the market suspended between a crypto structure that has so far resisted a deeper breakdown and a macro backdrop growing more difficult by the hour.
Throughout the trading day, Bitcoin has shown some optimism, with prices touching $69,000 before retreating to around $68,500 as traders struggle to decipher Trump’s latest threat that “a whole civilization will die tonight.”
Oil is the transmission engine
Oil has become the main channel through which the US-Iran confrontation is feeding into crypto markets.
Since the US-Iran conflict began, oil prices have soared above $100, thanks in large part to the closure of the Strait of Hormuz, a key oil shipping channel that typically carries about 20% of the world’s oil on a given day.
With Trump’s latest deadline approaching, US crude climbed above $116 a barrel, extending a rally that had already pushed prices toward multi-year highs.
The risks widened further after reports that Iran had threatened to close the Bab al-Mandeb Strait, a route that accounts for roughly 12% of global seaborne trade and has become even more important since the shutdown of Hormuz.
The Kobeissi Letter said that any disruption there could place another major shipping route under pressure and raise the prospect of oil reaching $150 a barrel.
That is where the market threat becomes more serious for Bitcoin.
Once crude moves into that range, the concern extends beyond war headlines or day-to-day swings in risk appetite. Sustained strength in energy prices can reinforce inflation fears, support the dollar, and reduce the room for central banks to ease policy.
Data from CryptoQuant showed the flagship digital asset’s recent rebound occurred while aggregate funding rates across exchanges remained negative.
Bitcoin Funding Rate (Source: CryptoQuant)
This suggests the move has not been driven by traders piling into leveraged bullish bets. Instead, short sellers are still paying to keep bearish positions open even as the price stabilizes and edges higher.
That is usually a healthier setup than a rally fueled by aggressive leverage.
When Bitcoin rises while funding stays negative, it suggests spot buyers are absorbing selling pressure rather than momentum traders chasing the market higher. A rebound built on leveraged longs can fade quickly when sentiment turns.
However, a rebound supported by real buying can keep moving even while the broader market remains skeptical.
Meanwhile, this leaves short sellers vulnerable. Bearish positions opened below current levels can become fuel for a sharper move higher if Bitcoin continues to recover and forced liquidations begin to build.
That dynamic helps explain why Bitcoin has not followed the geopolitical backdrop lower in a more decisive way. The market is still leaning bearish, but price action has not yet confirmed that view.
Still, that support has limits. If the recovery loses momentum before enough short positions are cleared out, the downside can reopen quickly because the market has less leveraged long support beneath it.
A narrow range is making the next move more fragile
At the same time, BTC is trading inside a structure that leaves little room for error.
Glassnode data showed the token in a tight negative gamma pocket between roughly $65,000 and $70,000, an area where dealer hedging can intensify short-term moves in either direction.
Bitcoin Market Positioning (Source: Glassnode)
According to the firm, resistance is building near $72,000, while support below current levels is thinner if momentum fades. The result is a market that can appear stable for stretches and then move abruptly once a catalyst arrives.
The trigger here is coming from Washington, not from within crypto. Traders are not positioning around an earnings release, a network upgrade, or ETF flows. Instead, they are positioning around a deadline that could move oil, shift inflation expectations, and reprice risk assets in the same session.
Markets are weighing another delay against a deeper shock
Part of the restraint in price action reflects pattern recognition.
QCP Capital said markets have spent weeks absorbing weekend escalation rhetoric followed by early-week de-escalation signals, leaving stocks broadly stable and crypto more resilient than the headlines alone would suggest.
The pattern has made traders less willing to fully price in each new threat. At the same time, it has not removed the risk. Each new strike, each new warning, and each new threat to energy infrastructure raises the cost of assuming that this episode will also end in another delay.
Trump has left room for the deadline to move again if talks make progress and something tangible emerges. At the same time, Iran appeared to have halted diplomatic discussions amid the latest threats. That has kept conviction low and volatility close to the surface.
For now, Bitcoin is holding its ground without escaping the pressure around it. Buyers have defended a major support area, and negative funding suggests bearish positioning has not produced the breakdown many expected.
But the market remains stuck in a tight range while oil surges and policy risk dominates trading. A softer turn from Washington could force short sellers to cover, lifting Bitcoin back toward $70,000 and then $72,000.
However, a deeper escalation would shift attention immediately back to inflation, financial conditions, and whether crypto can withstand a broader move out of risk.
Until then, Bitcoin remains tied to the next signal from the White House.