Peter Schiff has put a number on the bond market’s damage. The iShares 20+ Year Treasury Bond ETF (TLT), built on the world’s safest debt, fell to $81.89 on Friday.
That is a fresh 52-week low. The fund peaked at $179.70 in March 2020. It has now lost more than half its value.
iShares 20+ Year Treasury Bond ETF (TLT). Source: Investing.com
The Safest Trade in Markets Lost Half Its Value
TLT holds US government bonds maturing in more than 20 years. None can realistically default. The Treasury backs every one. So the risk was never that America stops paying. The risk was interest rates.
Bond prices fall when yields rise. This fund feels it harder than almost anything.
TLT carries an effective duration of 14.9 years, according to iShares. In plain terms, a one point rise in yields costs roughly 15% of the price.
TLTFixed Income iShares 20+ Year Treasury Bond ETF Portfolio Characteristics. Source: iShares
The real damage is worse than Schiff’s number. The fall from $179.70 to Friday’s low works out at 54%.
Then there is inflation. Prices have risen 29% since March 2020, per the Bureau of Labor Statistics. In purchasing power, long bond holders are down closer to 65%.
Bids covered the offering 2.39 times, in line with recent sales. Demand was adequate. The price was not.
That yield is the story. Across 92 sales of 30-year bonds since 2001, only one cost the government more, Treasury auction records show. That was February 2001, at 5.46%.
What happened next is worth pausing on. Nine months after that sale, the Treasury stopped issuing 30-year bonds completely. Officials expected to retire the national debt within a few years.
The bond returned in 2006, once surpluses had turned into deficits. It now costs the most since the year Washington believed it would never need it again. BeInCrypto has tracked how surging bond yields have failed to lift risk assets this year.
Schiff, a gold advocate and long-running Bitcoin critic, framed the low as a verdict on anyone who chose safety.
“$TLT, the 20-year U.S. Treasury ETF, just hit a new low for the year. Trump thinks America is winning, but anyone who invested in Treasuries is losing bigly. TLT is down 6% so far in 2026 and 50% from its 2020 high. Plus, real losses are much greater when adjusted for inflation,” he wrote.
His numbers check out, and the 50% is conservative. The 2026 price decline is 5.81%, per Barchart. Counting the interest the fund pays monthly, that narrows to 2.78%.
What Peter Schiff’s Warning Means for Bitcoin
The link to crypto is opportunity cost. TLT now yields 5.17% over 30 days. A government bond paying above 5% competes directly with an asset that pays nothing.
Bitcoin (BTC) traded near $62,968 on Friday, down 3.2% in 24 hours. Schiff argued in July that the next major crash would start in the bond market rather than in crypto.
Bitcoin Price Performance. Source: BeInCrypto
Bitcoin holders read the same numbers the other way. Borrowing costs at 25-year highs, they argue, are the case for a scarce asset outside the banking system. Through 2026, the yield pressure has won that argument.
The next test comes quickly. The Treasury sells $16 billion of 20-year bonds on Wednesday.
Weak demand would push long yields higher and keep the pressure on Bitcoin. Strong demand would give both markets room to breathe.
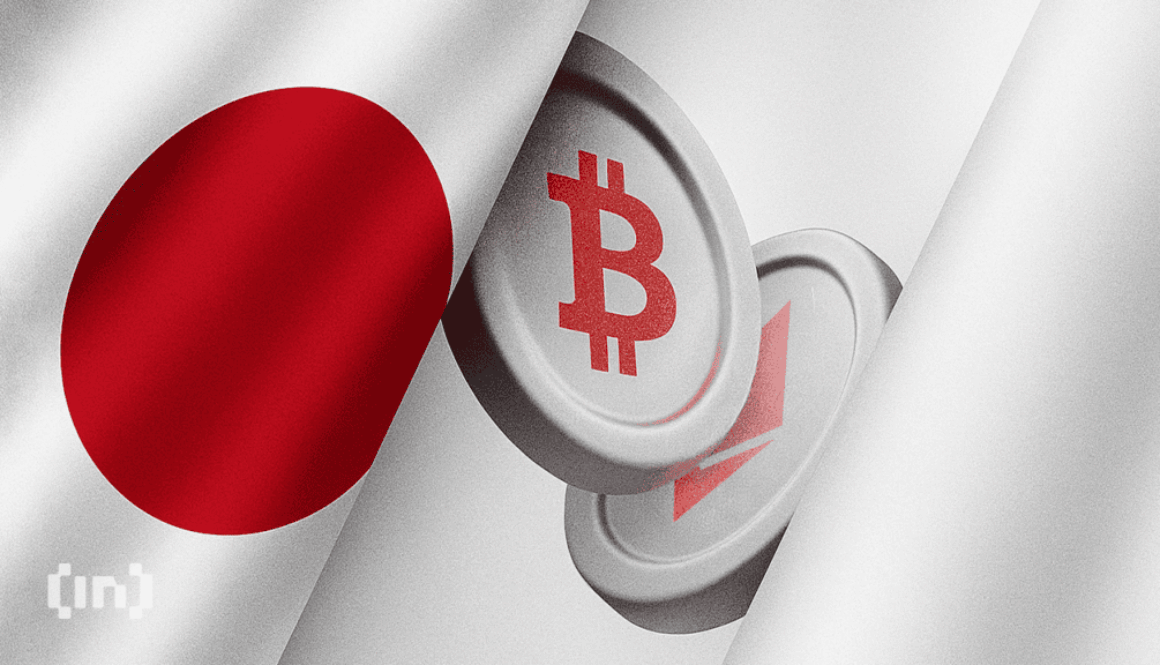
Japan’s economy is finally growing again after 30 lost years, JPMorgan Asset Management strategist David Lebovitz says. The escape from the Lost Decades is real, and crypto may end up paying for it.
The Lost Decades were Japan’s long slump after its 1990 bubble burst, when prices fell and rates stayed near zero. That cheap money quietly funded risk bets around the world, including crypto.
Timeline chart of BOJ policy rates from 1990 to 2026 against USD/JPY, Source: BeInCrypto
Japan’s Lost Decades Made the Yen the World’s Cheapest Money
Japan’s slump had one global side effect. The Bank of Japan (BOJ) held rates near zero from 1999. It even went negative in 2016 and stayed there until 2024.
That made the yen the cheapest money on Earth. Investors borrowed it for almost nothing and bought assets that paid more, from US bonds to tech stocks. Traders call this the yen carry trade.
Crypto grew up inside that easy-money era. So did every other risk asset.
Crypto Growth Trajectory
Japan’s recovery is now closing the tap.
The Recovery Comes With a Bill
The good news is real. JPMorgan Asset Management global strategist David Lebovitz made the case in a televised interview. Japan is posting nominal growth, meaning growth in cash terms, for the first time in decades, he said.
“Japanese economy is generating nominal growth for the first time in decades,” said.
However, growth brought inflation, and inflation crushed the yen. The currency hit a 40-year low near 164 per dollar in July. In real terms, it was the cheapest since the 1960s, the Council on Foreign Relations notes.
Japan and the U.S. spent $88 billion propping it up. The relief lasted two weeks before the rescue faded. The dollar is back near 159.50 yen.
US Treasury Secretary Scott Bessent says the real fix is higher Japanese rates. Markets agree and price another hike by October, Japan’s third in 12 months.
Voters are pushing the same way. Analyst account Bull Theory noted that 71% disapprove of Prime Minister Sanae Takaichi’s handling of living costs.
THE US IS PUSHING JAPAN TOWARD A DECISION THAT COULD BREAK ITS ECONOMY
US and Japan jointly intervened to support the yen, with Japan alone reportedly spending $88 billion.
It temporarily pushed the yen from nearly ¥164 to ¥155 per dollar. But it has already weakened back to… pic.twitter.com/jwZcHKlnK9
Higher rates already sting at home. They sit at their highest since 1995, and Japan’s biggest insurers are nursing $96 billion in bond losses.
Crypto Has Seen This Squeeze Before
The last one was brutal. In July 2024, a surprise BOJ hike blew up the carry trade. The Bank for International Settlements (BIS) documented the shock in a bulletin. Bitcoin (BTC) fell about 25% in one week to near $49,000. Japan’s stock market had its worst day since 1987.
Bitcoin Price Performance on July 31, 2026. Source: TradingView
The trade survives because the rate gap is still wide. US rates sit at 3.50% to 3.75%, while Japan’s are at 1%. Every new hike makes cheap yen less cheap.
For now, markets are calm. Bitcoin trades near $64,700, little changed in 24 hours, per BeInCrypto Markets data.
Not everyone expects pain. BitMEX co-founder Arthur Hayes argues a Fed-backed yen defense could add liquidity and pump Bitcoin instead.
Japan waited 30 years for this recovery. Crypto is about to learn what defending it costs. The first answer comes at the BOJ’s September and October meetings.
Bitcoin is stuck near $65,000, and trader Wise Crypto thinks AI spending is a big part of why.
The OG crypto poked above $66,000 earlier this week before losing steam, and the pattern points to money chasing AI stocks instead of crypto while inflation and bond yields keep pressure on risk assets.
Where the Money Is Actually Going
Wise Crypto laid out the case on X Thursday, noting that while spot Bitcoin ETFs have had seven consecutive days of inflows that have raked in just under $1 billion, the number was a small one next to the $6.9 billion that left those same funds in May and June.
Meanwhile, Big Tech is spending somewhere between $190 billion and $205 billion on AI infrastructure this year, with Nvidia’s data center revenue up 92% year over year, and AI-linked stocks have climbed roughly 69% since January. Bitcoin, over that same stretch, is down about 25%.
“Capital is flowing to AI, not crypto,” Wise Crypto wrote, pointing to two-year Treasury yields near 4.3% and ten-year yields near 4.6% as the forces keeping the dollar strong and investors cautious on risk assets.
The price data backs up the stall, as BTC was trading around $65,400 at the time of writing, down 0.6% on the day, after swinging between about $65,300 and $66,300 in the last 24 hours and between $62,500 and $66,900 over the past week. It is still up close to 5% across 30 days but sits roughly 45% below its all-time-high near $126,000 from last October.
Another market watcher, Ted Pillows, writing in his Thursday market report, pointed to Brent crude being near $94 a barrel after another round of US-Iran strikes, along with a ten-year TIPS real yield of about 2.31%, a post-pandemic high, as the direct drag on non-yielding assets like Bitcoin right now.
“I’d rather watch $64,000 get defended than chase a run back toward $66,500,” he said.
The Technical Levels Traders Are Watching
Michaël van de Poppe has said Bitcoin has already reached its target area, and that holding above the 21-day moving average keeps the door open for near-term gains, with $68,000 marking the next resistance zone and a break above it potentially opening a run to $73,000.
Fellow analyst Axel Adler noted that ETFs have taken in $439 million so far this week, while the so-called Coinbase discount, running for 78 days now, has started to narrow.
Further out, EGRAG CRYPTO flagged a developing double bottom pattern that would need a weekly close above $83,000 to gain traction, with $173,000 the eventual target if the setup plays out, though a weekly close below roughly $51,000 would invalidate it.
A similar reaction zone between $67,900 and $68,300 was pointed to by Bitfinex analysts, who also noted that short-term holders who bought in that range tend to sell once they recover their original positions, a pattern that has capped rallies before and could do so again if $68,000 comes back into play.
Bitcoin, once promoted by some investors as a hedge against geopolitical turmoil, is behaving like a liquidity-sensitive risk asset at a time when energy prices are climbing, and macro stress is spreading.
This comes as the conflict between the United States and Iran deepens, with shock rippling through oil, the dollar, and broader financial conditions before landing in a crypto market that is already showing signs of fatigue.
That has reopened discussion of a far steeper downside path than the market had been willing to entertain only weeks ago.
Why this matters: This marks a shift in Bitcoin’s behavior under stress. Instead of attracting defensive flows amid geopolitical risk, it is reacting to tighter financial conditions, rising oil prices, and a stronger dollar. That changes how investors position around macro shocks and raises the likelihood of deeper drawdowns if liquidity continues to contract.
By signaling that US military operations could intensify over the next two to three weeks, without offering a clear timeline for an end to hostilities, the administration pushed investors back into a defensive stance.
The initial reaction showed up across equities, though the deeper signal came from energy.
US stocks fell intraday before paring losses by the close, with the S&P 500 down 0.23% and the Dow Jones Industrial Average off 0.39%. In Asia, the sell-off was sharper, with South Korea’s KOSPI dropping 4.2% and MSCI Emerging Asia falling 2.3%.
Oil moved more decisively. Data from Oilprices.com showed that West Texas Intermediate crude jumped 11.41% to $111.54 a barrel, its biggest absolute gain since 2020, while Brent rose 7.78% to $109.03.
The move followed US-Israeli strikes that began on Feb. 28 and Iran’s effective closure of the Strait of Hormuz, the chokepoint that carries roughly one-fifth of global oil and liquefied natural gas flows.
These developments have significant impacts on the crypto market as a sustained rise in crude directly feeds into inflation expectations, tightens financial conditions, and reduces the market’s tolerance for speculation.
With the dollar index up 0.48%, Treasury market spreads wider by 27%, and the VIX climbing toward 25, the broader macro picture is turning against risk assets that depend on abundant liquidity and steady investor appetite.
The Iran escalation may have accelerated the latest sell-off, but it did not create the market’s fragility. Bitcoin was already losing support before the geopolitical backdrop deteriorated.
CryptoQuant data show selling pressure has continued to outweigh institutional accumulation despite earlier support from spot exchange-traded funds and corporate buyers such as Strategy. The firm’s 30-day apparent demand growth stands at -63,000 BTC, indicating that fresh demand has not been strong enough to absorb supply.
Bitcoin Apparent Demand (Source: CryptoQuant)
The same pattern is visible across large holders. Whale wallets holding between 1,000 and 10,000 BTC have shifted from accumulation into one of the sharpest distribution phases of the cycle. The one-year change in whale holdings has swung from an increase of about 200,000 BTC at the 2024 peak to a deficit of 188,000 BTC.
Mid-sized holders have also pulled back. Wallets holding between 100 and 1,000 BTC, often seen as an important layer of market support, have seen their holdings grow by only 429,000 BTC in the current market cycle, compared to about 1 million BTC in late 2025.
This weakness is especially clear in the United States. Coinbase Premium, a common gauge of US spot demand, has remained negative even as Bitcoin fell into the $65,000 to $70,000 range. That suggests American buyers, both retail and institutional, have not returned in enough size to stabilize the market.
Essentially, those figures help to describe a market that had already begun to lose resilience before war headlines intensified.
In calmer markets, that kind of positioning can help maintain price levels. However, it becomes a vulnerability in a macro shock as contracts that might otherwise have rolled forward are more likely to be cut, either by choice or through forced liquidation.
That is how orderly weakness turns into a cascade. Prices fall, leveraged longs are forced out, more selling follows, and the market starts moving on positioning stress rather than conviction.
Analysts at Bitunix told CryptoSlate that Bitcoin remains stuck in a passive pricing regime, with resistance around $69,400 still uncleared and downside liquidity continuing to build near $65,500. In a more hostile macro setting, that lower band could become the trigger point for a broader liquidation wave.
Options markets are sending a similarly cautious message. Greeks.live data show 28,000 BTC contracts expired on April 3 with a put-call ratio of 0.54 and a max pain point at $68,000, representing $1.8 billion in notional value.
According to the firm:
“Bitcoin performed poorly in both price and market sentiment during the first quarter of this year, and the first week of the second quarter has also been weak. Rebuilding confidence may require time and capital support; currently, all indicators point to bear market conditions.”
Why $10,000 is still a tail risk
Bitunix has described the current environment as a triple-constraint regime shaped by elevated inflation expectations, policy limits, and widening geopolitical risk.
That framework helps explain why crypto is reacting so sharply, as liquidity cannot ease much if oil stays high. At the same time, market confidence cannot recover easily if war risk continues to rise, speculative positions become harder to defend as the dollar strengthens, and volatility rises across asset classes.
In a moderate scenario, where the conflict remains contained but inflation stays elevated, unwinding leveraged futures could drag Bitcoin from around $70,000 to $50,000, within a roughly 25% to 30% correction.
Meanwhile, a harsher bear-case path would emerge if ETF outflows accelerate, spot demand remains weak, and the dollar continues to tighten financial conditions. In that setting, Bitcoin could slide into the $20,000 to $30,000 range, erasing 60% to 70% of its value from recent levels.
Bitcoin recovers toward resistance as liquidation pressure subsides.
Possible, but dependent on macro stabilization.
Moderate downside
Around $50,000
Conflict remains contained, but inflation stays elevated and leveraged futures positions unwind.
Roughly 25% to 30% correction from the recent $70,000 area.
Plausible downside case.
Mid-term bear case
$20,000 to $30,000
ETF outflows accelerate, spot demand remains weak, and the U.S. dollar continues to tighten financial conditions.
Bitcoin enters a deeper contraction, wiping out 60% to 70% from recent levels.
More severe, but still within historical drawdown patterns.
Tail-risk black swan
Around $10,000
Prolonged Strait of Hormuz closure or wider regional war sends oil to $150 to $200 a barrel and triggers a collapse in global liquidity.
Bitcoin suffers an extreme drawdown as speculative capital exits the market.
Tail risk, not the base case.
The move to $10,000 sits beyond that as a black swan outcome. It would likely require a prolonged closure of the Strait of Hormuz or a wider regional war severe enough to push oil toward $150 to $200 a barrel, drive a much sharper tightening in global liquidity, and knock equities down by more than 30%.
Under those conditions, speculative capital across crypto would shrink dramatically, leaving Bitcoin exposed to the kind of 80% drawdown seen in earlier cycle washouts.
For now, the immediate takeaway is that Bitcoin is not acting as a safe haven amid war. Instead, it is trading like a highly sensitive risk asset whose direction still depends on liquidity, leverage, and the market’s willingness to absorb macro shock.