Cardano’s largest holders have been increasing their exposure even as smaller investors reduce theirs, according to Santiment’s latest supply distribution data.
Wallets holding between 100,000 and 100 million ADA now collectively own more than 25.6 billion coins. The figure is the highest balance since February 2023. On the other hand, wallets holding fewer than 100 ADA have reduced their holdings by about 0.7% over the past four months.
Whales See Opportunity
Santiment said this trend comes as ADA faces intense FUD. The crypto asset’s price performance in 2026 fell short of expectations, and it recently traded near multi-year lows. Last week’s upside push toward $0.2 proved futile after ADA quickly pulled back. It slid to $0.15 and was down more than 11% over the past week. Despite that backdrop, major holders have continued accumulating.
The analytics firm pointed to several ongoing developments within the Cardano ecosystem, including work on the Leios testnet, continued Hydra scaling upgrades, progress on Mithril, integration of Pyth oracles, and new ecosystem funding initiatives.
These combined factors – whale and shark accumulation, declining retail participation, and persistently weak sentiment – represent one of the healthier market setups ADA has shown so far this year, although it does not necessarily signal an immediate price reversal.
String of Setbacks
2026 has been challenging for Cardano as the ecosystem has witnessed a series of setbacks. This month, EMURGO announced it was stepping down from the Cardano Pentad, the network’s governance group, to focus its resources on helping users recover from the SecondFi exploit. One community member described the exit as worrying and speculated that the organization may have run out of funds following the SecondFi exploit.
Earlier in the year, analytics platform TapTools shut down, while the planned 2026 Singapore Summit was called off. During the same period, Charles Hoskinson also warned that a “wave of failures” could hit DeFi projects built on the network. The developments came even as the ecosystem continued pushing ahead with technical upgrades behind the scenes.
The Cardano network has seen a sharp increase in both network activity and online discussions, even as ADA has fallen to levels not seen since December 2020.
According to the latest findings by Santiment, daily active addresses and social dominance have surged for the second time this month, making Cardano one of the most discussed assets in the crypto market.
Cardano Network Activity
Data revealed that the number of active addresses on the network climbed to 29,025, as Cardano accounted for 0.33% of all cryptocurrency-related discussions. Santiment found that the rise in activity comes as ADA faces heavy price pressure and increased volatility. The increase in bearish sentiment has been linked to recent comments from Charles Hoskinson, who warned that more Cardano projects could fail.
His decision to reduce his public involvement and ongoing disagreements within the community over treasury funding have also added to concerns. Although sentiment remains weak, Santiment said that spikes in network activity combined with growing market concerns have historically preceded mild ADA rebounds.
The first occurred in late March to early April, when active addresses climbed to around 22,000, and social dominance rose above 0.40%. Another instance appeared in early June, with active addresses reaching roughly 32,500 and social dominance peaking near 0.38%. In both cases, the spikes in network activity and discussion levels were followed by a modest recovery in ADA’s price, according to the analysis.
Bull Trap For ADA?
At the time of writing, ADA is trading at $0.14 after suffering a decline of more than 3% over the past 24 hours. The crypto asset’s daily chart recently generated a TD Sequential buy signal, which may indicate a short-term price rebound. However, crypto analyst Ali Martinez warned that traders should remain cautious despite the bullish signal.
The warning comes after a security breach involving a Cardano-based wallet protocol that led to the theft of nearly 129 million ADA, worth around $20 million.
Martinez said any near-term recovery could turn into a bull trap, attracting buyers before the price resumes its decline. As such, any relief rally is likely to face resistance between $0.160 and $0.176. If ADA fails to break above this range, the price could move lower and establish new lows.
Tuesday turned ugly for crypto markets, with a broad wave of selling hitting altcoins across the board, led by Zcash (ZEC), which dropped 11%, World Liberty Financial’s WLFI, which was down 8%, and Ondo Finance (ONDO), falling 7%.
The losses came against a backdrop of rising bearish sentiment in the crowd, which, according to blockchain analytics firm Santiment, has historically happened right before prices rebounded.
Details of the Sell-Off
Santiment flagged the damage in a post on X earlier today, noting drops in Ondo, Zcash, WLFI, and DeXe, among others.
For Ondo, the timing was particularly grim, seeing as the dip came right on the heels of the passing of 32-year-old founder and CEO Nathan Allman. The company announced that longtime President Ian De Bode will take over as CEO. The token is now trading near $0.41, putting its performance in the last seven days up by roughly 9%.
Zcash’s 11% single-day drop was the sharpest among the named losers, although at the time of writing the decline was at about 7.5% in the last 24 hours, with ZEC trading at around $570. For context, the asset is up 60% over the past month and nearly 970% across the last year, so the daily move looks less alarming against that backdrop.
Meanwhile, WLFI’s 8% dip added to a difficult stretch for the token, which hit a new all-time low in late April after crashing 16% in one day. It has had to navigate a controversial lock-up proposal, a lawsuit by Tron’s Justin Sun, and continued scrutiny over ties to the Trump family.
It Wasn’t All Red
Despite the losses mentioned above, the weekly picture looked different for some tokens. For example, NEAR was up more than 55% over seven days, and it was changing hands around the $2.50 level, although it pulled back nearly 8% on Tuesday alone. Another gainer was Hyperliquid’s HYPE token, which went up 25% per Santiment’s data.
However, the week’s standout was RAIN, which hit an all-time high of around $0.012 on Tuesday after climbing almost 55% for the week and over 44% in the last 24 hours alone.
Separate data from Santiment posted on the same day showed that bearish crowd expectations have been building for about 10 days now, with the firm noting that this kind of collective lean toward caution has historically heralded price recoveries, considering that markets tend to move against the crowd’s prevailing mood.
But traders will have to wait and see whether that plays out this time, especially with Bitcoin still stuck below $77,000 and struggling to break above its descending 200-day moving average near $80,000.
Ethereum (ETH) has shed nearly 30% of its market value so far this year. Despite numerous recovery attempts, its market performance throughout May remained weak. Growing fear and frustration around the asset have become increasingly visible across social media and market activity.
According to Santiment, the downturn has not been driven by a single major negative event, but rather by several bearish narratives building at the same time.
Bearish Narratives Spiral
One of the clearest signs highlighted by the firm was the rise in Ethereum’s social dominance even as prices continued falling. While higher social dominance can often signal strong bullish attention during rallies, Santiment noted that Ethereum’s discussion volume surged after its April 17 local top precisely when the asset began losing momentum.
Instead of conversations centered around optimism or new highs, social media discussions were increasingly focused on disappointment, frustration, and concerns about further downside. Santiment also flagged a steady deterioration in sentiment ratios on social media platforms.
During late April, Ethereum maintained relatively strong sentiment levels, as it recorded more than two bullish comments for every bearish one. However, that ratio gradually declined throughout May until bullish and bearish commentary became nearly equal. The firm said this kind of sentiment erosion typically indicates weakening trader confidence in an asset’s short-term outlook.
Ethereum’s weak price performance itself has been one of the biggest contributors to the negative mood. Many traders have increasingly viewed ETH as “dead money” compared to assets that have shown stronger momentum during 2026, Santiment said in its latest post.
While Bitcoin has continued attracting institutional confidence and newer ecosystems have drawn speculative interest, Ethereum has struggled to regain the market leadership role it held in previous cycles. ETF flows also added to bearish sentiment. Several Ethereum exchange-traded funds reportedly recorded continued outflows throughout May, including significant withdrawals from BlackRock-related funds.
Santiment added that days with more than $50 million in net inflows, once relatively common for Ethereum ETFs, have not occurred for almost three weeks. Although ETF flows often follow sentiment rather than predict it, retail traders frequently interpret outflows as evidence that institutions are losing confidence in the asset, which further adds to fears already created by falling prices.
Negative headlines surrounding the Ethereum Foundation also contributed to the change in market mood. Reports about researcher departures and ongoing exits from the ecosystem spread widely across social media. Many traders see them as signs of instability within Ethereum’s leadership and development community.
At the same time, viral rumors claiming prominent Ethereum figures, such as David Hoffman, were reducing or exiting their ETH holdings further fueled uncertainty, even when some reports lacked full context. Santiment said such narratives can spread rapidly in crypto markets, especially when traders begin fearing that insiders are abandoning positions before the broader market reacts.
Contrarian Setup?
Competition from other blockchain ecosystems has also intensified pressure on Ethereum’s reputation. Data showed Ethereum still leads the crypto industry in raw development activity, as it generates millions of GitHub events and maintains one of the largest developer communities in the sector.
However, retail traders have increasingly prioritized short-term price performance over long-term development strength, while ecosystems such as Solana and BNB Chain continue to attract speculative enthusiasm. On-chain activity has weakened as well, with both daily active addresses and network growth declining from the high levels seen during Ethereum’s strongest rallies in 2024 and 2025.
Despite the overwhelmingly bearish environment, the firm said extreme pessimism can sometimes point to exhaustion among traders and potentially emerge near major market turning points.
“Growing bearishness may eventually become constructive from a contrarian perspective. Historically, markets tend to punish the crowd when consensus becomes too one-sided. Ethereum is now reaching a point where social media discussion has become overwhelmingly focused on reasons to abandon the asset. “
Bitcoin’s latest retreat below $80,000 shows how quickly the bond market has reclaimed control of crypto trading, even after lawmakers advanced one of the industry’s most closely watched regulatory bills.
Data from CryptoSlate showed that the top asset was trading at $79,083 as of press time, down more than 3% after another failed attempt to hold above $82,000.
Blockchain analytical firm Santiment attributed the reversal to a “buy the rumor, sell the news” market reaction to the Senate Banking Committee’s approval of the CLARITY Act. This was a policy milestone that would typically improve sentiment across digital assets by moving market-structure legislation closer to a full Senate vote.
However, the rally attempt faded as traders shifted their focus back to Treasurys.
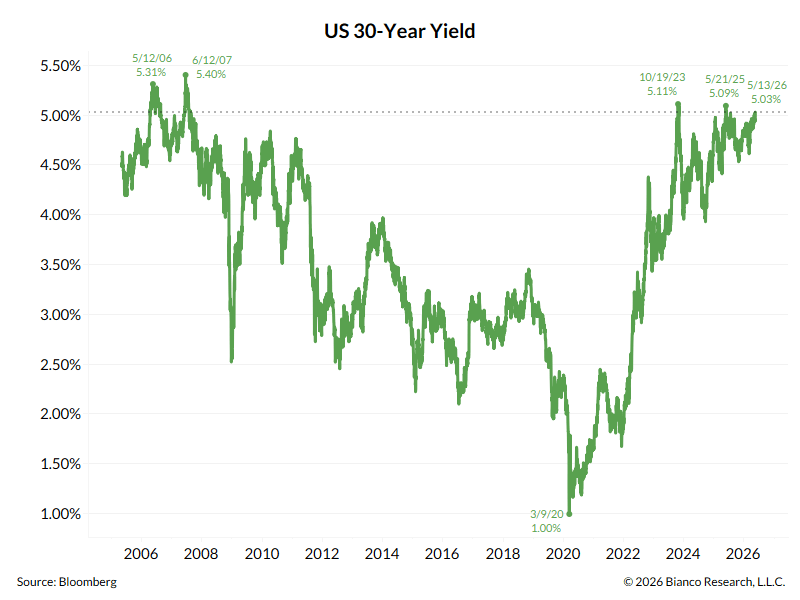
The 10-year Treasury yield moved above 4.5% for the first time since June 2025, while the 30-year yield climbed toward 5.1%. Jim Bianco of Bianco Research said the long bond was only 8 basis points away from a fresh 19-year high.
US 30-Year Yield (Source: Bianco Research)
That move has raised the return threshold for Bitcoin exposure. Higher yields make cash, bills, and longer-dated government debt more competitive, while BTC is trying to recover a key technical level.
Nicolai Sondergaard, a research analyst at Nansen, told CryptoSlate that rising yields are narrowing the compensation investors receive for holding assets such as Bitcoin.
According to him:
“The 10-year Treasury yield pressing toward multi-month highs is compressing the risk premium available to assets like BTC, which remain structurally sensitive to the real rate environment. At current levels, the cost of holding zero-yield assets rises meaningfully when alternatives offer 4.5% risk-free.”
The result is a market where crypto-specific progress is no longer enough to carry price action on its own. Washington has improved the industry’s policy outlook, but the rates market is setting the near-term allocation decision.
ETF outflows show where the rate pressure is landing
SoSoValue data show the funds were on pace for more than $700 million in weekly outflows, the largest weekly retreat since late January. The pullback removes a key source of spot demand as Bitcoin tries to reclaim the $82,000 area and move back above its 200-day moving average.
The ETF channel has become central to Bitcoin’s market structure since the funds began trading, providing institutions with a regulated, liquid way to add exposure. When those flows weaken, the spot market loses one of the clearest sources of marginal demand.
Lacie Zhang, a research analyst at Bitget Wallet, told CryptoSlate that higher yields have made institutional buyers more selective because government debt now offers a stronger return profile.
She said:
“Rising US Treasury yields are acting as a clear macro headwind for Bitcoin. As yields move higher, the relative appeal of government debt improves, raising the opportunity cost of holding a volatile, non-yielding asset like BTC.”
Moreover, the weaker ETF picture is being reinforced by on-chain spot-flow data.
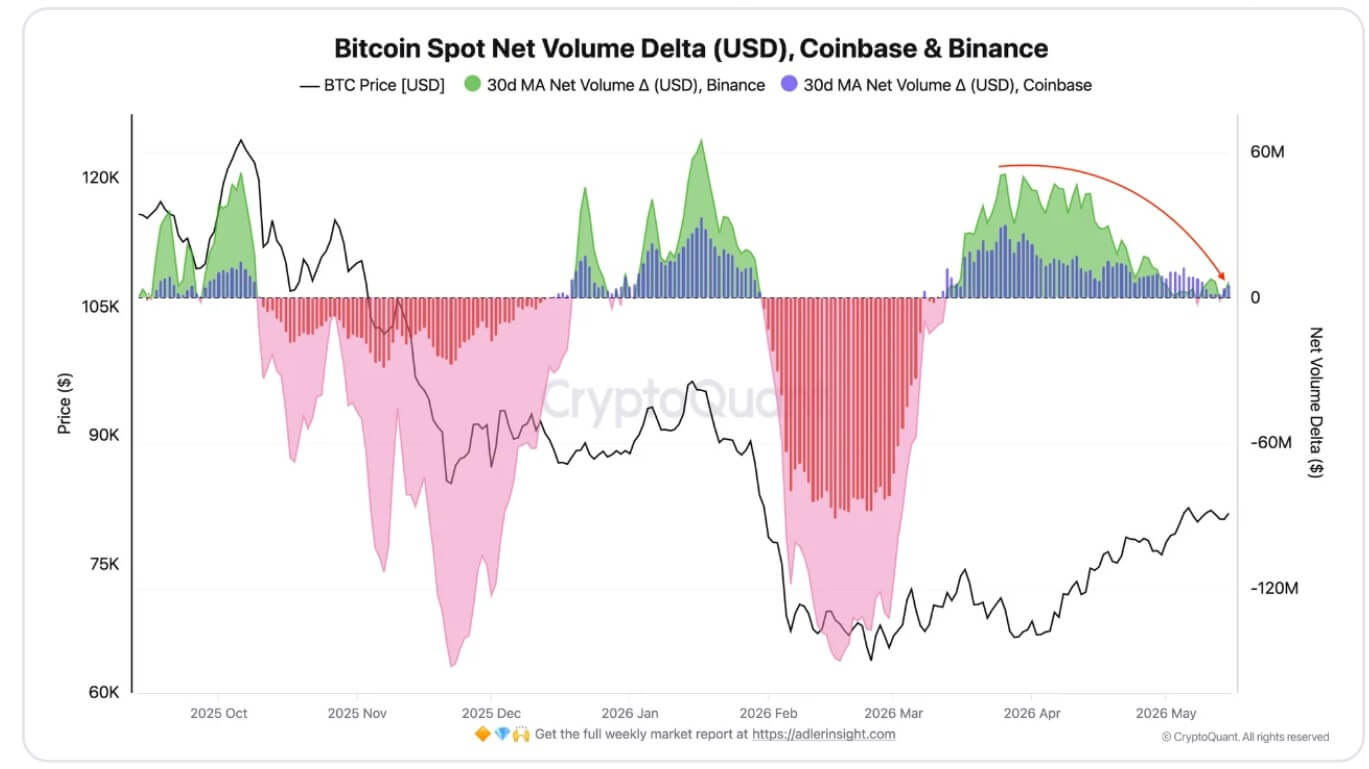
CryptoQuant data show that Cumulative Volume Delta has deteriorated across major venues after stronger readings in March. According to the firm, monthly averages of $50 million on Binance and $30 million on Coinbase have slipped to about $6.5 million and $5.7 million, respectively.
Bitcoin Spot Net Volume Delta on Binance and Coinbase (Source: CryptoQuant)
The indicator also briefly turned negative on May 8, pointing to a weaker balance between buyers and sellers. That leaves Bitcoin trading around a major pivot zone, with thinner spot support than during the earlier phase of the rally.
Moreover, the macro backdrop has also become less supportive for risk assets. The unresolved conflict between Iran and the US has added uncertainty around growth and inflation, even after President Donald Trump initially suggested the conflict would last only a few weeks.
Bitcoin’s hedge case remains longer term
Despite this current market situation, the broader investment argument for Bitcoin has not disappeared.
Analysts at Bitunix told CryptoSlate that while the higher treasury yields can pressure BTC in the short term by draining liquidity and reducing speculative appetite, the same forces could strengthen the case for scarce, non-sovereign assets.
According to the firm, if investors are demanding greater compensation for US deficits, debt issuance, and inflation risk, Bitcoin’s fixed supply could continue to attract buyers looking for an asset outside the sovereign credit system.
However, that argument is more likely to influence long-term strategic allocation than short-term positioning.
For now, Bitcoin appears dependent on two catalysts: a retreat in Treasury yields or a recovery in ETF inflows strong enough to absorb the rate shock.
Without either, price action could remain boxed between support in the upper $70,000s and resistance near $82,000.
Stablecoins and tokenized Treasurys draw cautious capital
In light of the current rate environment, crypto traders are repositioning their capital in the market.
Nansen’s Sondergaard said smart-money wallets have moved incrementally toward stablecoins over the past two weeks, showing a preference for flexibility over directional exposure.
This shift points to caution rather than a full exit from the market as the traders seek fresh market catalysts for their trades.
Marcin Kazmierczak, co-founder of RedStone, told CryptoSlate that the risk-free yields above 4% have become a direct competitor to non-yielding assets while strengthening demand for tokenized real-world assets.
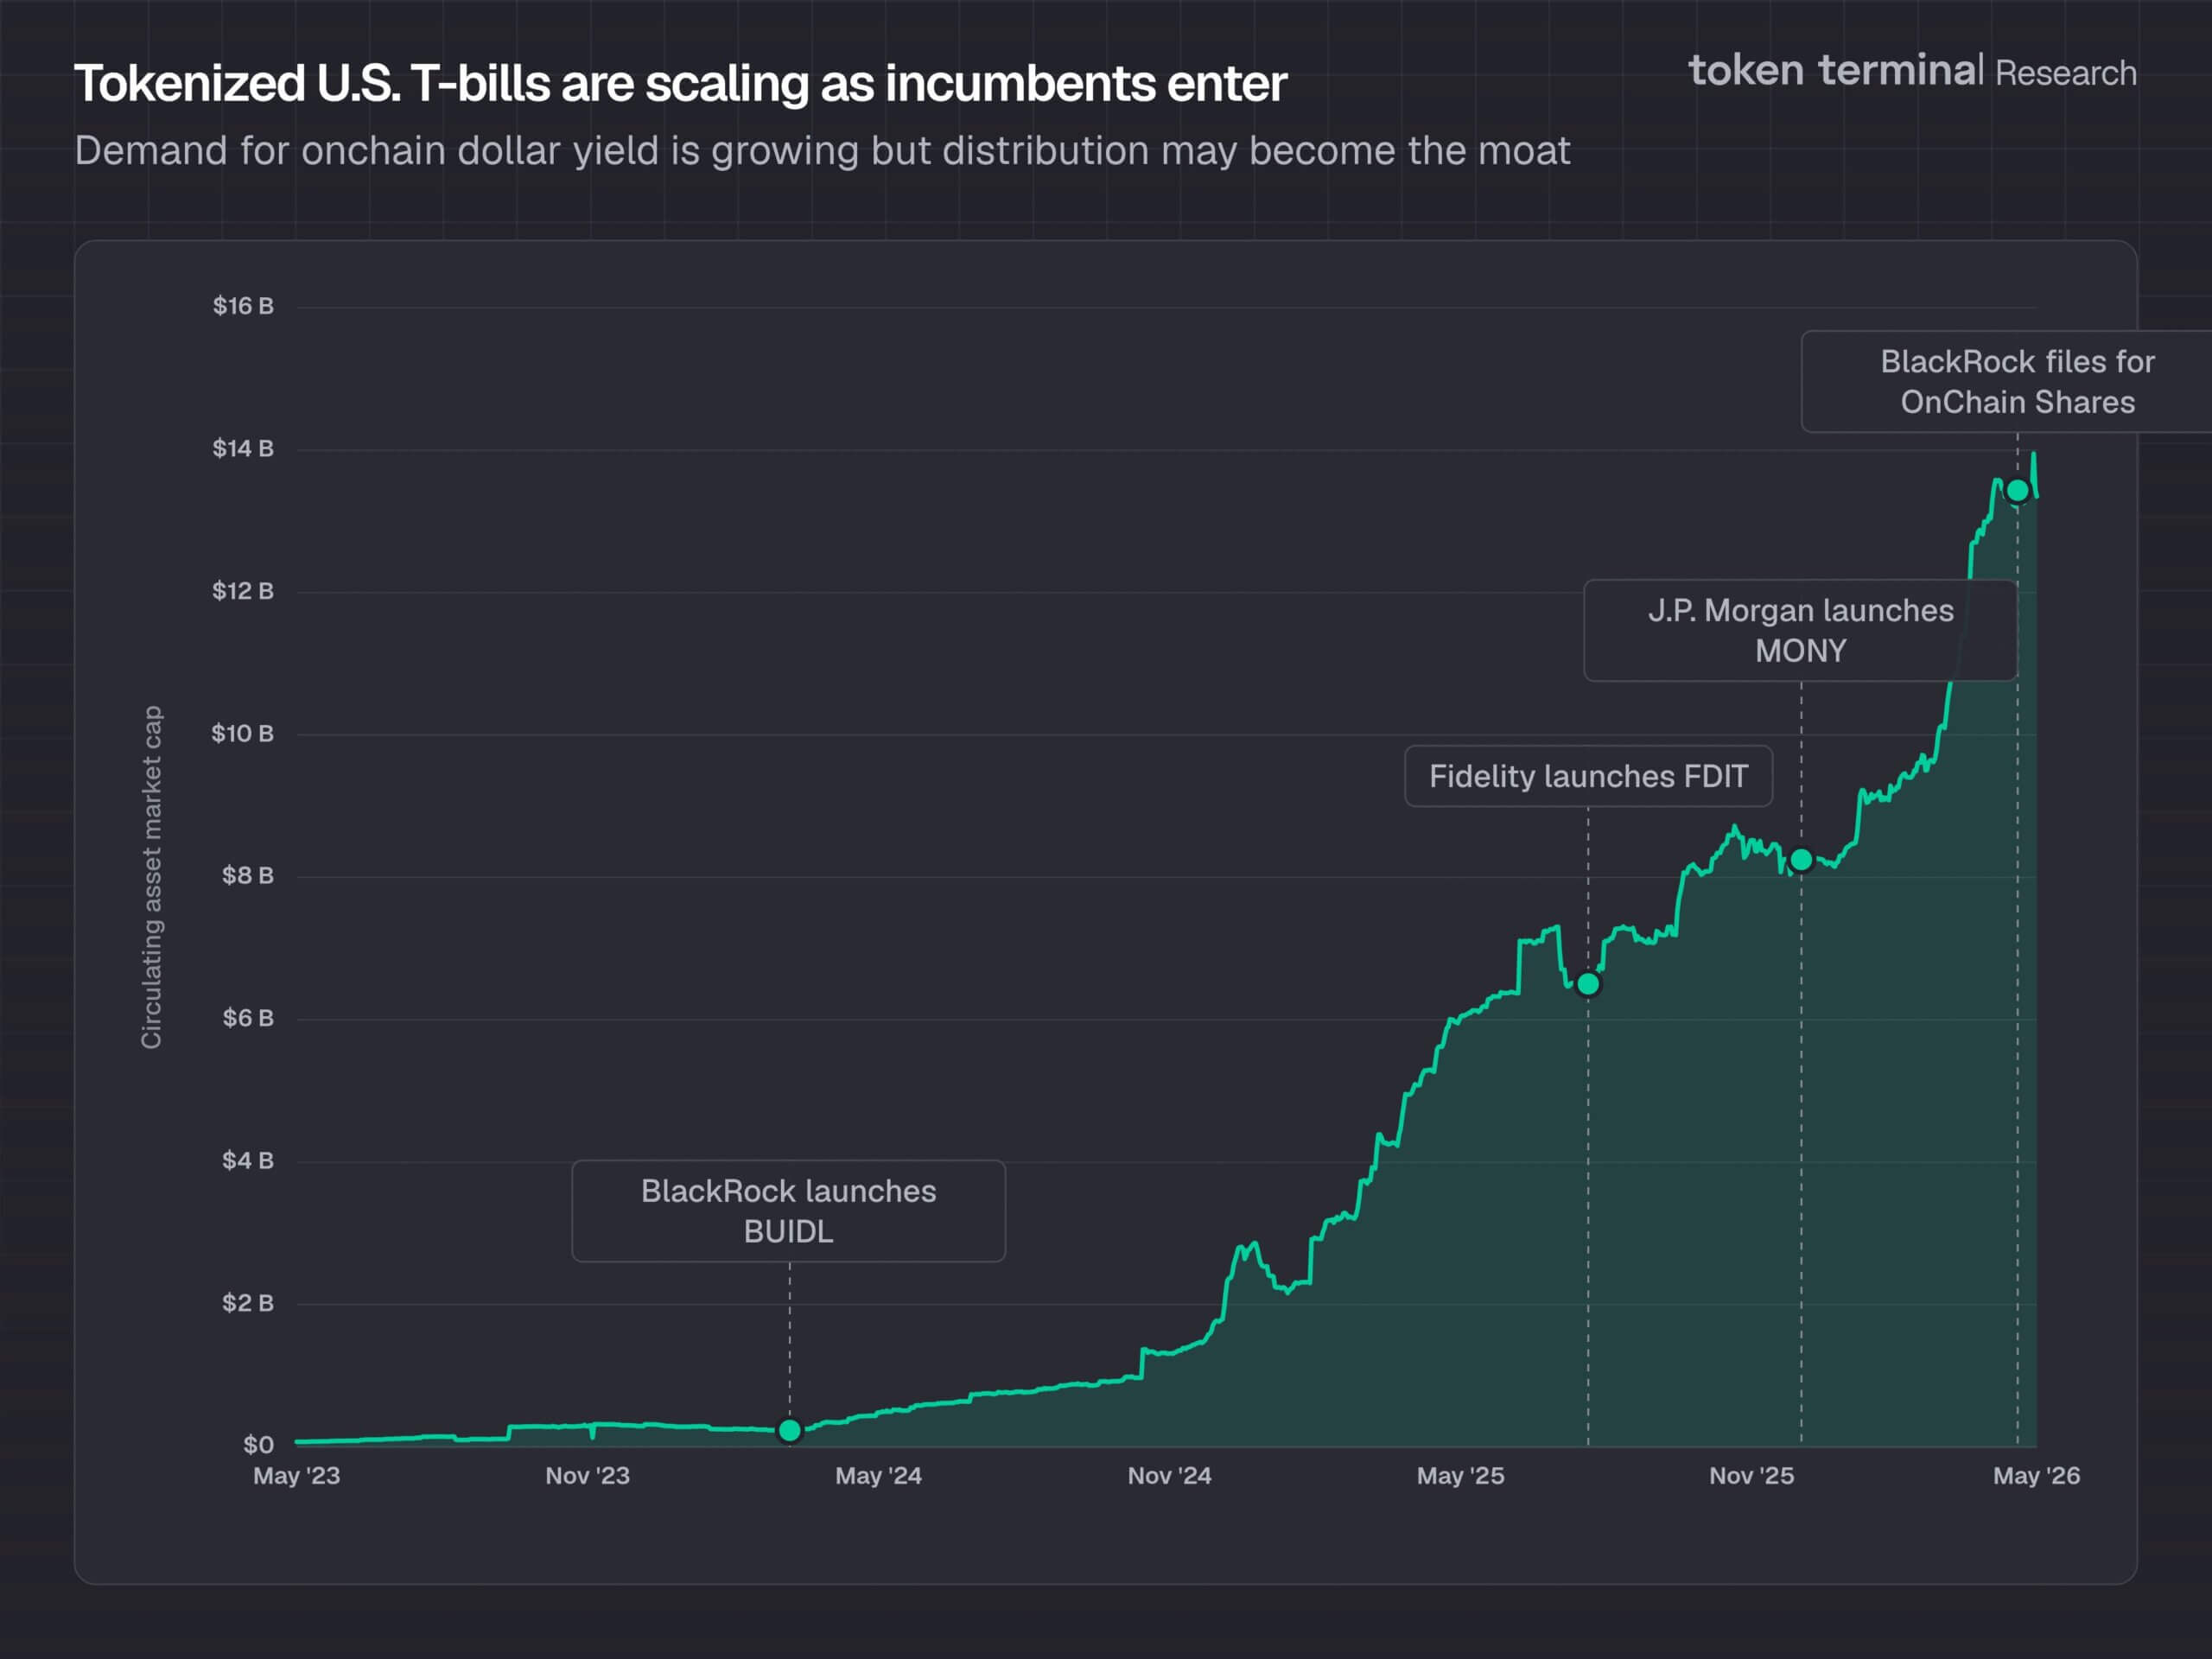
Data from Token Terminal shows that tokenized US Treasurys have reached a record high of $15.35 billion in value, up from about $8.9 billion at the start of the year. This represents a 70% growth in under five months.
US Tokenized Treasury (Source: Token Terminal)
According to Kazmierczak, that growth shows capital is still moving through blockchain rails, but with a stronger preference for products tied to short-duration government debt. He added:
“BlackRock BUIDL, VanEck VBILL, Apollo ACRED, Hamilton Lane SCOPE, Franklin Templeton BENJI are all live in production today. Institutions get 4%+ yield with 24/7 settlement, programmable collateral, and composability with DeFi.”
This shift gives the current market cycle a different shape from earlier rate shocks.
Now, Bitcoin is absorbing pressure from a stronger bond market, while another corner of the crypto industry is expanding because that same bond market now offers yield worth tokenizing.
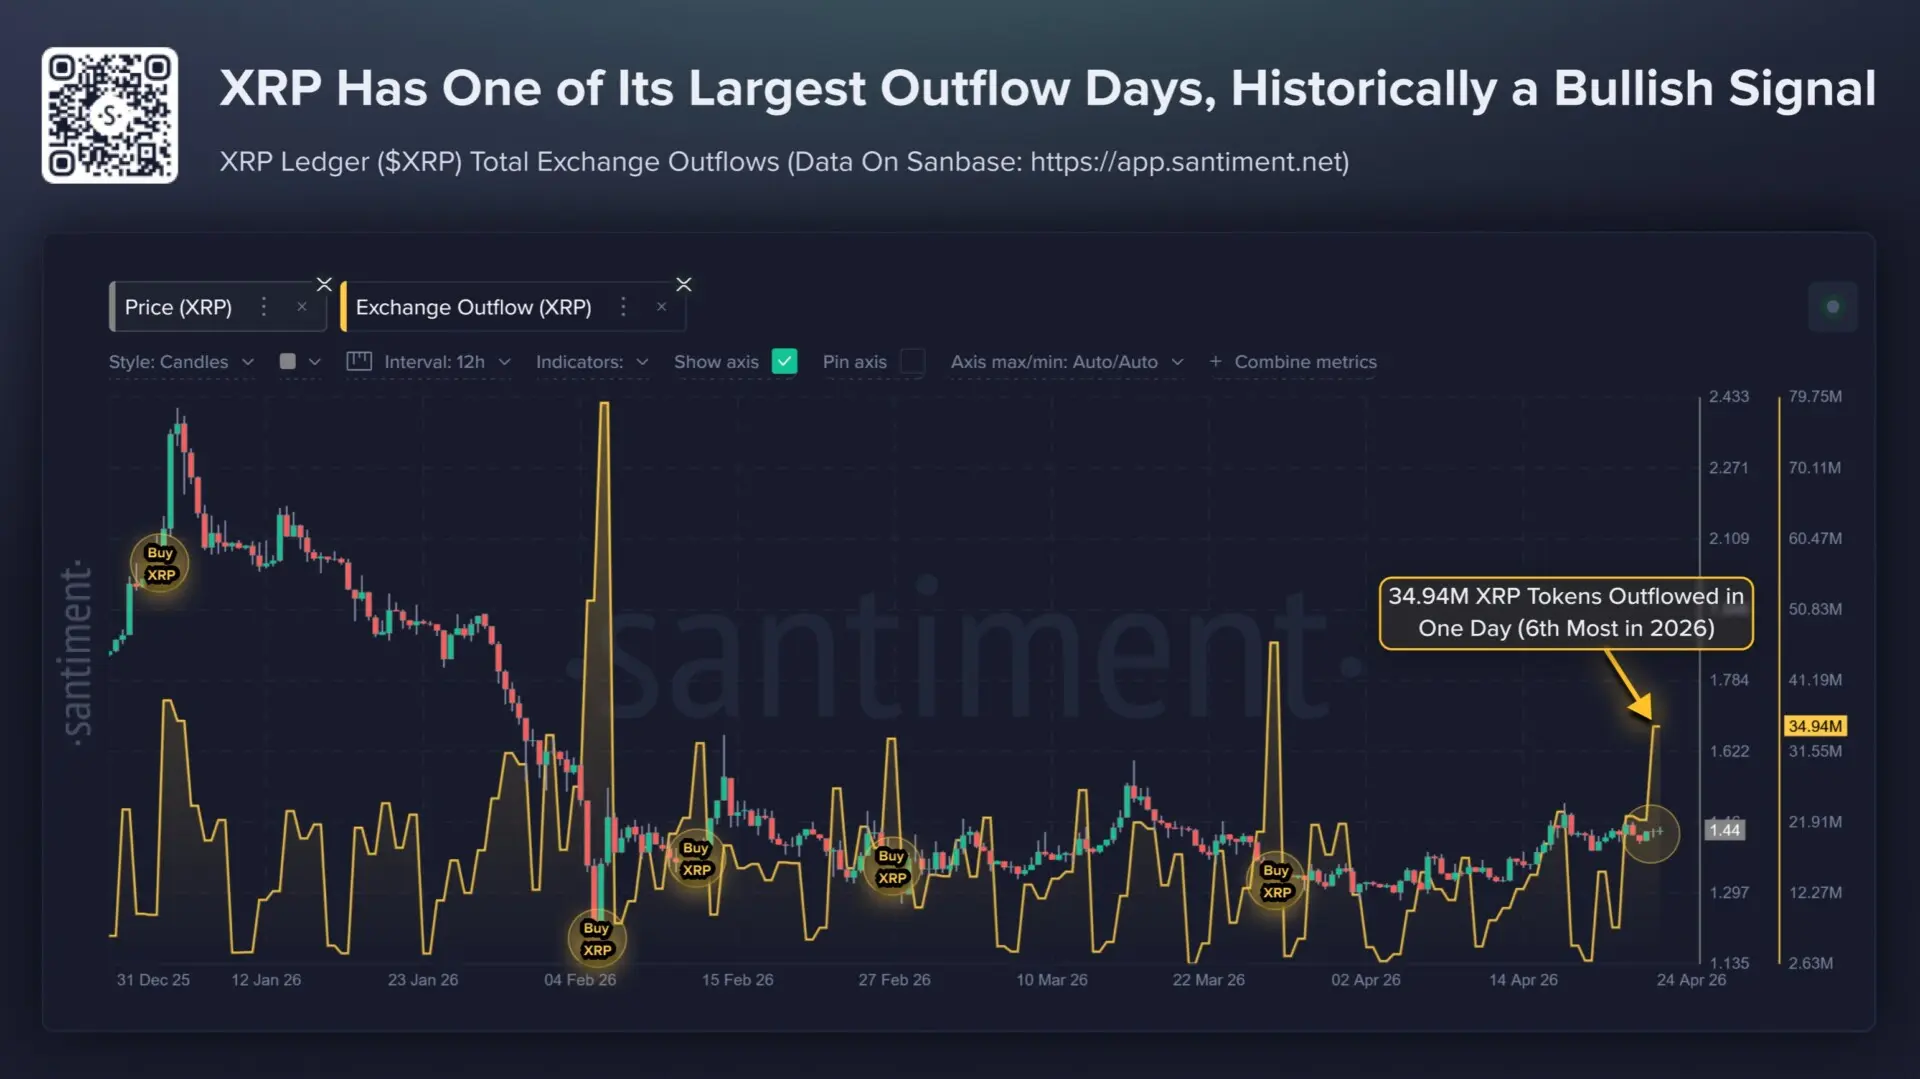
On April 24, 2026, an incredible 34.94 million XRP in net exchanges left the XRP Ledger—marking the sixth-highest daily amount of the year. The blockchain transaction data, analyzed via market intelligence firm Santiment, has once again sparked optimism in the crypto markets.
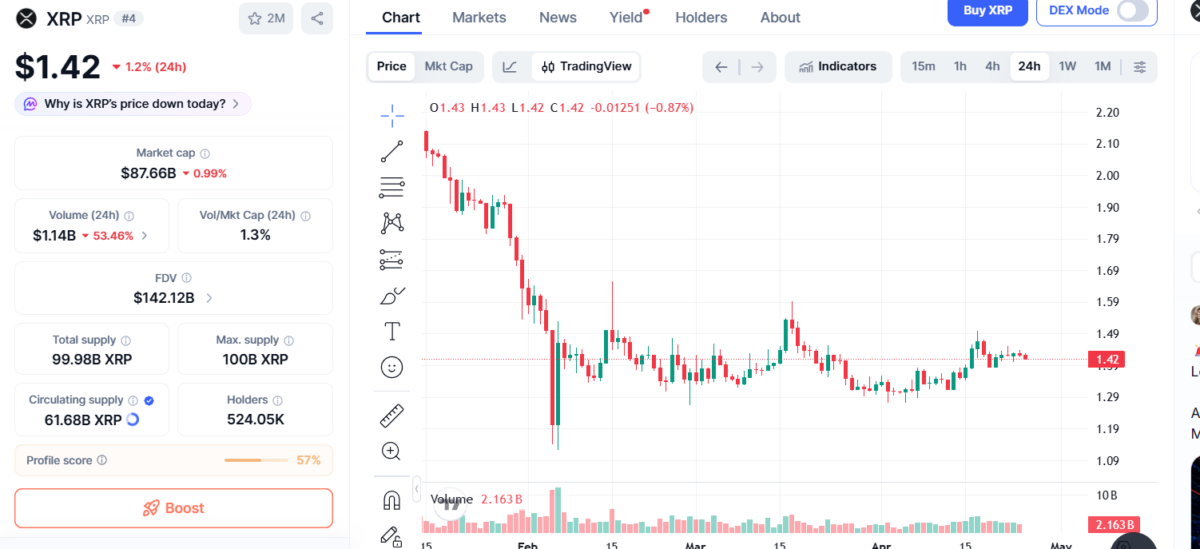
XRP, currently at $1.43 and holding steady despite gaining over 30% in the last three months, could rally another 30% to $1.87-$1.89 before June.
XRP records the highest outflows in a day. Source: Santiment
According to Santiment, 34.94 million XRP were moved off centralized exchanges over the past 24 hours. This marks the sixth-highest amount of money moved outside in a day in 2026. The move indicates that users prefer transferring their funds to personal wallets rather than keeping them on sale-ready exchanges.
XRP’s record exchange outflows reduce sell pressure
According to Santiment, past cases show that uptrends have followed such large outflow days. This comes as XRP continues to hold its recovery path, hovering around $1.43 amid a marginal 0.77% gain.
Outflows from exchanges tend to reduce selling pressure because tokens that are not on the exchange are unlikely to reach the market soon.
A rising institutional appetite also backs the bullish narrative for the asset. Spot XRP ETFs in the United States recorded net inflows of $82.88 million over three consecutive weeks, bringing total AUM to $1.1 billion. This continuous flow of capital into the asset denotes rising optimism among traditional finance entities.
XRP price movements. Source: CoinMarketCap
Moreover, on-chain whale metrics have also contributed positively towards the optimistic sentiment. The 90-day moving average of XRP whales has transitioned from the negative zone at the beginning of 2026 to the positive side, suggesting that large holders have been accumulating the asset.
Technical setup supports a 30% bull rally
The daily XRP chart demonstrates a falling wedge pattern that has been in existence for about five years. It continues to be the dominant force behind the direction of the price movement. The crypto has just touched the bottom trendline of the falling wedge pattern.
In case of a bullish breakout above the rising upper trendline, XRP will likely aim for the $1.87-$1.89 levels marked by the 50-week exponential moving average and 0.5 Fibonacci retracement, respectively – representing a 30% increase, consistent with the overall three-month upward trend where XRP has already managed to add over 30%.
Should the current dynamics remain intact, the end-of-the-wedge resolution may occur in June. Otherwise, its breakdown below the support trendline could send XRP to $0.98, marking the wedge apex and the 0.786 Fibonacci retracement point.
XRP’s broader market context
XRP has formed a symmetrical triangle since early April, with each peak getting lower and each trough getting higher, leading to a tightening of the price range. These “coiling” patterns have been known to precede explosive breakouts when the compression releases.
A favorable macro environment supports XRP’s technicals. Bitcoin appears poised for its best monthly performance since last year, holding above $77,000 and posting gains of more than 13% in April.
In addition, the market has seen an increase in stablecoins, specifically Tether’s USDT, which now sits at almost $150 billion. Market players have characterized the prevailing condition as being more of a coiled spring waiting for its spark rather than a situation of uncertainty.
Although selling pressure remains strong, shallow pullbacks, institutional buying, and limited exchange float have maintained the upside bias—as long as $1.39 holds.


 Reached Peak Pessimism: Or Is More Pain Coming?")