Hyperliquid (HYPE) recently broke into the top 10 cryptocurrencies by market capitalization, sitting alongside top players like Bitcoin (BTC) and Ethereum (ETH), after its price surged past $50 and set a new all-time high. Now, on-chain analytics platforms are showing what HYPE’s ultimate price could become if it surpasses Ethereum’s market cap.
Hyperliquid’s ATH Price If It Surpasses Ethereum’s Market Cap
Hyperliquid skyrocketed past $50 a few days ago, surpassing Dogecoin’s ranking to take the 9th spot as one of the largest cryptocurrencies in terms of market capitalization. The move marks the first time the token has traded above this zone since late October 2025.
Currently, HYPE has extended its rally well beyond $60. The breakout reflects a strong shift in trading activity around the token, as well as renewed interest and confidence in DeFi protocols and AI-backed tokens. HYPE’s move back into this historic price range also suggests that traders and investors are once again engaging more actively with Hyperliquid’s perpetual futures DEX.
Interestingly, the recent rally in the HYPE price has brought renewed focus on Ethereum, one of Hyperliquid’s biggest crypto and DeFi rivals. While Ethereum remains a dominant benchmark for decentralized applications, Hyperliquid is designed specifically for financial trading and derivatives.
Nevertheless, data from Marketcapof has revealed how high HYPE’s price could reach if its market capitalization of $15.99 billion surpasses Ethereum’s, which is around $250.99 billion. Projections indicate the token could move well beyond its previous all-time high, potentially reaching approximately $1,127, marking a 17.92x from present levels.
At more extreme ATH levels, where market euphoria is likely at its peak, estimates place HYPE as high as $2,633. This would represent a gain of about 42x from current prices, underscoring the scale of the cryptocurrency’s potential upside.
Competition Intensifies As HYPE Captures More ETF Inflows Than ETH
Before recording an ATH, Hyperliquid has been strengthening its market position as capital continues to rotate away from major legacy assets like Bitcoin and Ethereum toward newer, high-growth protocols. HYPE’s recent performance reflects both rising adoption of its DEX platform and a broader shift in liquidity across the crypto sector.
A key driver behind the bullish momentum was the launch of spot HYPE ETFs by investment management firms Bitwise and 21Shares in May. The products have attracted millions of dollars in inflows, underscoring steady institutional demand for HYPE amid heightened derivatives activity.
Earlier in the year, market volatility linked to the US-Iran war triggered record perpetual futures volume on Hyperliquid, pushing activity on the platform to new highs. Liquidity conditions also improved after Coinbase, the world’s largest crypto exchange, became the official USDC provider on Hyperliquid.
Against this backdrop, Ethereum dominance is waning significantly. The cryptocurrency’s price has struggled to maintain momentum, falling roughly 30% year-to-date. ETF flow data reflects this shift, with about $1 billion exiting Bitcoin and Ethereum products while XRP and HYPE funds recorded about $94 million in combined inflows.
Bankless co-founder David Hoffman said he sold his Ether holdings because he believes the long-standing “ETH is money” thesis has already largely played out. Despite this, he remains strongly bullish on Ethereum as a network.
According to Hoffman, the decision did not come lightly, given that he built his career, business, community, and identity around Ethereum.
Ethereum Chose the Hard Path Unlike Bitcoin
In his latest tweet, Hoffman stated that the “ETH is money” thesis depended on Ethereum succeeding across multiple layers of coordination, including decentralized leadership, governance, Layer 2 ecosystems, roadmap execution, and technological development.
Hoffman described Ethereum as “not Bitcoin,” and said that Bitcoin simplified its blockchain to maximize the value of BTC, while Ethereum pursued a more ambitious path by expanding utility across decentralized applications, finance, tokenization, and infrastructure. He even went on to add that Ethereum achieved part of that vision and earned the market capitalization it currently has, but said the opportunity for ETH to be significantly rerated higher by the market now appears to be closing.
The Bankless co-founder also explained that the broader “strong version” of crypto, which focused on decentralized finance, NFTs, DAOs, and crypto-native systems, failed to maintain long-term mainstream support outside the 2020 to 2022 period. He said crypto’s reputation later became associated with scams, grifts, and speculative behavior, which ended up weakening the social belief system required for ETH to function as money at a global scale.
He further stated that Ether’s utility increasingly benefits other forms of money, especially stablecoins and tokenized dollars, rather than ETH itself. Hoffman described Ethereum as a “giver, not a taker,” while saying that the network provides secure blockspace, tokenization infrastructure, and DeFi support at minimal cost rather than extracting maximum value for ETH holders. He said Ethereum’s architecture prioritizes applications, rollups, and ecosystem growth over ETH itself, which makes it difficult for the underlying crypto asset to fully achieve global money status without overwhelming market dominance.
Ethereum in Crisis?
Hoffman’s decision also comes at a time when bearish sentiment around Ethereum has been intensifying. A recent report by Santiment found that social media discussions have increasingly shifted from optimism toward frustration and concerns about further downside.
The analytics firm said traders have increasingly viewed ETH as “dead money” compared to stronger-performing crypto assets in 2026, as weakening ETF flows, declining on-chain activity, and growing competition from ecosystems such as Solana and BNB Chain added pressure on sentiment.
Rumors about prominent Ethereum figures reducing or exiting ETH positions, including discussions surrounding Hoffman, have also contributed to rising uncertainty in the market, especially as traders worried about insiders losing confidence in the asset.
Tuesday turned ugly for crypto markets, with a broad wave of selling hitting altcoins across the board, led by Zcash (ZEC), which dropped 11%, World Liberty Financial’s WLFI, which was down 8%, and Ondo Finance (ONDO), falling 7%.
The losses came against a backdrop of rising bearish sentiment in the crowd, which, according to blockchain analytics firm Santiment, has historically happened right before prices rebounded.
Details of the Sell-Off
Santiment flagged the damage in a post on X earlier today, noting drops in Ondo, Zcash, WLFI, and DeXe, among others.
For Ondo, the timing was particularly grim, seeing as the dip came right on the heels of the passing of 32-year-old founder and CEO Nathan Allman. The company announced that longtime President Ian De Bode will take over as CEO. The token is now trading near $0.41, putting its performance in the last seven days up by roughly 9%.
Zcash’s 11% single-day drop was the sharpest among the named losers, although at the time of writing the decline was at about 7.5% in the last 24 hours, with ZEC trading at around $570. For context, the asset is up 60% over the past month and nearly 970% across the last year, so the daily move looks less alarming against that backdrop.
Meanwhile, WLFI’s 8% dip added to a difficult stretch for the token, which hit a new all-time low in late April after crashing 16% in one day. It has had to navigate a controversial lock-up proposal, a lawsuit by Tron’s Justin Sun, and continued scrutiny over ties to the Trump family.
It Wasn’t All Red
Despite the losses mentioned above, the weekly picture looked different for some tokens. For example, NEAR was up more than 55% over seven days, and it was changing hands around the $2.50 level, although it pulled back nearly 8% on Tuesday alone. Another gainer was Hyperliquid’s HYPE token, which went up 25% per Santiment’s data.
However, the week’s standout was RAIN, which hit an all-time high of around $0.012 on Tuesday after climbing almost 55% for the week and over 44% in the last 24 hours alone.
Separate data from Santiment posted on the same day showed that bearish crowd expectations have been building for about 10 days now, with the firm noting that this kind of collective lean toward caution has historically heralded price recoveries, considering that markets tend to move against the crowd’s prevailing mood.
But traders will have to wait and see whether that plays out this time, especially with Bitcoin still stuck below $77,000 and struggling to break above its descending 200-day moving average near $80,000.
The XRP Ledger is moving through another important update process, and this one is not only about adding new features. Version 3.2.0 is now in development, according to XRPL validator Vet, who said the update is meant to further strengthen the foundation that XRP runs on.
The upcoming XRP Ledger update is less about short-term price hype and more about what it says about the network’s direction, following the recent activation of version 3.1.3 in early May.
XRP Ledger Version 3.2.0 Is Coming
XRP Ledger version 3.1.3 is now active, and attention has now moved to what comes next for the network. Hussein Zangana, Director of Community at the XRP Ledger Foundation, known on X as Vet, confirmed that version 3.2.0 is currently in development, describing it as an update to further strengthen the foundation on which the XRP Ledger is built.
According to Vet, update 3.2.0 is in development to further strengthen the foundation XRP is living on. He specifically mentioned AI-powered red team and blue team work, alongside attackathons and bug bounties, saying these efforts have delivered strong results. Update 3.2.0 may not be the update that introduces the loudest feature, but it appears to be part of the work needed to make the ledger safer for deeper financial activity.
Speaking of updates that introduce features, the incoming upgrade follows the May 8 release of XRP Ledger version 3.1.3. According to the official XRPL blog, version 3.1.3 introduced the fixCleanup3_1_3 amendment, which included fixes for NFTs, Permissioned Domains, Vaults, and the Lending Protocol. The release set the default vote to Yes because of the importance of the fixes.
That update is important because it came soon after version 3.1.0 introduced Single Asset Vaults and the Lending Protocol in January. The official XRPL release notes described Single Asset Vaults as pools of a single asset for use with the Lending Protocol, which is a system that allows fixed-term, uncollateralized loans using pooled funds from those vaults.
How The New Update Affects XRP Holders
There’s currently no timeline as to when version 3.2.0 will be released, but the update should be viewed as an infrastructure update that might not really have an effect on the price action. Still, these updates affect the long-term holder case in major ways. For one, an ecosystem with steady major updates shows an active community, which in turn can support confidence around XRP’s price action over time.
Version 3.1.3 has already shown that XRPL developers are cleaning up the newer parts of the protocol, especially around NFTs, Vaults, Permissioned Domains, and Lending. Version 3.2.0 now appears to push that work further by strengthening the foundation of the XRP Ledger.
Socket’s May 24 disclosure of TrapDoor found more than 34 malicious packages and over 384 related versions spread across npm, PyPI, and Crates.io, each targeting the developers who build and maintain protocols, and the credentials that govern access to the systems around them.
What TrapDoor built is a route from a single developer’s compromised machine into the repositories, CI/CD pipelines, cloud accounts, and deployment keys that govern how protocols reach mainnet and stay updated once deployed.
Socket’s report confirms credential theft and infrastructure exposure as the campaign’s documented scope, leaving on-chain exploits as the inferred downstream consequence.
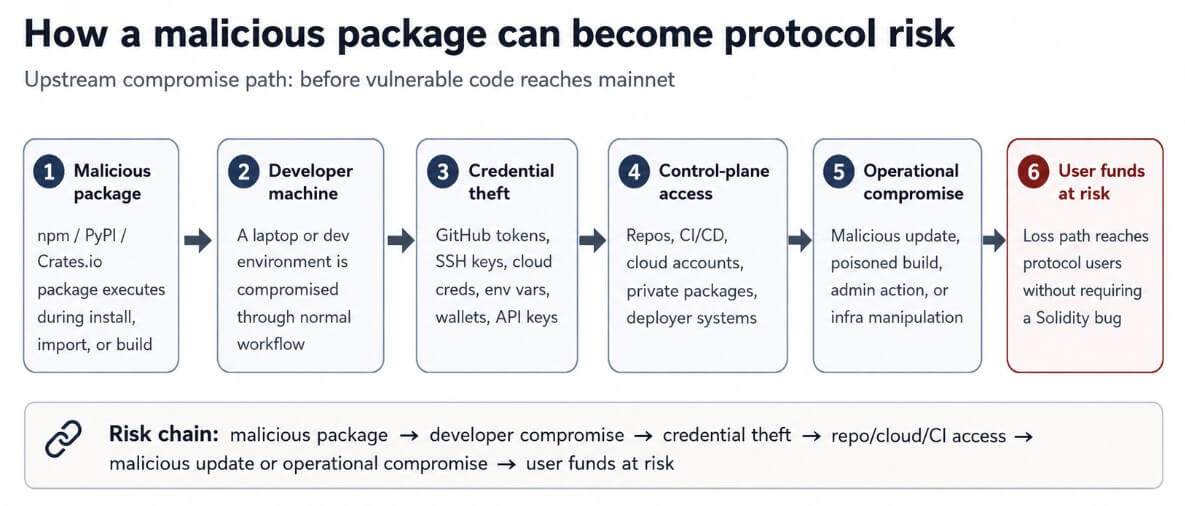
A six-stage flowchart shows how a malicious package moves from developer machine compromise through credential theft to put user funds at risk.
The attack surface developers don’t audit
The campaign delivered payloads through ordinary developer workflows, such as npm packages executing malicious code through postinstall hooks, PyPI packages triggering payloads on import while fetching remote JavaScript, and Rust crates running build.rs scripts during compilation.
Normal developer behavior is the attack surface, as none of these execution paths requires anything beyond a package install, an import, or a build command.
In the environment around a live protocol, any one of those credential classes can represent a path to user funds that no smart contract audit ever examines.
Socket explicitly framed stolen SSH keys as enabling lateral movement, and cloud and GitHub credentials as exposing repositories, CI/CD systems, private packages, and deployment environments.
That chain, comprising malicious package, developer compromise, credential theft, repo and cloud access, and malicious update, describes how a DeFi exploit can arise without a single line of vulnerable Solidity.
The AI instruction injection
Socket found the TrapDoor campaign attempted to plant hidden instructions inside files such as .cursorrules and CLAUDE.md, which are configuration files that AI coding assistants like Cursor and Claude Code read to understand how to behave within a project.
The injected instructions employed hidden Unicode techniques to steer AI-assisted workflows toward secret discovery and exfiltration.
Socket also found pull requests submitted to AI and developer tooling projects that tried to introduce instruction files under benign-sounding labels.
The target was the AI assistant that reads the repo, generates code, and operates with whatever context the project files supply.
If attackers silently manipulate that context through hidden Unicode instructions, the AI-assisted workflow becomes an exfiltration mechanism.
A broader pattern
SafeDep documented a May 11 campaign that compromised more than 170 npm packages and two PyPI packages, hitting 404 malicious versions tied to TanStack, Mistral SDK, UiPath, OpenSearch, and Guardrails AI.
StepSecurity described five major supply-chain attacks in 48 hours across VS Code extensions, GitHub Actions, npm, and PyPI, including a poisoned VS Code extension with 2.2 million installs and trojanized Microsoft PyPI packages.
Sonatype reported more than 454,600 new malicious packages in 2025, bringing the cumulative count to above 1.233 million, with malicious packages now serving as entry points for broader intrusions.
Campaign / source
Timing
Ecosystem affected
Scale cited
Why it matters for this story
TrapDoor / Socket
May 2026
npm, PyPI, Crates.io
34+ malicious packages; 384+ versions/artifacts
Shows crypto developers being targeted before code reaches mainnet
Shows malicious packages spreading through mainstream developer dependencies
StepSecurity 48-hour wave
May 2026
VS Code, GitHub Actions, npm, PyPI
5 major attacks; one VS Code extension had 2.2M installs
Shows attackers moving across multiple layers of developer tooling
Sonatype 2025 data
2025
Major open-source ecosystems
454,600+ new malicious packages; 1.233M+ cumulative
Shows malicious packages becoming an industrialized intrusion channel
The control-plane attack pattern has already resulted in measurable DeFi losses using structurally identical methods.
Resolv’s March incident was a $23 million exploit where the deployed code worked exactly as designed, but off-chain infrastructure and trusted keys failed.
In April 2026, Drift lost $285 million when attackers combined long-running social engineering with valid admin signatures.
KelpDAO lost approximately $292 million the same month when attackers compromised off-chain RPC and DVN infrastructure.
In each case, the failure point was operational: trusted infrastructure, off-chain systems, and admin access layers surrounding the contract.
Where the risk resolves
If TrapDoor-style packages draw quick detection, since Socket’s system logged average detection at 5 minutes and 56 seconds, and teams rotate exposed credentials before downstream access occurs, the campaign ends at the detection layer, with its damage limited to credentials that teams can still rotate.
DeFi losses track near the 2025 Immunefi baseline of $680 million, with TrapDoor’s primary effect being accelerated security reviews of package dependencies, CI/CD secrets, and developer environment hygiene across crypto teams.
The bear case draws on data from Chainalysis, TRM Labs, and Immunefi, measured in 2025 and early 2026.
TRM Labs estimated that North Korean hackers stole approximately $577 million through April 2026, accounting for 76% of all crypto losses during that period. Chainalysis put total crypto service theft at more than $3.4 billion in 2025, with the top three incidents accounting for 69% of that figure.
A TrapDoor-type upstream compromise reaching deployer keys, bridge validator infrastructure, or admin credentials at a mid-to-large protocol could add $100 million to $300 million to 2026’s running total, pushing annual DeFi losses toward $1 billion or above.
One infected developer machine with a GitHub token controlling a deployment pipeline, a cloud credential managing bridge infrastructure, or a wallet key holding protocol admin authority can reach far more than the developer’s own funds.
In the Drift incident, attackers drained assets including cbBTC and WBTC, showing that Bitcoin-linked liquidity wrapped or bridged into DeFi sits inside the same operational infrastructure that TrapDoor targets.
Scenario
What happens
Loss implication
Article takeaway
Contained / bull case
TrapDoor-style packages are detected quickly, exposed credentials are rotated, and no downstream protocol access occurs
DeFi losses remain near the 2025 Immunefi baseline of $680M
Fast detection limits the campaign to credential hygiene and dependency reviews
Annual DeFi losses move above the 2025 baseline but remain below $1B
The exploit surface shifts upstream, but losses stay fragmented
Bear case
One compromised developer machine exposes deployer keys, bridge infrastructure, admin credentials, or repo access at a mid-to-large protocol
One incident adds $100M–$300M, pushing annual DeFi losses toward or above $1B
The next major exploit may begin before vulnerable code is deployed
Black swan
A self-propagating or AI-assisted supply-chain campaign compromises multiple developer environments, packages, or CI/CD systems
Clustered losses approach the scale of major 2025 crypto service theft
DeFi’s control plane becomes the attack surface
What audits don’t reach
The DeFi industry has built a meaningful smart contract security layer over the past four years. Immunefi’s data shows that the median incident size dropped from $6 million in 2022 to $1.5 million in 2025, a sign that core contract-level defenses have matured.
But Resolv, Drift, and KelpDAO show that attackers have absorbed that improvement and moved to systems audits cannot reach, such as deployer permissions, bridge validators, cloud infrastructure, admin keys, off-chain RPC endpoints, and now the developer machines, package dependencies, and AI coding environments that produce and configure all of the above.
A smart contract can pass every audit a protocol commissions and still sit atop a deployment pipeline where a post-install hook has already exfiltrated the deployer’s GitHub token.
TrapDoor is a specific campaign with a specific package count and a detection timestamp. The attack surface it targeted, consisting of developer machines, package registries, CI/CD credentials, AI coding files, and cloud accounts, persists beyond TrapDoor’s own package list.
Other campaigns are already using the same pathways, and the next DeFi exploit may begin on a developer’s laptop, inside a build script, or within an AI coding environment.
Huawei has achieved a breakthrough in building advanced chips in half a decade. The company announced a new technology called LogicFolding, which will allow them to stack computer circuits on top of each other.
This technology will save them from the need to buy machines to make the chips smaller. He Tingbo, who leads Huawei’s chip division, said at a tech conference in Shanghai on Monday that the new 3D design will make their chip reach the performance levels of the best chips in the world.
Washington and Beijing are fighting for control over artificial intelligence. American sanctions have stopped Huawei from getting the tiny chips that power phones, cars, and computers.
The U.S. has also blocked China from buying the software and equipment needed to make these chips. Beijing has spent billions building its own supply chain.
Huawei says its chips will match 1.4-nanometer technology by 2031. Right now, China can only make 7-nanometer chips. TSMC in Taiwan makes chips for Nvidia. It already uses 2-nanometer technology and expects to start making 1.4-nanometer chips in 2028.
China breaks from Moore’s Law with new chip design
The company is also replacing Moore’s Law with Tau Scaling Law. Moore’s law has been employed in the industry by making the transistors smaller. The Tau Scaling Law focuses on the speed of data transfer of the stacked chips.
“The industry will face these problems sooner or later,” He told reporters after her speech. “We have confidence in this path because we have practice as proof.”
People in the Chinese tech industry call her the “chip queen.”
However, the company still has some hurdles. The big challenge is to keep stacked chips from overheating, which current tools can’t protect against.
Costs, power use, heat, and putting everything together are already major hurdles for Chinese technology, according to Brady Wang from Counterpoint Research.
Still on Weibo, Huawei’s breakthrough is being hyped as what DeepSeek offered. Lower costs for the American standard technology. Some are even saying that U.S sanctions have pushed China into “survival mode,” which needed faster innovation.
Huawei also bounced back in 2023 with new phones that had surprisingly good Chinese-made 5G chips. American restrictions are an actual hurdle.
Nvidia CEO Jensen Huang went to China this month with President Donald Trump for talks with Chinese leader Xi Jinping. He told CNBC his company has “largely conceded” the Chinese chip market to Huawei. But he also said China is part of a $200 billion market for Nvidia’s new processors, as reported by Cryptopolitan previously.
American chipmakers bet big on new markets
AMD is putting $10 billion into building infrastructure. Nvidia is changing its business strategy to focus on enterprise customers instead of just big cloud companies. Both moves show American chipmakers are shifting away from China.
A new analysis from Anthropic warns that the next two years will decide whether democratic countries or authoritarian governments control the future of artificial intelligence.
Anthropic is an AI company. The report says democracies now lead in “compute,” which means the advanced chips needed to build the best AI systems. This lead exists because of American innovation and export controls.
But Chinese labs are staying close by, exploiting gaps in U.S. rules. They smuggle chips into China. They use American chips in data centers outside China. They run what Anthropic calls “distillation attacks.” These attacks involve creating fake accounts to copy American AI models. This steals decades of research and billions in investment.
Anthropic describes two possible futures for 2028. In the first, democracies close these loopholes and build a lead of 12 to 24 months in AI capabilities. In the second, China keeps finding ways around the rules and catches up. It then uses AI to expand surveillance and control.
The report says Firefox fixed more security problems last month using Anthropic’s new AI model than it did in all of 2025. A Chinese cybersecurity expert wrote that while China is “still sharpening our swords,” America has “suddenly mounted a fully automatic Gatling gun.”
Chinese state media said after Huawei’s announcement that competition should be “moderate and healthy.” It should help both sides advance. A Foreign Ministry spokesman said Trump and Xi agreed to start government talks on AI during their recent meeting in Beijing.
Anthropic says the decisions policymakers make this year will determine who controls transformative AI technology. It will also determine whether it serves democratic values or enables authoritarianism worldwide.
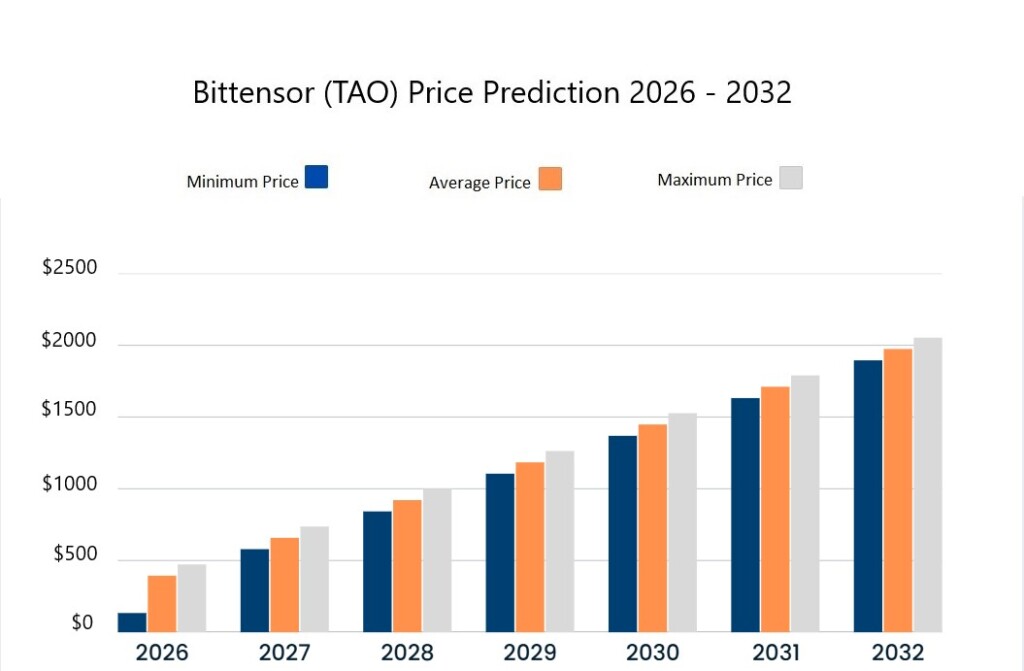
Bittensor price predictions anticipate a high of $473.94 by the end of 2026.
In 2028, TAO will range between $842.56 and $1,000.54, with an average price of $921.55.
In 2032, TAO will range between $1,895.75 and $2,053.73, with an average price of $1,974.74.
Bittensor is one of the most renowned AI-facilitated decentralized networks that promotes blockchain and artificial intelligence infusion. By leveraging Proof of Learning (POL) technology, Bittensor supports user privacy while minimizing errors. The AI models within the network are reliable, flexible, and up-to-date with modern technological advancements. The AI-based Bittensor network prioritizes cross-chain integration and native token expansions to promote collaboration among various decentralized AI networks.
TAO uses reliable authentication methods to ensure a successful transfer of nodes through its AI knowledge to correct models. The process is made possible through the PoL consensus method, which secures this process. Moreover, this technology helps to develop different stages of more advanced AI technology within the blockchain. Bittensor also uses its TAO token to incentivize node operators and AI developers.
What’s next for Bittensor and TAO in 2026 and beyond? Let’s get into the TAO price prediction and technical analysis.
Overview
Cryptocurrency
Bittensor
Ticker
TAO
Current price
$277.96 (+0.71%)
Market cap
$3.04B
Trading volume (24-hour)
$171.08M
Circulating supply
10.93M TAO
All-time low
$30.40 on May 14, 2023
All-time high
$767.68 on Apr 11, 2024
24-hour low
$280.10
24-hour high
$269.05
TAO price prediction: Technical analysis
Metric
Value
Price Volatility (30-day variation)
8.04% (Very High)
14-day RSI
48.47
50-day SMA
$275.59
200-day SMA
$258.86
Market Sentiment
Neutral
Fear and greed index
30 (Fear)
Green days
13/30 (43%)
Bittensor price analysis
TL;DR Breakdown:
TAO price analysis confirms a bullish trend at $277.96.
The altcoin has gained 0.71% over the day.
TAO token has support at $265.
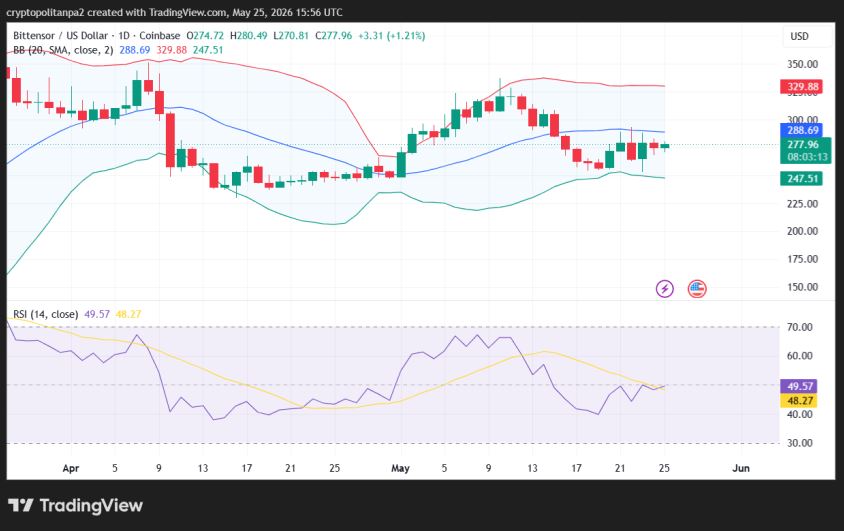
On May 25, 2026, TAO price analysis indicates a mild bullish daily trend, with Bittensor currently trading at $277.96. The altcoin has shown a 0.71% increase in value over the last 24 hours, primarily due to the swift recovery observed over the day, as the token is slipping from sellers’ grip. Buyers remain in control as the TAO price has the nearest support at the $274 level, and it may continue to maintain above the aforementioned level for the coming days.
TAO/USD 1-day chart analysis
The one-day price chart of Bittensor confirmed a bullish trend for the altcoin. The TAO/USD pair value has slightly recovered to $277.96 following a bearish spell. The comparatively high volatility suggests a higher chance of a reversal in the trend or further price appreciation.
The distance between the Bollinger Bands determines the market volatility. Currently, this distance is wide, leading to high volatility levels. Moreover, the upper limit of the Bollinger Bands indicator, indicating resistance, has shifted to $329. Whereby its lower limit, indicating support, has moved to a low of $247.
The Relative Strength Index (RSI) indicator is in the neutral region, in contrast to the other technical factors, which also seem to be bearish. Its curve also increased to 54 during the day. This slowly increasing price movement today reflects a relatively balanced trading setup in the market under the larger bearish trend. However, if the bullish momentum accelerates, the RSI value will move further up into the neutral region.
TAO/USD 4-hour chart analysis
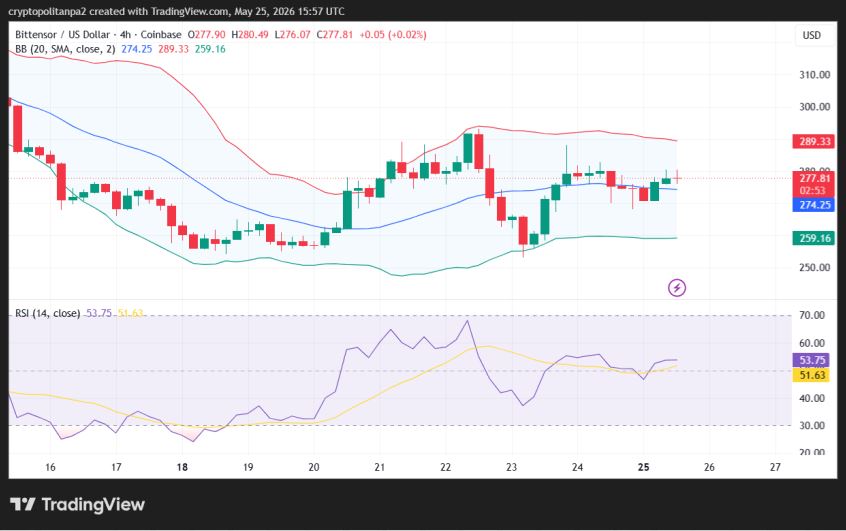
The four-hour price chart for the Bittensor coin signifies a weak bearish trend, as the token’s price movements are again in a downward direction, with sellers trying to control the market. In the past few hours, the cryptocurrency’s value has slightly decreased to $277.81. Red candlesticks on the price chart signal a returning selling pressure.
The Bollinger Bands are expanding, as the volatility level is high on the 4-hour chart. The high volatility suggests higher market unpredictability. The upper Bollinger Band has shifted to a $289 high, indicating the resistance level. Conversely, the lower Bollinger Band is at $259, indicating the support level.
Multiple technical quantitative indicators are still bearish, but the RSI indicator is in the neutral region. However, the current score of 53 and decreasing numbers confirm selling pressure. The declining curve on the indicator’s graph shows rising selling activity and bearish progress as the market conditions turn unfavorable on an hourly basis.
Bittensor technical indicators: Levels and actions
Daily simple moving average (SMA)
Period
Value ($)
Action
SMA 3
273.13
BUY
SMA 5
274.28
BUY
SMA 10
271.05
BUY
SMA 21
289.05
SELL
SMA 50
275.59
BUY
SMA 100
255.45
BUY
SMA 200
258.86
BUY
Daily exponential moving average (EMA)
Period
Value ($)
Action
EMA 3
274.73
BUY
EMA 5
273.97
BUY
EMA 10
276.07
BUY
EMA 21
279.09
SELL
EMA 50
275.26
BUY
EMA 100
267.74
BUY
EMA 200
274.04
BUY
What can we expect from Bittensor price analysis next?
Bittensor (TAO) fundamental analysis indicates a bullish outlook for current market trends. The TAO/USD price has slightly recovered to $277.96, but the bearish momentum has not faded yet. Most technical indicators signal bearishness, but the price charts lean in favor of the buyers, suggesting a potential move toward the $294 level, due to today’s recovery.
Is Bittensor TAO a good investment?
TAO coin continues to trade higher, indicating growing adoption among crypto investors as AI development and machine learning progress. Despite this, the coin faces uncertainties and volatility like all other cryptocurrencies. Our Cryptopolitan price prediction explores its potential profit and expected movements from 2026 to 2032 while considering the past performance. However, this is not investment advice, and one must conduct their own research before taking any investment decision according to their risk tolerance.
Why is TAO up?
TAO is up primarily due to buying pressure from traders after some degree of bullish price action, mainly due to strong market sentiment surrounding speculative AI tokens and the AI industry at large. Recent stability near key support levels also played a role in the resurrection of the bullish trend as traders started buying following a bull rally, and the token’s price has also increased during the past 24 hours.
How much is the Bittensor stock worth?
Bittensor (TAO) powers the Bittensor Network and is not a stock. Stocks are usually traded on stock exchanges, and stock ownership represents a stake in a company. Buying TAO tokens gives the buyer certain rights within the Bittensor Network, for example, governance participation but not ownership in a company. However, Bittensor (TAO) tokens can be purchased and traded on different exchanges, including Binance, Bitget, Coinbase, KuCoin, and Kraken. See our price analysis part for day-to-day price changes of the TAO token.
What is the price prediction for TAO 2026?
The highest Bittensor (TAO) price prediction for 2026 is around $570.20, but it is not easy to predict Bittensor price movements due to its volatile nature.
Will Bittensor reach $1000?
Yes, Bittensor should surpass $1000 by 2028. Its price will range between $842.56 and $1,000.54 during that period, which makes it a viable option to buy Bittensor tokens, considering the future performance and long-term trends, as decentralized AI development is expected to scale exponentially.
What is the total supply of Bittensor?
The total supply of Bittensor (TAO) tokens is 21 million TAO.
Does Bittensor have a good long-term future?
According to most market observers, Bittensor TAO will trade higher in the coming years. However, factors like market crashes or difficult regulations could invalidate this bullish theory.
Recent news/ opinions on Bittensor
ORO just went live on Bittensor, a specialized marketplace focused on AI agents for real-world e-commerce. It is important to remember that ORO (subnet 15) outperformed OpenAI’s GPT-5.4 on some complex online shopping evaluations.
ORO is now live on Bittensor, an open arena for AI agents.
A decentralized evaluation platform where miners submit AI shopping agents and validators assess them independently, with top performers earning emissions.
— xTAO – a Bittensor company (@xtaohq) May 1, 2026
Bittensor price prediction May 2026
A break of resistance will result in a mini bull run, with the next target at $352 during the month. The average price is expected to be $263, according to the current forecast. In a bearish scenario, TAO could drop to $197 at its lowest.
Month
Potential low
Potential average
Potential high
May 2026
$197
$263
$352
Bittensor price prediction 2026
The technical indicators are bullish on TAO for the end of 2026. It is anticipated to trade between $134 and $473.94, with an average price of $394.95, according to the Bittensor price prediction.
Year
Potential low
Potential average
Potential high
2026
$134
$394.95
$473.94
Bittensor price predictions 2027-2032
Year
Minimum Price
Average Price
Maximum Price
2027
$579.26
$658.25
$737.24
2028
$842.56
$921.55
$1,000.54
2029
$1,105.86
$1,184.84
$1,263.83
2030
$1,369.15
$1,448.14
$1,527.13
2031
$1,632.45
$1,711.44
$1,790.43
2032
$1,895.75
$1,974.74
$2,053.73
Bittensor’s price forecast 2027
TAO is expected to gain bullish momentum in 2027. According to the updated Bittensor forecast, the token will range between $579.26 and $737.24, with an average price of $658.25.
Bittensor price prediction 2028
The Bittensor outlook strengthens further in 2028. Analysts expect TAO to trade between $842.56 and $1,000.54, with an average yearly price of $921.55.
Bittensor TAO price prediction 2029
The 2029 Bittensor price prediction suggests TAO will move between a minimum of $1,105.86 and a maximum of $1,263.83, settling at an average price of $1,184.84 for the year.
Bittensor price prediction 2030
For 2030, Bittensor price predictions indicate a trading range from $1,369.15 to $1,527.13, with an average expected price of $1,448.14.
Bittensor crypto price prediction 2031
In 2031, Bittensor price prediction, TAO is projected to range between $1,632.45 and $1,790.43, with an average price of $1,711.44, which is quite higher than its current value.
Bittensor price prediction 2032
The Bittensor price prediction for 2032 places TAO between $1,895.75 and $2,053.73, with an average price of $1,974.74.
TAO market price prediction: Analysts’ TAO price forecast
Platform
2026
2027
Digitalcoinprice
$202.28
$224.87
Coincodex
$245.77
$245.77
Cryptopolitan’s Bittensor (TAO) price prediction
According to our predictions, TAO could recover to $473.94 by the end of December 2026. We expect TAO to maintain a trading range of $579.26-$737.24, with an average of $658.25 in 2027. Note that the predictions are not investment advice. Seek independent professional consultation or do your research.
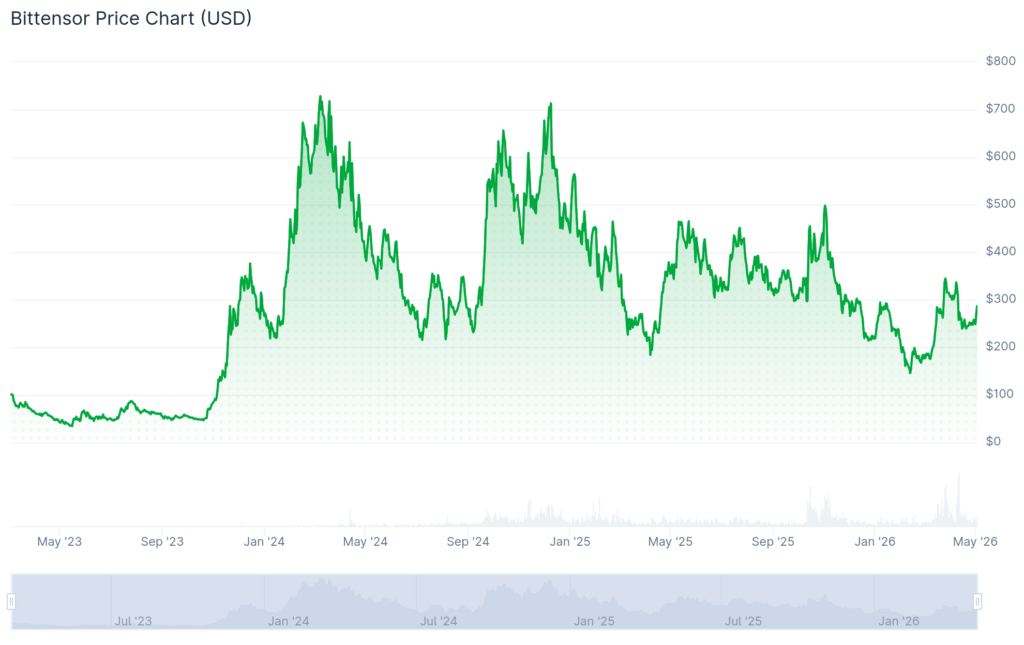
TAO launched on March 6, 2023, at $93.4, but fell below its opening price within a week, sliding into the $76 range.
By early April, it had lost half its value, dropping to $47, and continued downward to its $30.83 low in May before slowly recovering to $63 by the end of the month.
The token climbed to $86.18 in July, just under its launch price, then pulled back again and traded near $54 through October.
Momentum returned in November, pushing TAO into the $95 range, showing continuous improvement, and then sharply to a peak of $379 on December 15, 2023.
TAO trended downward into early 2024 but surged to its all-time high of $757.60 in March. It quickly corrected to $522 in April and continued weakening through mid-year, reaching $216 in July.
A brief rebound to $357 faded again as the token slipped back toward the mid-$200s by late summer, as per the crypto market price history records.
Momentum returned in October, pushing TAO into the $660 range before cooling to $468, according to the historical price data. It climbed once more to $679 in November but ultimately closed 2024 at $440.69, as the broader crypto market turned bearish again.
TAO opened in 2025 at $439.73, peaked at $565 in January, and its price decreased to the $324 level in February, taking down the token’s market capitalization as the technical indicators turned bearish due to some fundamental factors.
In March, TAO dipped to the $259 mark and descended further to $228 in April; however, in May, it recovered to $467 as the Bittensor market revived.
In October, TAO observed its year’s lowest prices extending toward $200.44.
TAO opened trading in November at $506, lost 46% of its value, and closed the month at $269.11, while at the start of December, the coin was trading between $256.29 and $298.90.
At the start of January 2026, TAO was trading near the $223 range, as the market shifted towards the bearish side.
In March, TAO traded below the psychological level of $200, but it surged past $300 in the month of April. At the start of May, TAO is trending above the $260 range, as current market sentiment turned decidedly bullish once again.
Pi Coin price is drifting toward a fresh all-time low as a bearish chart structure tightens its grip on the token, leaving the floor sitting just inches below the current price.
Three independent signals across capital flow, social activity, and smart money positioning have lined up against the token as it tests its most important support since February.
Head and Shoulders Forms as CMF Flags Capital Flight
The PI/USDT daily chart shows a Head and Shoulders pattern, a classic bearish reversal structure. The setup features a higher peak (the head) flanked by two lower peaks (the shoulders), with a horizontal neckline tying the swing lows together.
The left shoulder formed in mid-February. The head printed in mid-March near the cycle peak. The right shoulder completed in mid-May and is now rolling over.
Want more token insights like this? Sign up for Editor Harsh Notariya’s Daily Crypto Newsletter here.
Chaikin Money Flow (CMF), a volume-weighted indicator that proxies big money buying and selling pressure, has slipped to -0.04 on the daily chart. That marks the lowest reading since early April.
The indicator broke below its zero line and is now retesting its most stressed zone in roughly two months. A push under -0.05 would confirm a heavier outflow phase aligned with the pattern’s downside thesis.
Capital flight, however, does not measure how much attention Pi Network is drawing as the breakdown approaches.
Pi Network Social Volume Falls From 31 to 1
Pi Network’s daily Social Volume, a Santiment metric that counts unique social documents discussing the token across more than a thousand crypto channels, has collapsed to 1. That reading sits at the floor of the visible chart range. By comparison, the score peaked at 31 on May 8 post a brief retail rally attempt.
The roughly 97% drop in social chatter shows that retail attention has faded sharply as the price has drifted lower. Quiet markets tend to extend bearish moves because no fresh demand arrives to absorb sell pressure.
For a community-driven asset like Pi, where engagement has historically powered demand, a silent social tape is a structural warning. The token is sliding without any narrative catalyst pulling new buyers in.
The crowd has stepped back, but the question is whether informed money is doing the same.
Smart Money Index Diverges Below Signal
The Smart Money Index, an indicator that measures informed-trader positioning, sits at 0.9063 against its signal line at 0.9157.
The Smart Money line is now diverging below its signal line, a configuration that has historically preceded weaker prices when it persists. The metric slipped under its baseline relative to the signal line in early May and the gap has continued to widen.
The only feature still propping up the indicator is an ascending trendline anchored from the early-February low. That trendline is currently being tested.
A clean break under that ascending support would push the Smart Money reading to its lowest level since February 11, the same period when PI printed itsall-time low of $0.130. A repeat of that backdrop would close the loop between informed money exit and a fresh price low.
With three independent signals aligned, the price chart now becomes the decider.
Pi Coin Price Levels to Watch as All-Time Low Looms
The Pi Coin price is currently fighting to defend the $0.145 neckline of the Head and Shoulders pattern. A daily close below $0.145 opens the door directly to the $0.130 all-time low, which sits roughly 13% below current spot.
The first cushion below the neckline arrives at $0.143, the 0.236 Fibonacci level of the structure. Below the all-time low, $0.129 (0.5 Fibonacci) and $0.122 (0.618) become the next stress zones.
Deeper bearish extensions stack at $0.113 (0.786) and $0.102 (1.0 Fibonacci). The pattern’s full measured-move target near $0.074 aligns with the 1.618 extension at $0.069, marking the deepest projected zone.
Every level below $0.130 would print a fresh all-time low and pull the token into uncharted territory with each breach.
A bullish reset, however, only begins on a daily close back above $0.156, the right shoulder peak. Real strength returns above $0.200, the left shoulder zone, while the full pattern invalidates only on a move above the $0.300 head.
A daily close above $0.156 separates a possible right shoulder recovery from a confirmed slide into all-time low territory.
In 2026, the Shiba Inu coin price prediction suggests a maximum value of $0.00001775.
In 2029, SHIB is expected to reach a maximum value of $0.00002290.
The price of Shiba Inu is predicted to reach a maximum value of $0.00004280 in 2032.
Shiba Inu (SHIB) was initially launched as a meme coin with ambitions to surpass Dogecoin’s popularity and market presence. Over time, Shiba coin has continued to expand its ecosystem through Shibarium, ShibaSwap, and new utility-driven updates. Recent developments show growing activity as the team launched “Shib Owes You” (SOU), introduced AI tools through “Shibarium Skills,” and addressed RPC connection issues affecting users.
At the same time, SHIB gained real-world utility after integrating with OnePay, a payment network backed by Walmart. Shibarium also surpassed 270 million wallet addresses, showing steady adoption and increasing on-chain activity.
As Shiba Coin’s ecosystem grows, questions arise about SHIB’s market capitalization and its price trajectory. How much will Shiba Inu be worth in the coming years? Will the advancements drive SHIB to new highs and impact the market’s price action?
Will SHIB ever reach $1? In this Shiba Inu price prediction, analyzed by Cryptopolitan, we’ll determine future SHIB price trends between 2026 and 2032.
Today, SHIB price analysis shows a bearish pressure toward $0.0000056
The current resistance for SHIB is at $0.0000060
The immediate Support for SHIB is at $0.0000053
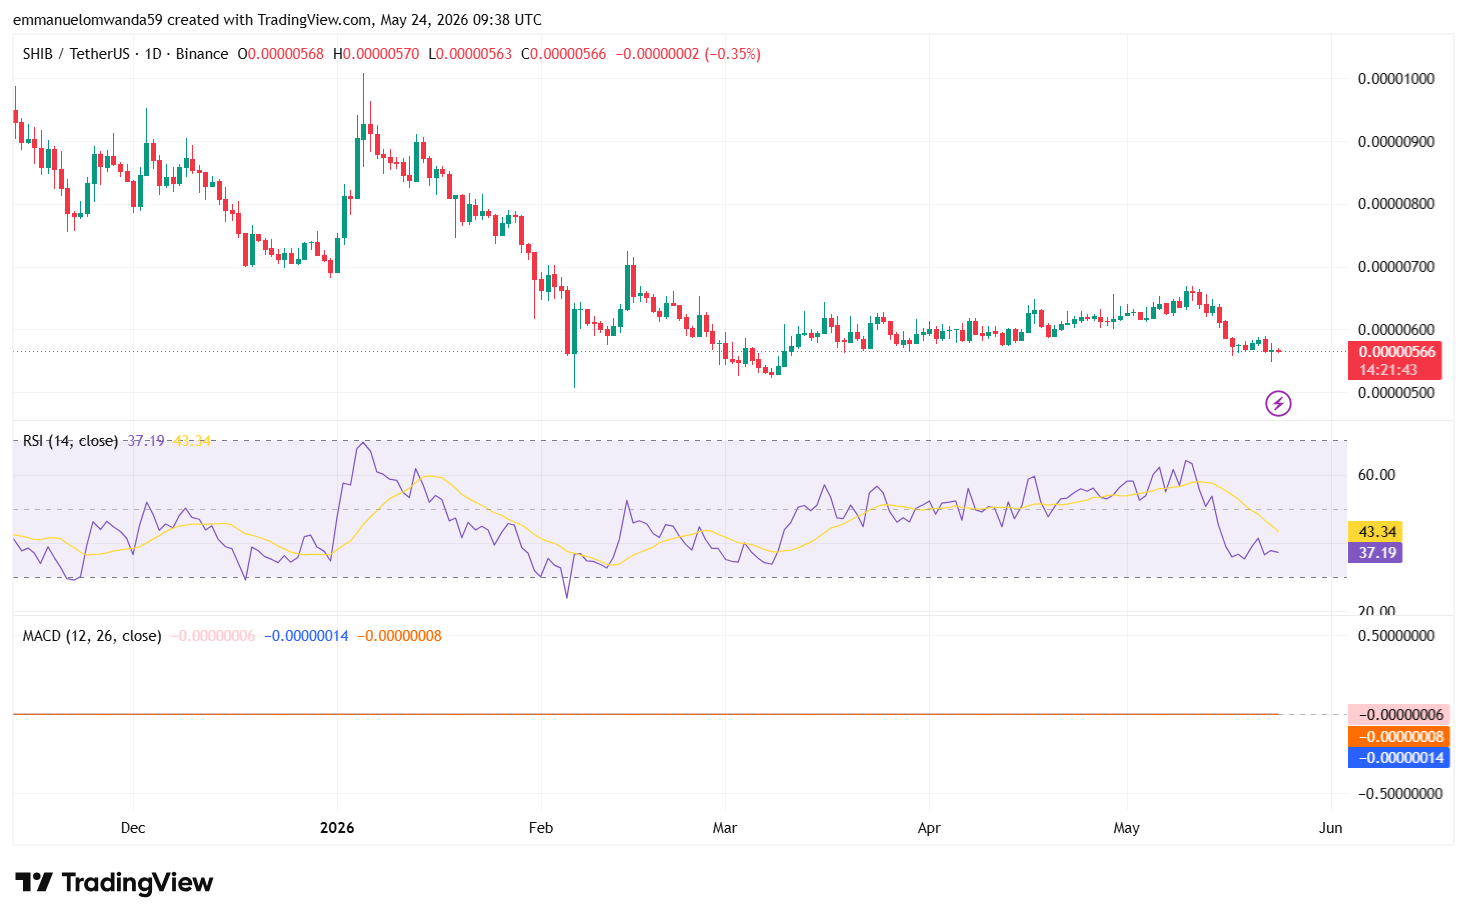
The SHIB price analysis for 24 May 2026 shows that SHIB continues to face selling pressure as the meme coin declines toward $0.0000056. Currently, sellers are attempting to maintain bearish momentum after recent rejection near higher resistance levels.
Analyzing the daily chart, it is clear that the SHIB price is facing bearish pressure as sellers push it toward $0.0000056. On the daily chart, SHIB opened at $0.00000568, climbed to a high of $0.00000570, dropped to a low of $0.00000563, and closed near $0.00000566. The token declined by around 0.35% in the last 24 hours, showing weakening bullish momentum.
The 24-hour trading activity remained subdued, reflecting cautious sentiment among traders as SHIB struggles to recover above immediate resistance channels. Price action suggests bears are attempting to hold the token below $0.0000058, while buyers defend the key support zone around $0.0000053.
The RSI-14 trend line has dropped below the neutral zone and trades at 37.19, indicating that sellers are currently controlling market momentum. The declining RSI curve also hints at weak buying strength and the possibility of continued consolidation or downside movement in the short term.
The MACD indicator remains in bearish territory, with the MACD line trading below the signal line and red histograms forming, confirming negative momentum and strengthening bearish sentiment on the daily timeframe.
The Immediate resistance for SHIB is at $0.0000060, while strong support is forming near the $0.0000053, where buyers may attempt to prevent further downside pressure.
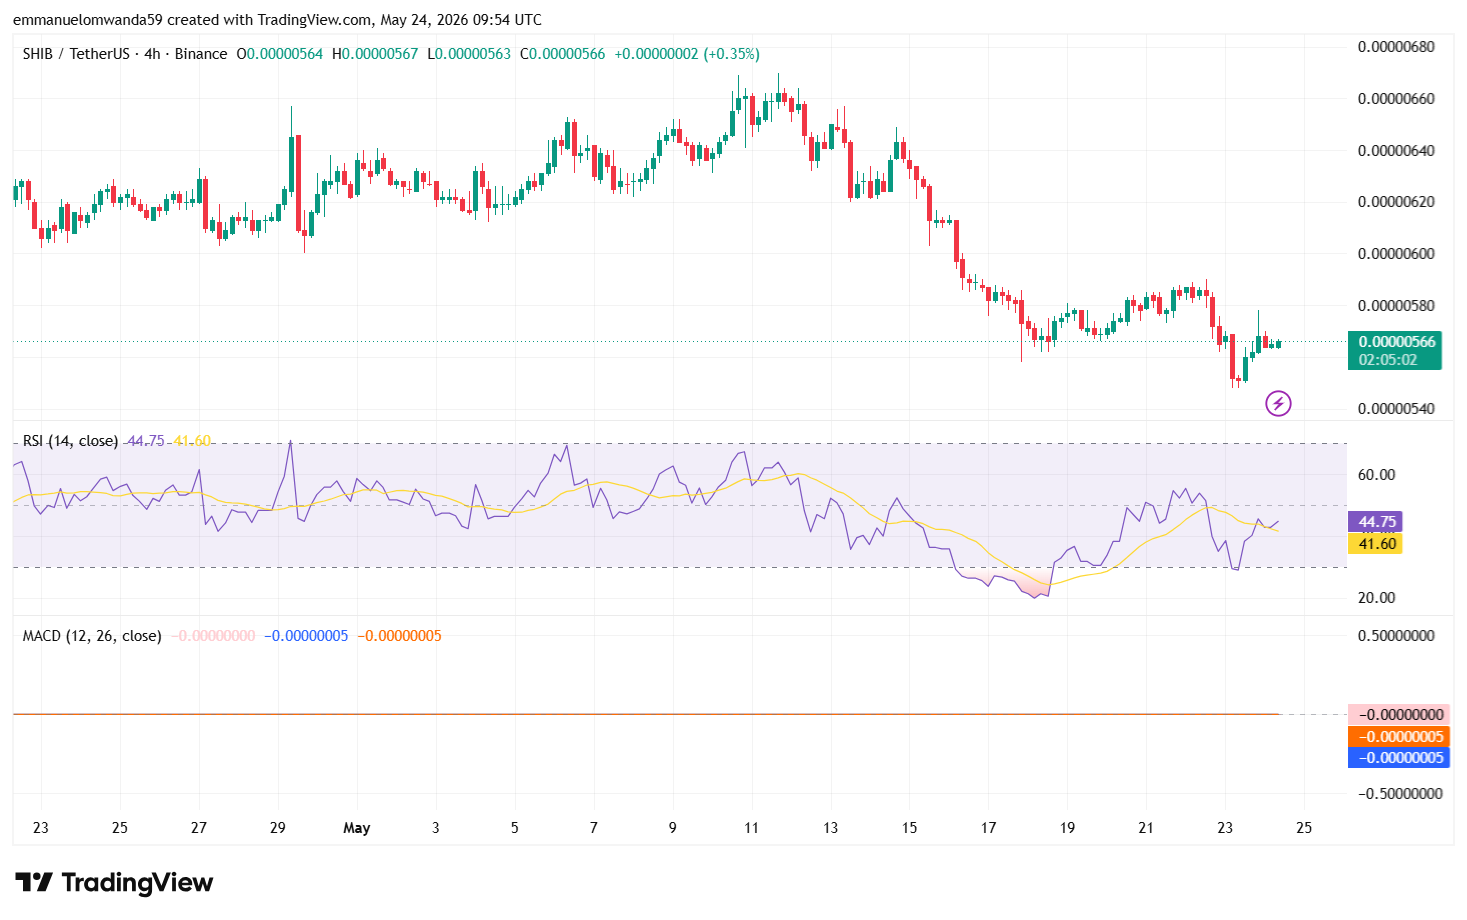
Analyzing the 4-hour SHIB price chart, it shows that sellers continue dominating the short-term trend as SHIB struggles to recover above immediate resistance levels. Price action shows continued weakness below the EMA trend lines, with bears attempting to maintain pressure around the $0.0000056 region.
The RSI-14 indicator trades around 44.7, showing that bearish momentum is easing slightly, though buyers still lack enough strength for a strong breakout. The RSI curve is attempting to recover from oversold conditions, hinting at a possible short-term consolidation if buying activity improves.
The BoP indicator remains in a slightly negative region, suggesting sellers are still controlling short-term momentum near support zones. Additionally, the MACD trend line continues forming weak red histograms below the signal line, indicating that bearish momentum remains active on the 4-hour timeframe.
Immediate resistance on the 4-hour chart is positioned near $0.0000058, while support is forming around the $0.0000054 level.
Shiba Inu technical indicators: Levels and action
Daily simple moving average (SMA)
Period
Value
Action
SMA 3
$0.000005731
BUY
SMA 5
$0.000005756
SELL
SMA 10
$0.000006053
SELL
SMA 21
$0.000006196
SELL
SMA 50
$0.000006103
SELL
SMA 100
$0.000006026
SELL
SMA 200
$0.000007082
SELL
Daily exponential moving average (EMA)
Period
Value
Action
EMA 3
$0.000005758
SELL
EMA 5
$0.000005816
SELL
EMA 10
$0.000005961
SELL
EMA 21
$0.000006084
SELL
EMA 50
$0.000006122
SELL
EMA 100
$0.000006370
SELL
EMA 200
$0.000007345
SELL
What to expect from the SHIB price analysis next?
SHIB may continue trading under bearish pressure in the short term unless buyers push the price above the immediate resistance near $0.0000058. If sellers maintain control and SHIB breaks below the $0.0000054 support zone, the meme coin could see a deeper correction toward lower support levels.
Is Shiba Inu a good investment?
Shiba Inu (SHIB) is currently consolidating between key support and resistance. A breakout above resistance could lead to gains, while failure to hold support may cause further downside. SHIB may suit investors comfortable with volatility, but it’s important to monitor price action closely before making any investment decision.
Why is Shiba Inu down today?
SHIB recently declined as broader macro risk-off conditions triggered heavy selling across meme coins, with investors moving away from speculative assets amid rising inflation and Treasury yields. The downturn was intensified by large SHIB exchange inflows, bearish technical breakdowns below key support levels, and increased selling pressure from short-term traders.
Recent news on Shiba Inu
Shiba Inu (SHIB) has been included in SBI VC Trade’s “Rent Coin” lending program in Japan, offering yields of around 2% to 5% APY over a ~28-day term. The move follows SHIB’s addition to Japan’s Green List, reinforcing its status as a regulated asset and expanding its use into lending and passive income services.
SHIB included in SBI VC Trade lending expansion in Japan
SBI VC Trade continues its “Rent Coin” lending program with Shiba Inu officially listed among supported assets. The latest campaign confirms SHIB remains part of their active lending lineup.
More than 1.1 trillion SHIB tokens moved on-chain recently over the last 24 hours as whale activity intensified, while exchange reserves dropped to nearly 81 trillion SHIB, the lowest level seen in 2026 so far. Large holders continued moving tokens away from centralized exchanges into private wallets, signaling possible accumulation despite calm price action across the broader market.
SHIB Whales Just Moved 1.1 Trillion Tokens as Exchange Supply Hits 2026 Low
More than 1.1 trillion SHIB moved on-chain in the last 24 hours as whale activity accelerated behind the scenes.
At the same time, exchange reserves dropped to around 81T SHIB, the lowest level recorded… pic.twitter.com/BTsovUIQgo
Shiba Inu’s network activity continued expanding as the total holder count climbed to over 1.58 million wallets, while exchange reserves remained near yearly lows at 81.31 trillion SHIB. Recent on-chain data also showed sustained exchange outflows and negative netflows of over 452 billion SHIB, signaling continued accumulation behavior despite subdued market trading activity.
SHIB Market Snapshot
SHIB holder count has climbed to 1,585,249 wallets, continuing the steady expansion of the network while exchange reserves remain near yearly lows.
Latest exchange data: • Total Exchange Reserve: 81.31T SHIB • Total Exchange Netflow: -452.72B SHIB • 7D…
Yes, according to crypto experts’ long-term predictions, SHIB’s role in the cryptocurrency market is projected to lead it to reach $0.00005 behold 2032.
Will SHIB reach $100?
SHIB’s goal of reaching $100 is virtually impossible given its vast circulating supply in the meme coin market, which significantly influences its price movements. Additionally, to get the $100 mark, SHIB would require a significant increase in its market cap, which is beyond imagination for a meme coin.
Does SHIB have an excellent long-term future?
The Shiba Inu price made headlines in January 2025 after Shytoshi Kusama, the lead developer, stepped down. However, SHIB shows some positive movement, suggesting the ecosystem may have a promising long-term future.
However, its success will also depend on macroeconomic factors, partnerships, broader market adoption trends, and other regulatory developments that influence market cycles. You are advised to seek investment advice, do your own research, and gather expert opinions before investing in the highly volatile crypto market.
Shiba Inu price prediction for May 2026
The Shiba Inu price forecast for May 2026 is expected to range from $0.00000560 to $0.000007757. The average price for SHIB is projected to be around $0.00000668, assuming a gradual recovery and moderate buying interest.
Month
Potential low
Potential average
Potential high
May 2026
$0.00000560
$0.00000668
$0.000007757
Shiba Inu price prediction 2026
The shiba inu cost in 2026 is predicted to range from a minimum of $0.000005173 to a maximum of $0.000027, with an average price of $0.000016086. The Shiba Inu price prediction for 2026 suggests a potential high of $0.000027 and a low of $0.000005173.
Year
Potential low
Potential average
Potential high
2026
$0.000005173
$0.000016086
$0.000027
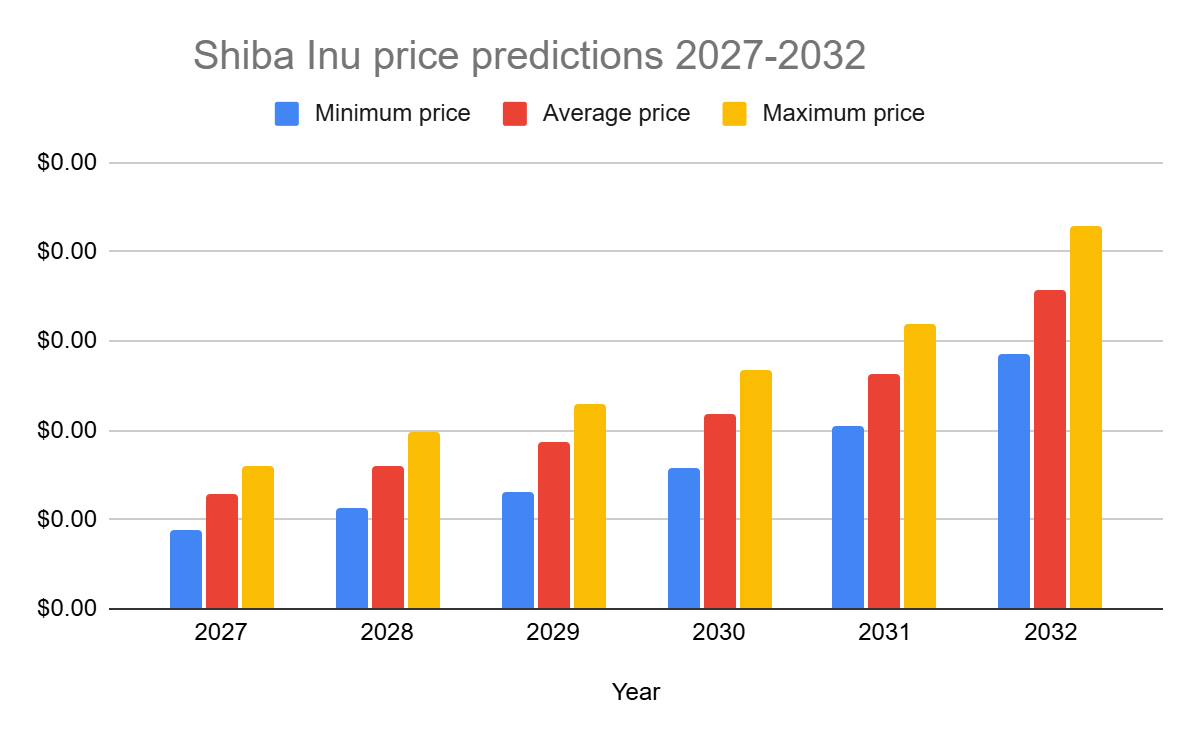
Shiba Inu price predictions 2027-2032
Year
Minimum price
Average price
Maximum price
2027
$0.00000890
$0.00001280
$0.00001610
2028
$0.00001140
$0.00001590
$0.00001980
2029
$0.00001320
$0.00001870
$0.00002290
2030
$0.00001580
$0.00002190
$0.00002680
2031
$0.00002040
$0.00002630
$0.00003190
2032
$0.00002860
$0.00003570
$0.00004280
Shiba Inu Price Prediction 2027
In 2027, the price of Shiba Inu is projected to reach a minimum level of $0.00000890. The SHIB price could rise to a maximum of $0.00001610, with an average trading price of $0.00001280 as the market gradually recovers and the ecosystem grows.
Shiba Inu Price Prediction 2028
The price of Shiba Inu is expected to reach a minimum level of $0.00001140 in 2028. The SHIB price could climb to a maximum level of $0.00001980, with an average price of $0.00001590 throughout the year.
Shiba Inu Price Prediction 2029
In 2029, the price of Shiba Inu is predicted to reach a minimum level of $0.00001320. The SHIB price could reach a maximum level of $0.00002290, with an average trading price of $0.00001870.
Shiba Inu Price Prediction 2030
In 2030, Shiba Inu is forecast to trade at a minimum value of $0.00001580. The price could reach a maximum of $0.00002680, with an average trading value of $0.00002190.
Shiba Inu Price Prediction 2031
In 2031, the price of Shiba Inu is expected to reach a minimum value of $0.00002040. The SHIB price could reach a maximum value of $0.00003190, with an average value of $0.00002630.
Shiba Inu Price Prediction 2032
Shiba Inu price is forecast to reach a lowest level of $0.00002860 in 2032. The SHIB price could reach a maximum level of $0.00004280, with an average forecast price of $0.00003570.
Our predictions show that the Shiba Inu cryptocurrency will achieve a minimum value of $0.00000545 in 2026. The Shiba Inu price could reach a maximum value of $0.00001775, with an average trading price of $0.00001160 throughout 2026. Please note that the content provided and other content on this page are for informational purposes only and do not constitute investment advice. Seek independent professional consultation or do your research.
Shiba Inu historic price sentiment
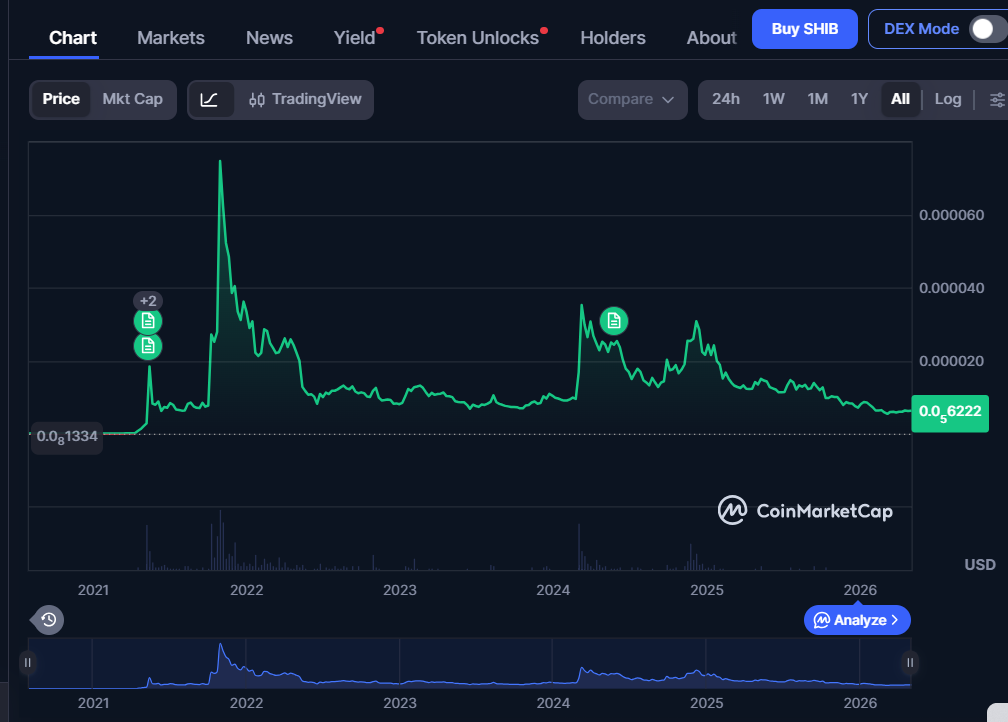
Shiba Inu Price History: Coinmarketcap
Shiba Inu surged over 300% shortly after launch, triggering a trading frenzy similar to Dogecoin’s early 2021 rally. During this period, many investors rushed to buy SHIB on easy-to-use platforms as its popularity surged and exchanges quickly listed the token to meet demand.
Shiba Inu’s price action has been marked by significant volatility, with sharp spikes and corrections driven by community hype, market sentiment, and broader crypto trends.
In 2022, SHIB started near $0.000025 but dropped to around $0.000008 by May, then moved between $0.000007 and $0.000010 for the rest of the year.
In early 2023, Shiba Inu briefly spiked to $0.000015 in February but declined gradually, stabilizing around $0.000010 by June 2023 and closing the year at $0.00001033.
In March 2024, SHIB climbed to $0.000045 before consolidating between $0.000017 and $0.000029. By late 2024, the price moved between $0.000015 and $0.000033.
In 2025, SHIB gradually declined from $0.000021 to below $0.000009 by December, despite brief rebounds during the year.
In early 2026, SHIB briefly recovered to $0.0000098 in January but fell to the $0.0000065 range in February.
In January 2026, Shiba Inu jumped from about $0.0000087 to near $0.0000098 before pulling back and stabilizing around $0.0000093.
As of February 2026, Shiba Inu (SHIB) experienced volatility, fluctuating between approximately $0.0000065 and $0.0000068, with short-term rebounds failing to sustain upward momentum.
At the start of March 2026, Shiba Inu (SHIB) remained under pressure, trading around $0.0000054 after slipping from the February range.
Shiba Inu (SHIB) experienced a bullish momentum on March 16, 2026, with the price rising 8% in 24 hours to approximately and over 17% for the week.
By the end of March 2026, Shiba Inu (SHIB) traded at around $0.0000058 after failing to sustain recoveries from mid-month gains.
By mid-April 2026, Shiba Inu (SHIB) traded around $0.0000061, showing slight stabilization after recovering from the early March range, though buying momentum remained limited.
At the start of May 2026, Shiba Inu (SHIB) traded around $0.0000062, moving in a tight range with slight consolidation, as the market showed weak momentum and no strong buying pressure.
Ethereum’s market sentiment has deteriorated significantly as the blockchain network’s native ETH token moves through a medium-term bear phase.
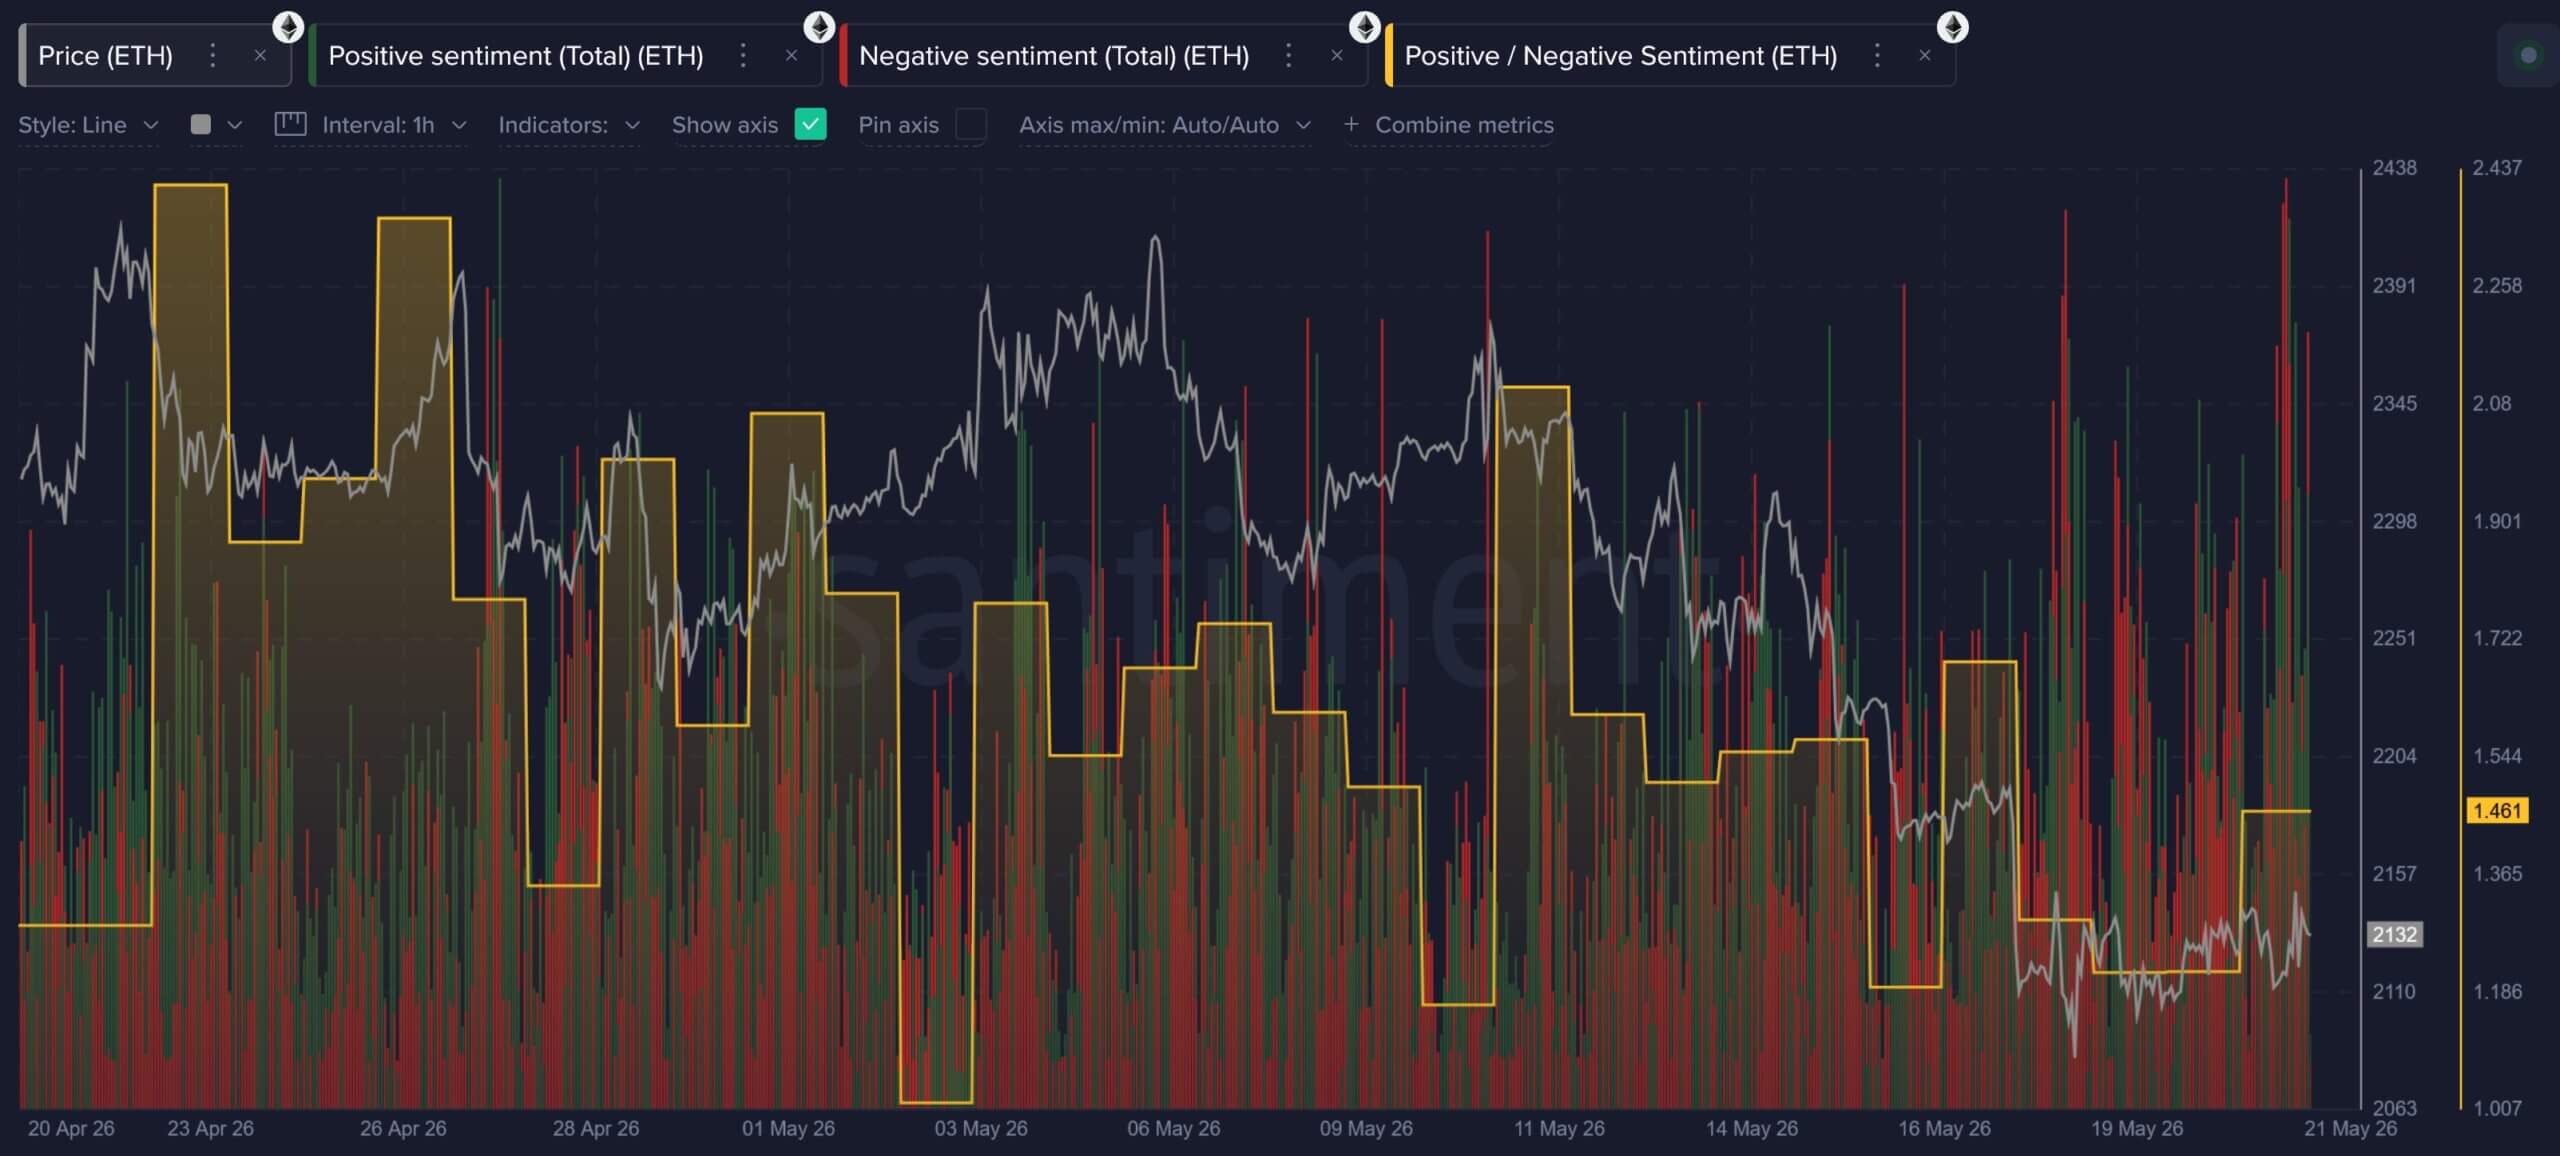
Data from blockchain analytics platform Santiment shows that while ETH-related discussions increased in frequency throughout May, the tone of that commentary has shifted toward frustration, disappointment, and concern about deeper downside potential.
Ethereum Market Sentiment (Source: Santiment)
Analysts at the firm noted that this shift in sentiment reflects a combination of market pressures building simultaneously, including weak spot price action, persistent exchange-traded fund (ETF) outflows, high-profile departures from the Ethereum Foundation, public criticism from longtime ecosystem supporters, and stronger price momentum across competing layer-1 networks like Hyperliquid, Zcash, and Solana.
Broader market data from CryptoQuant reinforces this picture of institutional deceleration. The firm’s spot market and fundamental indicators point to severe structural weakness as ETH prices drop toward the critical $2,000 support level.
This has created a split-market identity in which spot investors are steadily reducing exposure, market liquidity has thinned, and institutional buying pressure has largely vanished from major trading desks.
Spot selling leaves Ethereum without a durable bid
Indeed, CryptoQuant’s fund-tracking data highlights the extent of the contraction in the institutional bid over the last two quarters.
According to the firm, total fund holdings, which peaked above 7 million ETH in October 2025, have steadily declined to a range around 5.5 million ETH.
This persistent unwinding indicates that large-scale allocators have systematically reduced their core exposure throughout the current multi-month drawdown.
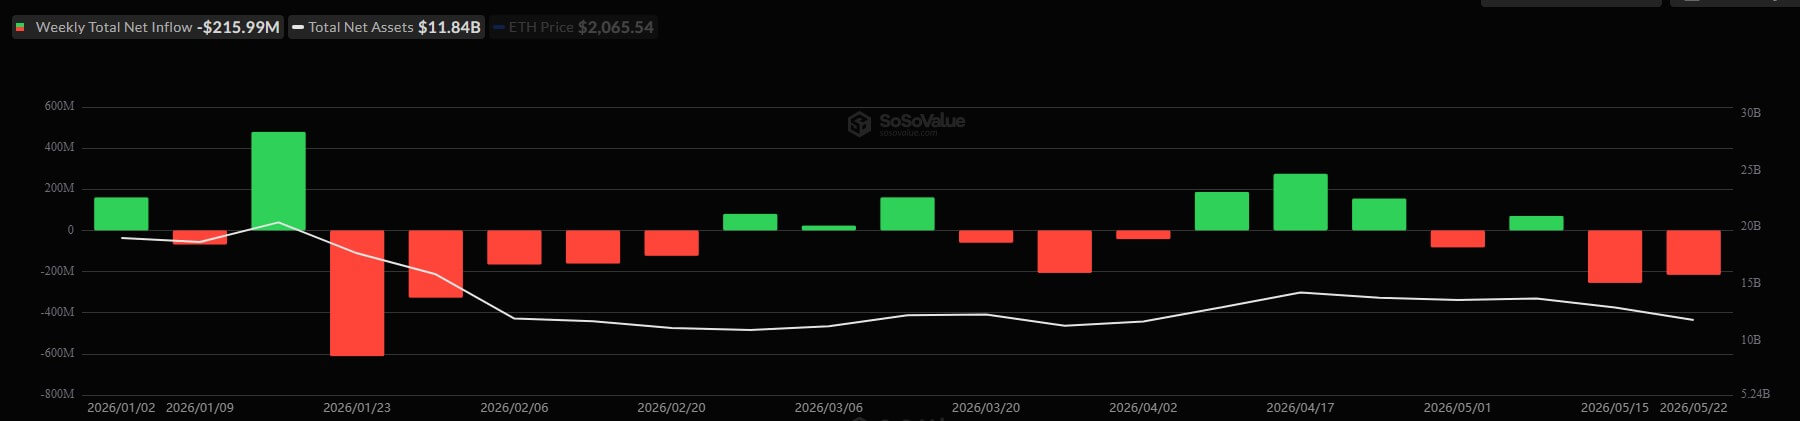
Notably, the regulated ETF market has reinforced this structural pressure. Total assets under management across Ethereum ETFs now stand near $12.14 billion, marking a 23% decline from their January peak.
Data from SoSoValue shows that May proved particularly challenging, with two consecutive weeks of net outflows totaling approximately $470 million, representing one of the largest episodes of concentrated capital flight of the year.
Ethereum ETFs Weekly Outflows (Source: SoSoValue)
This institutional withdrawal is further illustrated by the Coinbase Premium Index, which tracks the price disparity between Coinbase Pro and major offshore platforms.
The index remained negative throughout May, signaling an absence of spot demand from US institutional buyers.
At the same time, ETH liquidity has thinned alongside this reduction in fund reserves.
According to CryptoQuant, daily fund trading volume has trended downward since February 2026, dropping well below its trailing 1-year moving average to a recent range of $17 million to $42 million.
This volume compression points to a thinner spot market where dip-buying appetite has faded, leaving the asset highly exposed to volatility spikes during periods of negative news.
ETH options traders hedge as leveraged longs hold on
Beneath the spot market liquidation, derivatives data reveal an ongoing debate over whether ETH is breaking into a structural decline or forming a base for a leveraged rebound.
This disconnect has left the derivatives market divided, with professional traders aggressively hedging downside risk even as speculative perpetual futures traders maintain long positioning.
Data from Block Scholes reveals that ETH’s 25-delta risk reversal skew over a seven-day horizon has traded near-7%, indicating that options market participants are paying a premium for downside put protection.
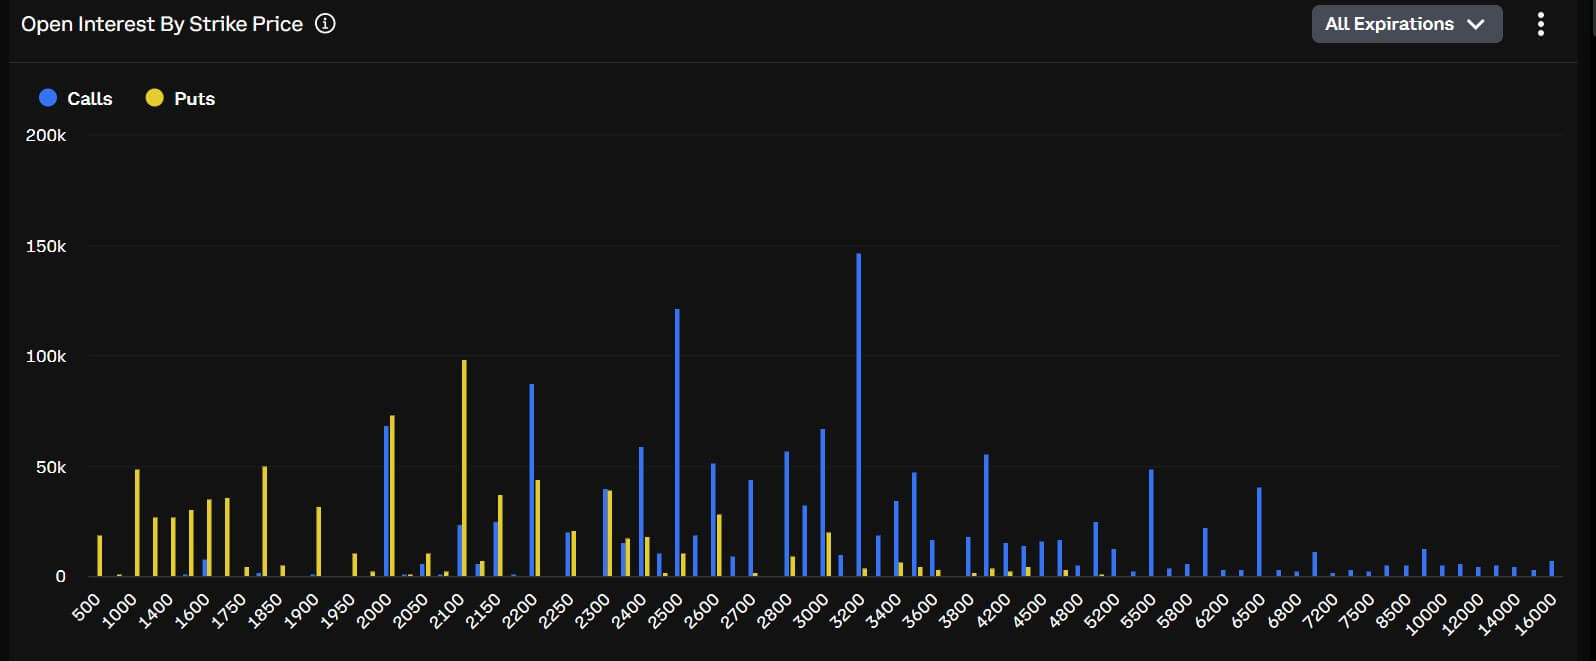
This defensive posture is supported by clearing data from the Deribit exchange, where open interest for put options targeting the $2,100 and $2,000 strike prices has concentrated past $380 million, placing those technical areas at the center of short-term institutional positioning.
ETH Options Traders Positioning (Source: Deribit)
Market Note: This concentrated options activity reflects a market preparing for extended weakness. Having already slipped below the $2,100 support shelf, Block Scholes’ risk appetite indexes show slowing momentum, leaving the asset dependent on defensive hedging in the absence of spot accumulation.
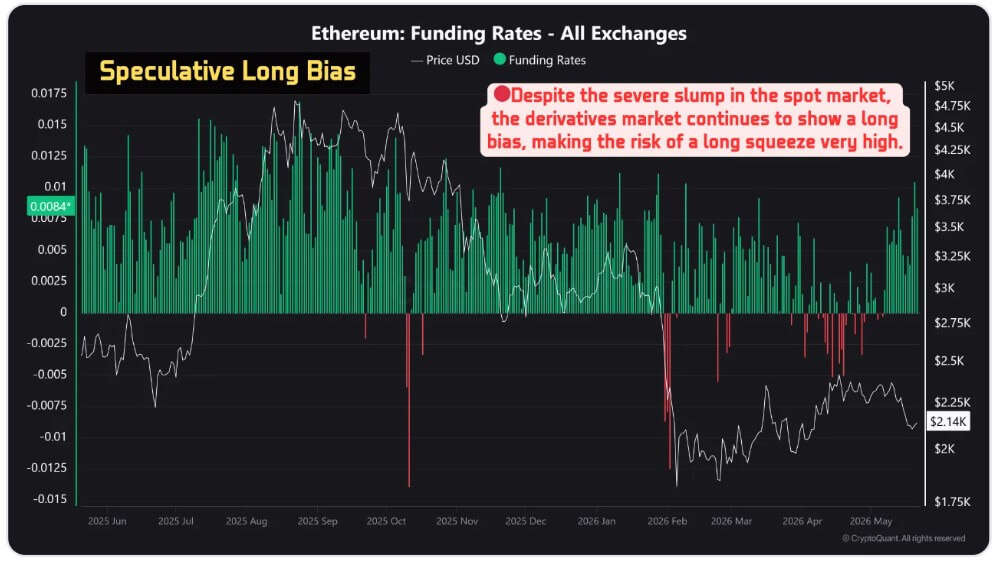
Concurrently, the perpetual futures market sends a more complicated signal. CryptoQuant data shows that Ethereum’s derivatives funding rate has settled firmly in positive territory, reaching 0.0082 on May 21, 2026.
Ethereum Funding Rates (Source: CryptoQuant)
This positive rate indicates that speculative long bias has not fully collapsed despite declines in market capitalization, fund holdings, and spot trading volume.
The resulting split identity creates a delicate technical backdrop: while options traders position for a breakdown, perpetual futures traders continue to hold leveraged long exposure.
This structural disconnect can fuel rapid short-squeezes if spot demand unexpectedly returns, but it significantly elevates the risk of cascading liquidations if the spot price breaches the heavy open interest concentrated at the $2,000 floor.
Ethereum Foundation exits collide with a weaker ETH value thesis
Ethereum’s financial underperformance has coincided with an acceleration of senior personnel departures from the Ethereum Foundation (EF), the Swiss non-profit entity that stewards the blockchain’s core development.
The internal churn intensified following the formal resignations of research veterans Carl Beek and Julian Ma. Beek had spent seven years focused on Beacon Chain design, while Ma authored the network’s Forwarding Oversight Committee for Incentivized Labs (FOCIL) framework.
Their departures bring the total number of senior exits or step-backs to at least nine since February, with five landing in May alone.
The list includes former co-Executive Director Tomasz Stańczak, board co-steward Josh Stark, Protocol Guild contributor Trent Van Epps, and protocol cluster leads Barnabé Monnot and Tim Beiko.
Additionally, senior researcher Alex Stokes recently commenced a three-month sabbatical, further thinning the organization’s visible technical leadership during a period of acute market stress.
Ecosystem analysts trace this administrative migration back to the publication of the foundation’s “Mandate” document in mid-March.
The 38-page framework codified the foundation’s dedication to “CROPS” principles: censorship resistance, open-source deployment, privacy, and base-layer security.
Crucially, the document framed the foundation as an ecosystem steward rather than a corporate enterprise, explicitly stating that its purpose is to protect network neutrality, not to maximize token price, optimize investor returns, or aggressively coordinate commercial expansion.
This neutrality-first posture has become increasingly difficult for parts of the market to accept as alternative networks capture speculative market share.
Tommy Shaughnessy, co-founder of Delphi Ventures, noted that the departures are more serious than they appear, adding that the exit of reform-minded personnel leaves fewer internal voices to challenge the foundation’s structural direction.
Reform calls test Ethereum’s neutrality-first model
The perceived lack of commercial execution by the foundation has prompted several prominent former insiders to call for structural governance reforms.
Dankrad Feist, a notable researcher who left the foundation last year to join the Stripe-backed layer-1 network Tempo, publicly advocated creating an entirely separate entity to safeguard the network’s economic relevance.
Feist proposed establishing an independent, alternative organization backed by at least $1 billion in capital, funded in part by network staking revenues. This proposed body would be directly accountable to token holders and expressly tasked with driving ETH’s financial adoption and market value.
According to him, this leaves the ecosystem without an agile institution incentivized to promote the asset in capital markets.
Bankless co-founder Ryan Sean Adams supported this view, stating that Ethereum’s future cannot depend solely on the foundation.
Adams argued that the ecosystem requires competitive, well-capitalized institutions dedicated to capital efficiency, aggressive communication, and commercial execution. These are roles the foundation was never structurally designed to fulfill.
The consensus among these reform proposals is not to replace the foundation, but to establish a dual-institution model: one to protect base-layer neutrality and public goods, and another to promote the asset and compete for institutional capital.
This push for reform has drawn a direct response from Ethereum bulls, who argue that the market is overreacting to short-term price action and natural organizational transitions.
ETH investor member Ryan Berckmans characterized the talent turnover as a healthy handoff to a younger generation of developers.
Berckmans argued that Ethereum has successfully navigated previous periods of regulatory pressure and leadership transitions while still delivering major upgrades like the Merge, blob transactions, and a dominant position in on-chain application capital.
He noted that the expanding deployment of stablecoins and tokenized assets by global corporations continues to support the network’s long-term trajectory.
This perspective is shared by substantial institutional holders.
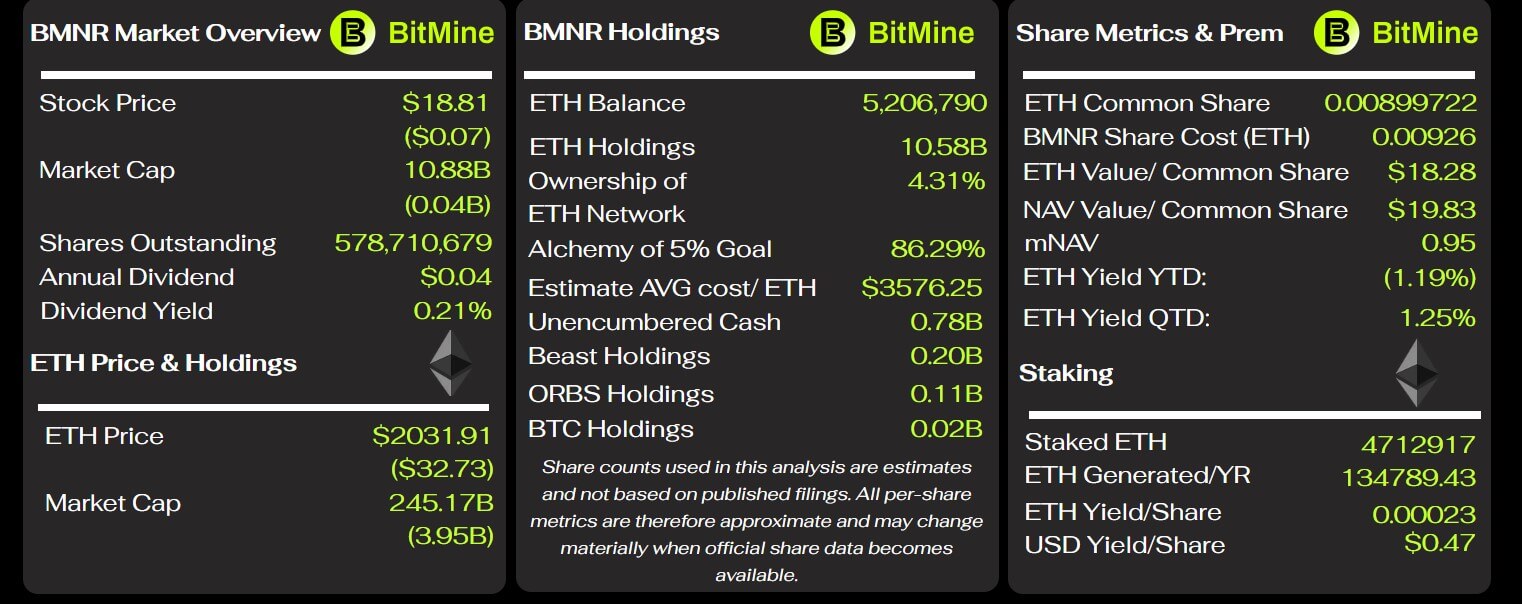
Thomas Lee, chairman of BitMine, dismissed the current market anxiety as typical cyclical capitulation. BitMIne is the largest publicly traded corporate holder of ETH, with a portfolio of 5.2 million ETH and over $10 billion actively staked tokens.
BitMine Key Metrics (Source: BitMine Tracker)
Lee asserted that blockchain infrastructure represents the foundational settlement highway for agentic artificial intelligence commerce and institutional finance, positions where Ethereum maintains a distinct structural advantage due to its established security record, deep liquidity, and institutional familiarity.
How Ethereum can recover from the current FUD
Market observers have noted that Ethereum’s near-term trajectory now hinges on whether its technical roadmap and commercial moats translate into a coherent investment thesis for ETH.
Strategic analysis from Galaxy Digital indicates that the network must execute a disciplined operational agenda to reverse ongoing capital flight.
According to Galaxy’s recovery framework, the immediate focus must center on shipping the Glamsterdam upgrade, keeping the subsequent Hegotá deployment on track, clarifying administrative responsibilities within the foundation, and concentrating resources on core commercial verticals.
These key areas include high-value decentralized finance, institutional asset issuance, tokenized RWAs, stablecoin settlement, and privacy-preserving financial infrastructure. These are sectors where Ethereum’s credible neutrality and security record serve as a commercial necessity rather than an abstract principle.
Galaxy also pointed to the need for Ethereum to move faster on narratives likely to define the next cycle, including layer-1 scaling, on-chain privacy, post-quantum security, and AI-native economic infrastructure.
While much of this technical architecture is documented in the open-source “Strawmap” development framework, the more complex challenge remains the coordination among commercial and institutional actors.
This coordination gap sits at the center of Ethereum’s current market friction.
The foundation’s Mandate provides a clear statement of base-layer engineering principles, but it does not provide capital markets with a simple answer on value accrual, nor does it create an entity designed to defend the asset against aggressive layer-1 competitors.
Consequently, the current drawdown has evolved into more than a simple price correction; it is an active test of whether a decentralized structure can distribute commercial responsibility across new institutions without losing operational coherence.
If the ecosystem can turn its current administrative churn into clearly defined roles and convert its technical roadmap into a concise asset case, this period of underperformance could serve as a necessary governance reset.
However, if it cannot, the market may continue to treat weak spot demand, senior departures, and the application-layer economic shift as evidence that Ethereum’s network strength no longer guarantees protection of the underlying token’s value.