Bitcoin (BTC) has slipped below the lowest band of the Bitcoin rainbow chart, the zone the original model bluntly labeled “Bitcoin is dead.” The asset now trades near $62,500, roughly half its October record.
Statistician George Box once wrote, “All models are wrong, but some are useful.” Stock-to-flow has already crossed from useful to broken. The question now is whether the rainbow chart is heading the same way.
Understanding Bitcoin’s Rainbow Chart
The rainbow chart plots Bitcoin’s price against a logarithmic regression band. Each colored band marks a sentiment zone. Red euphoria sits at the top, and deep value sits at the bottom.
The original version contains 10 bands. At its lowest, a purple strip carries the grim label “Bitcoin is dead.” Sliding into it has always signaled extreme pessimism.
A Reddit user first sketched the chart in 2014. A Bitcointalk contributor later paired it with logarithmic regression, which gave the bands their familiar shape.
For most of Bitcoin’s history, the gauge worked. Tops landed in the warm red bands, and bottoms landed in the cool blue and purple zones.
An updated version of Coinglass trims the model to nine bands. It drops the purple floor entirely, leaving “Fire sale!” as the bottom zone. Our explainer on the rainbow chart band model covers how these bands are built.
Today, Bitcoin sits below even that floor. Its live market price of about $62,500 has dropped through the “Fire sale!” band, outside the model’s defined range.
That has happened only once before, near the 2022 bear-market low. By one reading, the breach frames the current level as a rare deep-value entry point.
A deep-value reading assumes the model still works. Stock-to-flow shows why that assumption carries real risk.
The pseudonymous analyst PlanB introduced the stock-to-flow scarcity model in 2019. It tied Bitcoin’s price to its shrinking supply, with issuance halving after each halving.
For years, the fit looked convincing. Price oscillated around the model line through 2013, 2017, and 2021, which lent the framework real credibility.
Then it broke. After the 2024 halving, the model demanded roughly $500,000. Bitcoin instead peaked near $126,000 in October 2025, missing the target by about 75%.
PlanB pushed the projection further. He has suggested Bitcoin could near $5 million by the 2028 halving, a figure the current price makes hard to defend.
Critics point to a deeper flaw. The model tracks supply alone and ignores demand, the force that actually moves price during real market stress.
The stock-to-flow deflection chart measures price divided by the model’s value. For years, that ratio reverted toward one. Now it is collapsing toward zero.
A ratio grinding to zero means the error no longer corrects itself. The model now predicts a number that reality keeps ignoring, cycle after cycle.
George Box anticipated this outcome. A model can accurately describe the past and still fail to predict the future. Stock-to-flow has moved firmly into the wrong column.
Will the Bitcoin Rainbow Chart Follow?
The rainbow chart shows early symptoms of the same illness. Its weakness appears at both ends of the range, not just the floor. Past peaks in 2013, 2017, and 2021 pushed into the red “sell” bands near the top.
This cycle’s high reached only the green “Accumulate” zone, far below previous levels.
So price keeps undershooting the upper bands while now breaking the lower one. The band structure that once contained Bitcoin no longer holds it on either side.
Both models lean on relentless exponential growth. Yet Bitcoin is now a $1.25 trillion asset, and very large numbers compound more slowly over time.
That maturing growth curve is exactly what an aging exponential model fails to capture. The chart assumes tomorrow will look like the early years, and it may not.
This shift has a name among analysts. Many now favor a power-law view, where Bitcoin keeps rising but at a steadily slowing pace. A genuine recovery would pull the price back inside the bands and quiet the doubts. A long drift below them would suggest the model is breaking in real time.
Trading near $62,500, down about 3% on the day and 50% below its record, Bitcoin is clearly not dead. The model that was named that band might be.
Whether the rainbow chart joins Stock-to-Flow in retirement, or its longer-term price forecast still holds, is the question the next cycle will answer.
Despite the bears still being in control, the Bitcoin network is seeing a surge in transaction activity. Given the nature of this network activity, market participants may wonder whether the development is a bullish signal or a cause for concern.
According to this week’s CryptoQuant report, record-high transaction counts are driving the surge in Bitcoin network activity. The only issue is that these transactions have little, non-significant economic value.
Bitcoin Network Activity is Surging
CryptoQuant analysts explained that Bitcoin’s network activity turned sharply positive and broke above trend for the first time since late 2024. This is evident in the CryptoQuant Network Activity Index, which has been rising steadily since the beginning of this year. However, the index noted a major regime shift from March 2026, drawing a sharp contrast with bitcoin’s ongoing price decline.
Currently, the Bitcoin network activity is roughly 7% below its all-time high reached in September 2024. Both total daily transactions and average transactions per block are near their all-time high. Daily transactions have surged to levels above 800,000, hovering near readings of the 2023-2025 bull cycle.
“Mean transactions per block (right chart) have also risen sharply, reflecting high and sustained block utilization from the transaction count perspective. Both metrics have maintained elevated readings for several weeks, confirming the surge is structural,” analysts explained.
No Significant Economic Activity
Although these transactions are reaching yearly peaks, their economic content is significantly lower than surges from previous high-activity periods. About 80% of these micro-transactions are below 0.01 BTC, up from 50% in 2023. The sub-0.001 BTC cohorts have also skyrocketed in 2026, approaching prior peaks of 2024. The current dynamic reflects protocol-driven activity where volume is high but transferred value per transaction remains low.
Notably, the micro-transaction surge correlates with a rise in OP_RETURN opcode usage, which is used by data-inscription protocols like Runes and Ordinals. The opcode, which embeds up to 100,000 bytes of data without creating spendable outputs, has spiked to near-record levels this year. The protocols associated with the opcode generate high volumes of dust-value transactions, so this explains the low-value cohort surge.
Meanwhile, the surge in both micro-transactions and OP-RETURN has pushed the Bitcoin mempool to its highest transaction count since late February 2025. Analysts worry that this sustained expansion in non-financial on-chain activity could increase block space competition and raise fees for economic transactions.
Solana investors have changed their tactics in the past several days, as on-chain data shows a massive spike in SOL exchange inflows.
According to popular analyst Ali Martinez, such behavior could be the catalyst for a more profound price decline, possibly pushing the asset toward $50, a level not seen in almost three years.
600K SOL Reach Exchanges
Citing data from Glassnode, Martinez outlined the significant uptick in the number of SOL tokens that reached exchanges, going from about 27 million to over 27.6 million, meaning a 600,000 coin deposit. Similar developments suggest that “market participants are moving liquid supply out of private wallets, signaling rising caution around current price levels.”
He added that large-scale token transfers to trading platforms hint at potential de-risking or hedging from investors, potentially leading toward a “short-term drawdown.”
The analyst with over 165,000 followers on X warned that the $50 level might come into focus if this “spot supply triggers an immediate flush.”
“A localized pullback into this key zone would serve to fully absorb the short-term panic and clear the path for a healthy accumulation base before the next major expansion,” he added.
600,000 Solana $SOL were just deposited into trading platforms.
This rapid spike in exchange inflows indicates that market participants are moving liquid supply out of private wallets, signaling rising caution around current price levels.
Solana’s native token is up by over 4.5% in the past 24 hours, and has seemingly reclaimed the $70 support. However, fellow analyst Crypto Tony warned that the asset could drop toward $60 if this particular level gives in. The token slipped to $60 during the early June crash, but managed to defend that level. It hasn’t traded at Martinez’s lower target at $50 since late 2023.
Daan Crypto Trades also weighed in on SOL’s potential, but he focused on the BTC pair. He believes SOL is “attempting a breakout from this ralling wedge,” which could send it well above the current upper boundary of 0.0011 SAT. This became possible after SOL bounced from the lower boundary in early June at 0.001 SAT.
Despite last week’s controversial developments on the war front between Iran, the US, and several other nations involved in the conflict, Donald Trump promised on his social media platform minutes ago that a permanent deal is expected to be announced tomorrow.
Given bitcoin’s susceptibility to positive or negative news related to the war, the question now is whether it will benefit if Trump delivers on his promise.
In his lengthy post on Truth Social, the POTUS began by blaming the previous major deal signed with Iran during Barack Obama’s presidency. He called it a “smooth road to a Nuclear Weapon,” while his agreement with the Middle Eastern country is “the exact opposite.”
He emphasized that the new deal will serve as a “WALL TO NO NUCLEAR WEAPON.” Moreover, he claimed that Iran no longer wants to develop such a weapon, “nor will they have one, either through purchase, development, or any other form of procurement.”
Perhaps most importantly, Trump promised that the deal is “scheduled to get signed tomorrow, and immediately after it is signed, the Hormuz Strait is OPEN TO ALL.”
“We look forward to working with Iran, and the entire Middle East, long into the future. Hopefully, this process will all work out quickly, easily, and smoothly. If it doesn’t, we have the ultimate alternative, hopefully never to be used again,” he added.
Recall that bitcoin’s price was immediately impacted when the war started on February 28, with a painful decline by several grand. However, it skyrocketed once the first ceasefire deal was announced and when it was extended.
As such, the overall community sentiment has shifted after Trump’s post, with anticipation of a more profound recovery if, of course, the deal is actually signed tomorrow, because this is not the first similar promise made over the past few months.
A leading crypto analyst has further expressed their confidence that Dogecoin could be set for a bullish run in the current market cycle. This comes thanks to renewed buyer interest in the coin following its recent drop.
Rising Volume Signals Strong Demand for Dogecoin
In an X post, Crypto analyst Emilio Crypto Bojan described the latest drop in DOGE as a “generational entry” point. According to Bojan, trading volume began rising soon after the coin hit its low point, suggesting that many investors bought the dip rather than selling.
The meme coin fell by about 14% to $0.07763 during last week’s high-volatility period, when Bitcoin fell to $59,000. Bojan considers this a perfect moment to buy this coin at a low price.
Since then, DOGE has recovered to around $0.08529. The coin has also maintained strong interest among traders, with a 24-hour trading volume of about $812.7 million and a market value of roughly $14.5 billion.
Analysts are now closely watching the $0.099 price level. This is seen as an important resistance point for Dogecoin. Bojan believes that if the meme coin can move above $0.099 and stay there, it could confirm that buyers have regained control of the market. He expects the cryptocurrency to “pump hard” after reclaiming that level.
Meanwhile, data from Santiment shows that wallets holding between 100 million and 1 billion DOGE have been reducing their holdings in recent weeks. These wallets now control 23% of Dogecoin’s circulating supply. The decline marks the lowest level in five months.
At the same time, wallets holding more than 1 billion DOGE, which are often associated with crypto exchanges, have increased their share of the circulating supply. Their holdings have risen to 47%, suggesting high activity among retail investors.
Bullish DOGE Sentiment Builds Up Among Analysts
Another analyst, Trader Tardigrade, recently pointed to a chart pattern that mirrors Dogecoin’s historic bull cycle. The analyst noted that the coin appears to be repeating the same sequence seen between 2014 and 2017, where the coin went through a long consolidation period, followed by a falling wedge formation and then a breakout.
During the previous cycle, DOGE rallied by an astonishing 29,000% after the pattern was completed. Trader Tardigrade believes the current market structure looks quite similar, raising expectations that another powerful move could be developing.
Adding to the bullish outlook, Ali Martinez noted that Dogecoin recently reached his target price of $0.0883. He said the meme coin is now testing the lower boundary of its current trading channel, which could determine its next move.
As long as the coin remains above this support level, the analyst believes a recovery toward $0.1019 and possibly $0.1156 remains likely. At press time, the coin was valued at $0.08522, according to data from CoinMarketCap.
Ethereum’s slide to its lowest level in more than a year is testing the Wall Street trade that brought the token deeper into institutional portfolios.
Data from CryptoSlate shows that the second-largest cryptocurrency fell to as low as $1,506 during the last 24 hours, its weakest level since April 2025, extending a broad crypto selloff that has already drained leverage from derivatives markets and pushed traders toward defensive positioning.
Crucially, the downswing is not confined to ETH’s spot market as the digital asset is also experiencing a broader deterioration across regulated ETF flows, centralized exchange deposits, and derivatives positioning.
This situation comes at a time when the broader crypto market sentiment has significantly weakened, with Bitcoin falling toward a four-month low near $60,000, while Ethereum has erased much of its market support.
ETF outflows weaken Ethereum’s institutional bid
The pressure has been most visible in the ETF market, where the products that gave institutions a regulated way to buy Ethereum have turned into a source of persistent outflows.
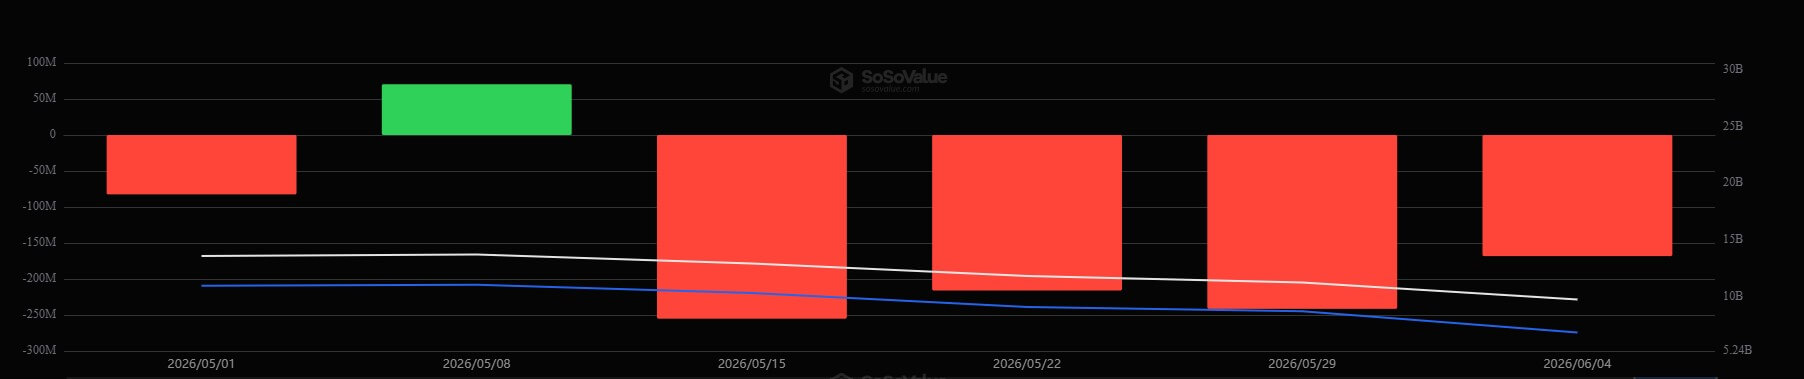
Data from SoSoValue shows that spot ETH ETFs have recorded four straight weeks of withdrawals totaling more than $870 million.
Ethereum ETFs Weekly Flows (Source: SoSoValue)
During that period, the funds posted a 17-day outflow streak interrupted by only one day of inflows, when investors added $19.3 million.
As a result, sosoValue data show total spot Ethereum ETF assets have declined more than 70% from their $30 billion peak to $8.71 billion, which is equal to about 4.01% of Ethereum’s circulating market capitalization.
The reversal has weakened one of the main arguments behind Ethereum’s institutional expansion. The ETFs were expected to broaden access to the asset, deepen liquidity, and give traditional investors a cleaner way to gain exposure without handling tokens directly.
However, that demand has softened as ETH’s price moved lower and investors have reduced risk across digital assets.
Exchange inflows add another supply risk
As institutional demand-side forces abated, the physical supply available on liquid trading platforms experienced a sudden and substantial expansion.
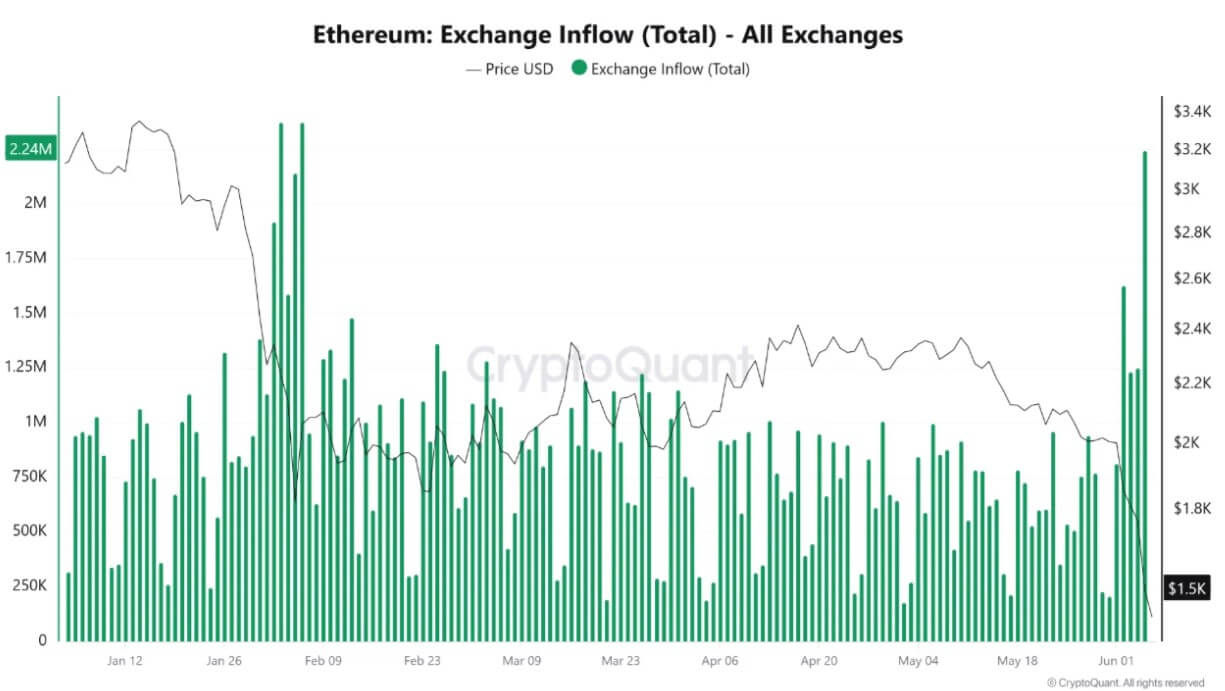
CryptoQuant data show Ethereum inflows to trading platforms climbed to about 2.24 million ETH in a single day, the highest level in four months. Binance accounted for more than 1.16 million ETH of those inflows, representing more than half of the total.
Ethereum Exchange Inflows (Source: CryptoQuant)
This surge in active supply can be seen in high-profile on-chain movements that served as glaring evidence of the liquidity migration.
Notably, a wallet linked to Ethereum co-founder Joseph Lubin awoke after more than three years of dormancy, mobilizing 80,001 ETH, valued at roughly $122 million.
The massive transfer epitomized the broader trend where long-inactive capital breaks from cold storage to seek out active trading venues and liquid architectures amid the mounting market stress.
Large inflows to trading platforms do not automatically mean investors are selling. They can reflect market-making activity, collateral movement, internal transfers, or portfolio restructuring during periods of stress.
However, traders watch the metric closely because coins held on exchanges are easier to sell or use in derivatives activity than coins sitting in private wallets.
The timing has made the increase harder to dismiss. Ethereum was already trading near $1,580 when the inflows accelerated, while Bitcoin had fallen toward $59,000. That combination suggested investors were moving assets during a marketwide reset rather than during a routine period of repositioning.
If exchange deposits remain elevated, the market could face additional short-term volatility.
Derivatives deleveraging deprives market of rebound capital
The velocity of the current crypto market decline has been accelerated by an extensive deleveraging cycle across leveraged futures platforms.
As spot valuations rapidly deteriorated, automated liquidation engines on major exchanges systematically closed out underwater long positions to protect clearinghouse integrity, amplifying organic selling pressure.
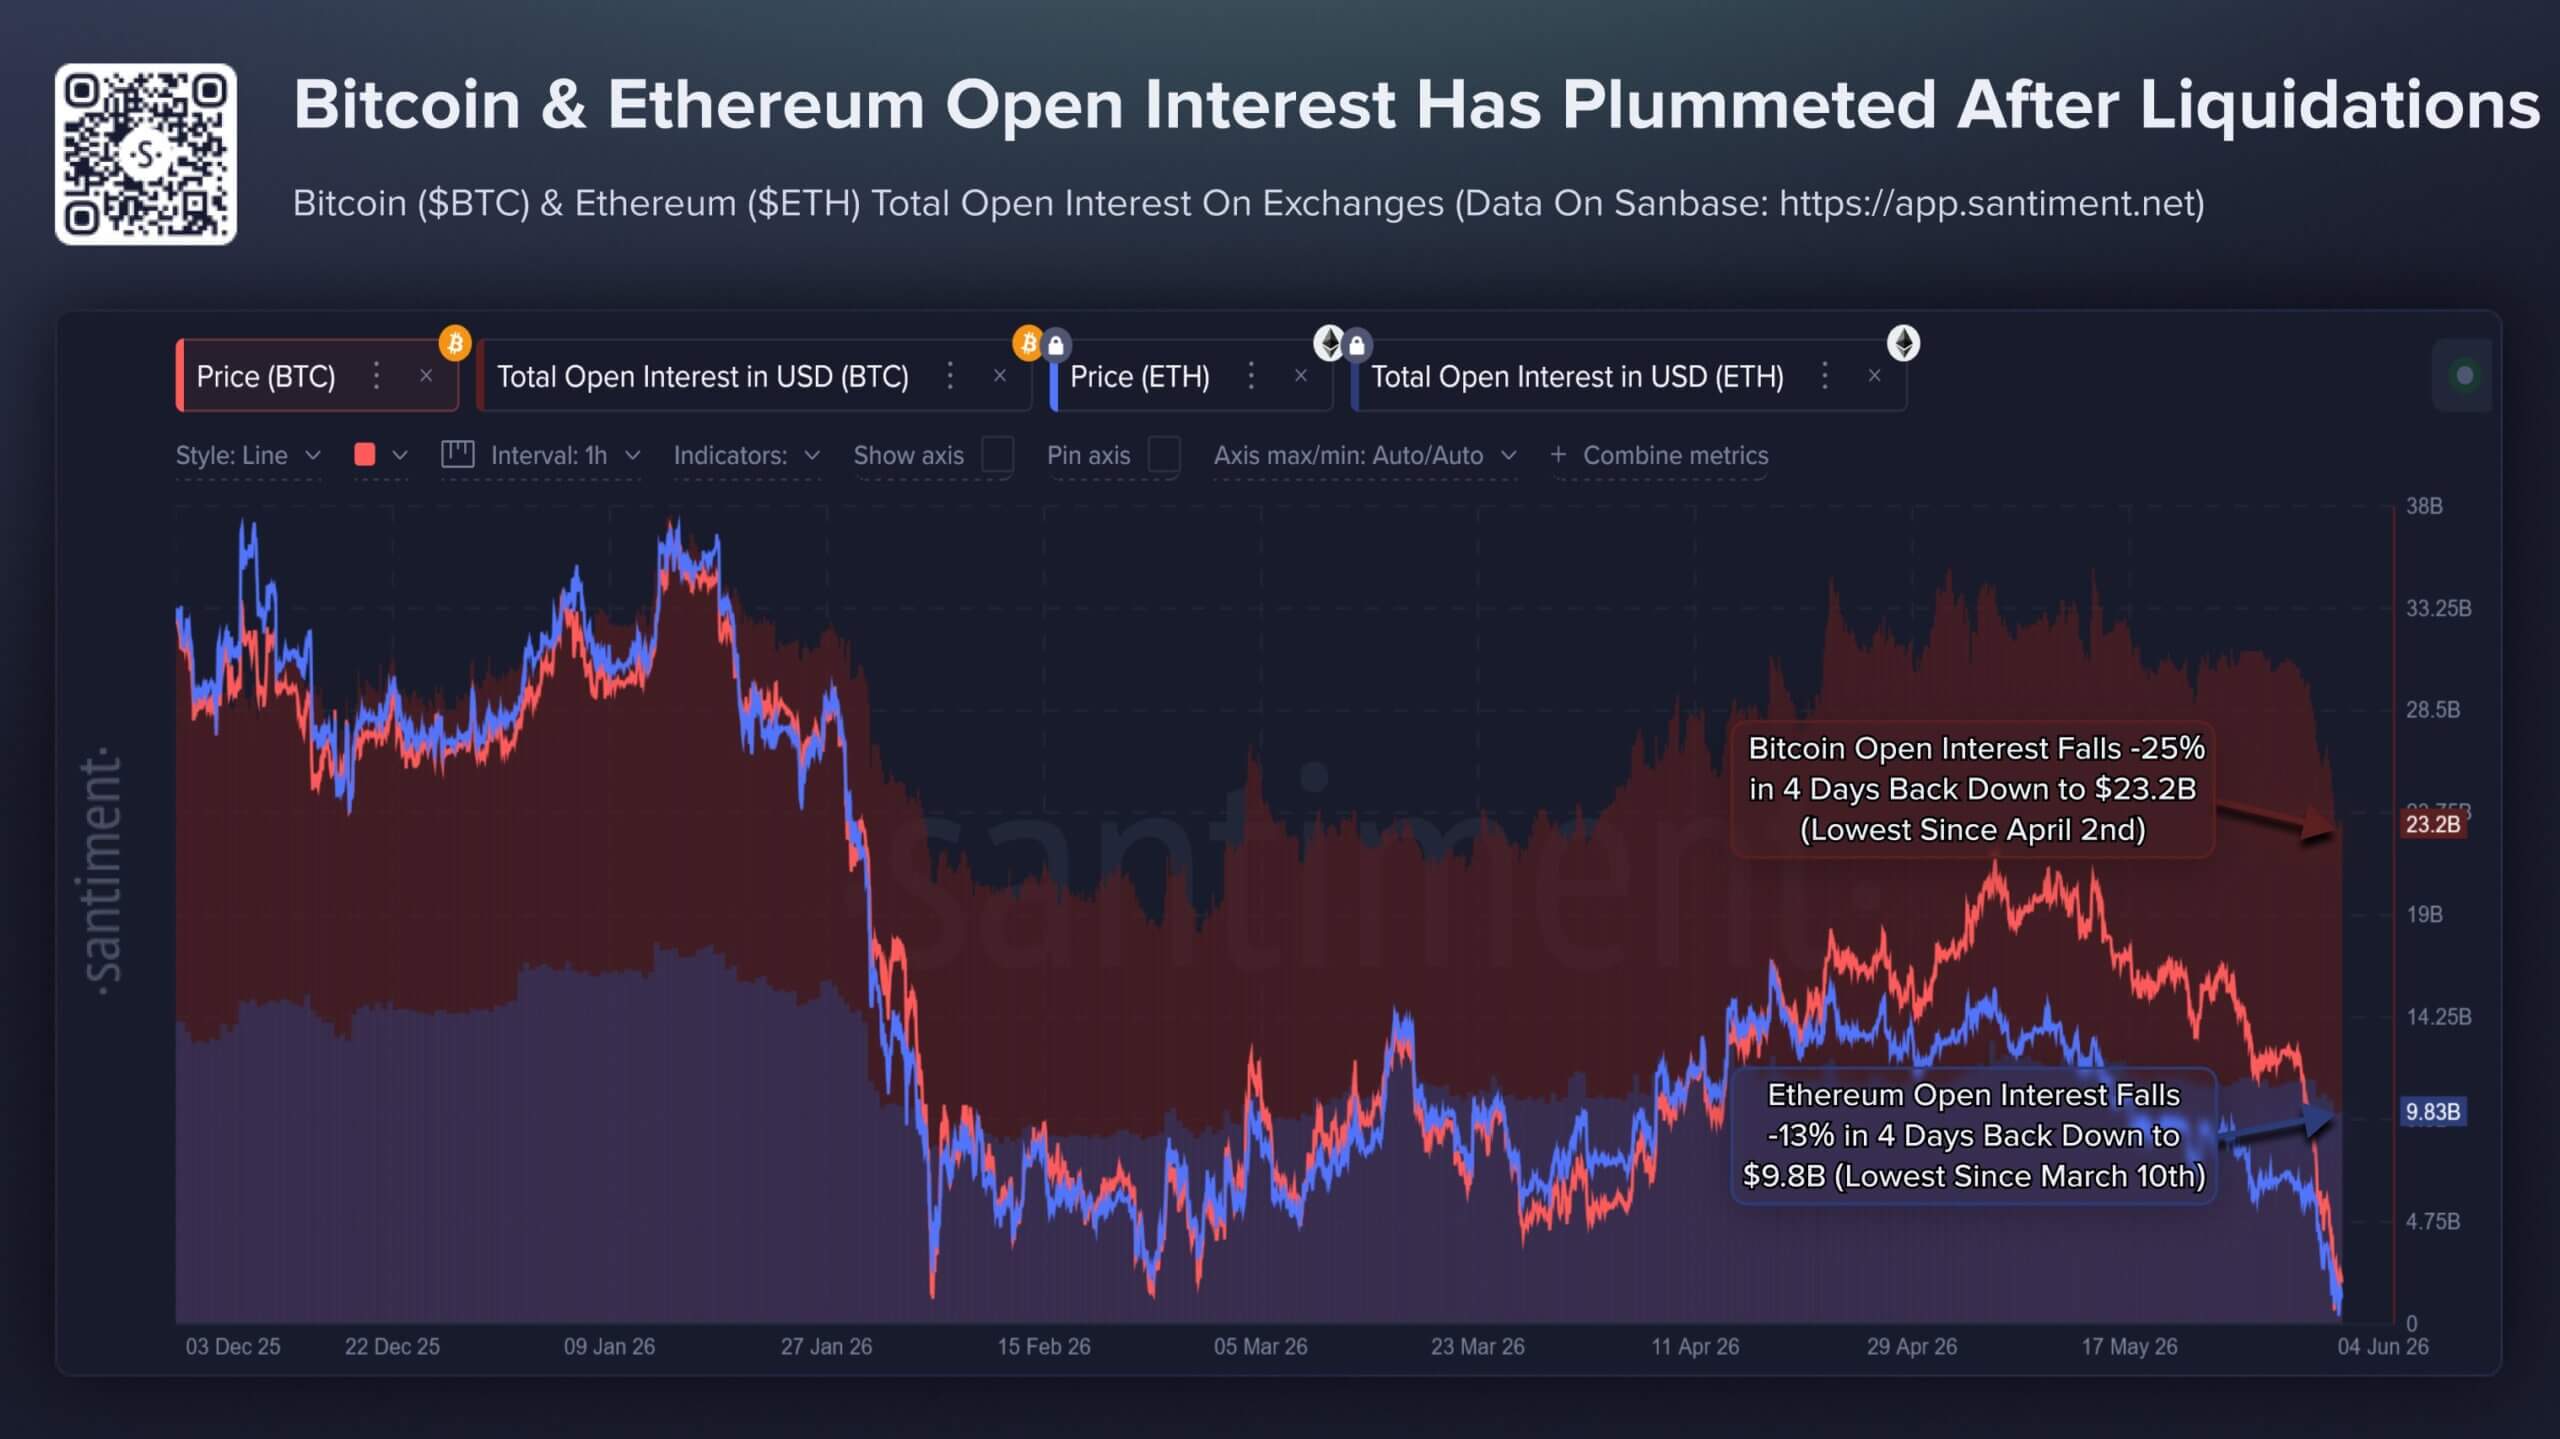
Data analyzed by Santiment illustrates that this liquidation wave effectively flushed out a massive block of speculative capital over a narrow four-day window:
Bitcoin Total Open Interest: Contracted by approximately 25%, dropping to $23.2 billion, which is its lowest operational aggregate since early April.
Ethereum Total Open Interest: Decreased by 13%, settling at $9.8 billion, a structural low point not seen since March.
Bitcoin and Ethereum Open Interest (Source: Santiment)
While this aggressive deleveraging leaves the underlying market structurally healthier by purging speculative excess and over-extended margin, it introduces an immediate liquidity vacuum.
The severe drop in open interest demonstrates that the speculative floor has thinned, leaving the market highly vulnerable to further spot pressure due to the lack of immediate leveraged capital available to front-run a classic V-shaped recovery.
Consequently, retail crowd sentiment has cratered to its most pessimistic footing since mid-February.
The firm noted that social metrics reveal an exponential increase in the phraseology of capitulation, with organic social discussions increasingly pairing terms like “Bitcoin” and “altcoins” alongside terminal descriptors such as “dead,” “finished,” “over,” and “ending.”
Traders hedge for a break below $1,500
The buildup of stress across ETFs, exchange flows, whale cost bases, and leveraged markets has shifted attention to ETH’s options market, where traders are paying more to protect against another leg lower.
Deribit data show demand for downside protection has increased sharply. The ETH options put-to-call premium rose to 3.7 times on Friday and has shown consistent excess demand for put options since Monday. Put contracts give holders the right to sell at a set price, making them a common hedge when traders expect further losses or want protection against a disorderly move.
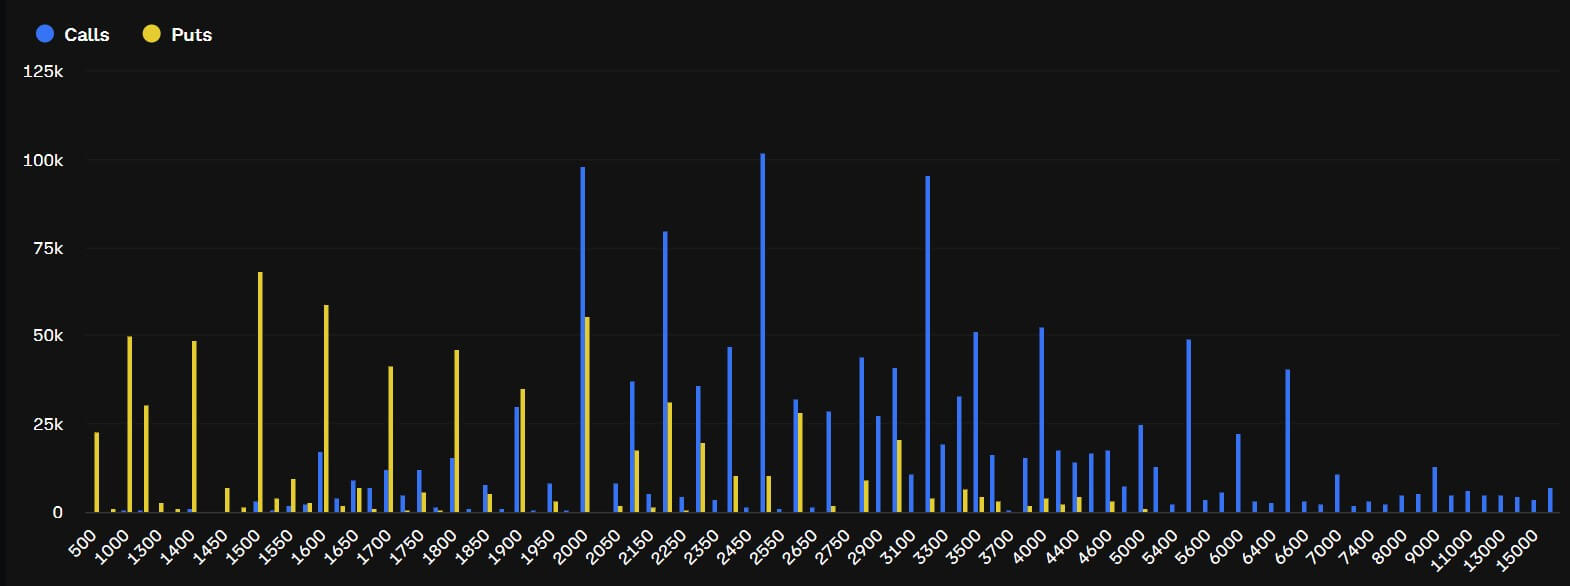
ETH’s open interest has clustered around several downside strikes. Traders have built roughly $108 million in open interest around the $1,500 strike, while the $1,400 strike has attracted about $75 million. The $1,000 strike has drawn about $78 million in positioning.
Those levels do not mean the market expects ETH to fall to $1,000 immediately. Instead, they show that traders are paying for protection after several support signals weakened at the same time.
BlockScholes data show the shift has also appeared in volatility pricing. ETH short-dated implied volatility has jumped from a year-to-date low of 36% to 67%, signaling that traders now expect larger near-term price swings.
The move has been accompanied by a sharper skew toward out-of-the-money puts. The seven-day ETH options skew has moved to about -14%, compared with roughly -3% to -4% in late May. Additionally, the demand for puts has also spread across 7-day, 14-day, 30-day, and 90-day maturities.
That broadening shows traders are not just hedging a single event or one short-term move. They are preparing for the possibility that Ethereum’s weakness could extend if ETF outflows continue, exchange inflows stay elevated, and large holders remain below key cost levels.
The next test is whether $1,500 becomes a floor or a trigger. A stabilization in ETF flows and a decline in exchange deposits could help ease pressure.
Without that, the options market’s focus on downside strikes may become the clearest signal of where traders expect the next phase of the selloff to concentrate.
The Shiba Inu (SHIB) price has remained under strong pressure this year as weak demand and fading market momentum continue to weigh on the meme coin. Beyond the price decline, new data now show that Shiba Inu’s Open Interest (OI) has crashed by more than 30%, while its burn rate has also slowed significantly. The decline in these key metrics points to weakening investor interest, lower trading activity, and reduced network engagement. Combined with Shiba Inu’s ongoing price struggles, these growing bearish signals have raised concerns about whether Shiba Inu is losing the strength that once made it the second-largest meme coin in the crypto market.
Shiba Inu Open Interest Crashes As Price Plummets
On May 27, data from Coinglass revealed that Shiba Inu’s Open Interest had dropped by 6% to $49.4 million, signaling weakness in futures activity and a decline in investor confidence in the meme coin. During the same period, Shiba Inu’s futures flow plunged by a staggering 190%, with outflows reaching $5.6 million, far exceeding the previous inflows of around $4.74 million.
Notably, this sharp decline pushed the net difference to $865,790 in total closed Shiba Inu contracts within 24 hours. The heavy outflow also wiped out roughly 156.56 billion SHIB tokens from the futures market, underscoring the ongoing decline in speculative trading activity.
Fast forward to today, Shiba Inu’s Open Interest has dropped an additional 5.6% to around $46.44 million. This suggests that traders are still closing positions at a rapid pace as bearish sentiment continues to dominate the market. The continued decline in leverage activity also reflects weakening sentiment among short-term investors, with many appearing unwilling to place strong bullish bets on SHIB’s near-term recovery.
This bearish shift comes as the meme coin’s price experiences prolonged volatility and market swings. According to CoinMarketCap’s data, Shiba Inu has been on a steady decline throughout this month. Its price has fallen by over 14% in the last 30 days and by more than 63% year-to-date.
At the time of writing, the meme coin remains in the red, with its recent price correction driven by increased selling pressure and a drop in Bitcoin’s price. Other factors contributing to SHIB’s low price are the broader weakness in the meme coin market, which has also affected coins like Dogecoin (DOGE).
SHIB Burn Rate Dwindles To Surprising Lows
Another metric that has surprisingly taken a hit is Shiba Inu’s burn rate. According to the meme coin’s burn tracker, Shibburn, just $2 worth of SHIB tokens were burned on May 26, highlighting a sharp slowdown in activity and adding more pressure to the already bearish market.
Notably, the Shiba Inu ecosystem is widely known for conducting large-scale token burns, with many community members believing that a continued decline in supply could create sufficient scarcity to support a future price explosion. However, recent on-chain reports now show that this usually active burn mechanism has taken a pause.
Shibburn also revealed that only about $11 worth of tokens were burned over the last 24 hours, representing just over 2.05 million SHIB. In the past week, less than $100 worth of tokens was removed from circulation, indicating weakening interest in the meme coin and a clear lack of interest in helping reduce SHIB’s supply.
Tuesday turned ugly for crypto markets, with a broad wave of selling hitting altcoins across the board, led by Zcash (ZEC), which dropped 11%, World Liberty Financial’s WLFI, which was down 8%, and Ondo Finance (ONDO), falling 7%.
The losses came against a backdrop of rising bearish sentiment in the crowd, which, according to blockchain analytics firm Santiment, has historically happened right before prices rebounded.
Details of the Sell-Off
Santiment flagged the damage in a post on X earlier today, noting drops in Ondo, Zcash, WLFI, and DeXe, among others.
For Ondo, the timing was particularly grim, seeing as the dip came right on the heels of the passing of 32-year-old founder and CEO Nathan Allman. The company announced that longtime President Ian De Bode will take over as CEO. The token is now trading near $0.41, putting its performance in the last seven days up by roughly 9%.
Zcash’s 11% single-day drop was the sharpest among the named losers, although at the time of writing the decline was at about 7.5% in the last 24 hours, with ZEC trading at around $570. For context, the asset is up 60% over the past month and nearly 970% across the last year, so the daily move looks less alarming against that backdrop.
Meanwhile, WLFI’s 8% dip added to a difficult stretch for the token, which hit a new all-time low in late April after crashing 16% in one day. It has had to navigate a controversial lock-up proposal, a lawsuit by Tron’s Justin Sun, and continued scrutiny over ties to the Trump family.
It Wasn’t All Red
Despite the losses mentioned above, the weekly picture looked different for some tokens. For example, NEAR was up more than 55% over seven days, and it was changing hands around the $2.50 level, although it pulled back nearly 8% on Tuesday alone. Another gainer was Hyperliquid’s HYPE token, which went up 25% per Santiment’s data.
However, the week’s standout was RAIN, which hit an all-time high of around $0.012 on Tuesday after climbing almost 55% for the week and over 44% in the last 24 hours alone.
Separate data from Santiment posted on the same day showed that bearish crowd expectations have been building for about 10 days now, with the firm noting that this kind of collective lean toward caution has historically heralded price recoveries, considering that markets tend to move against the crowd’s prevailing mood.
But traders will have to wait and see whether that plays out this time, especially with Bitcoin still stuck below $77,000 and struggling to break above its descending 200-day moving average near $80,000.
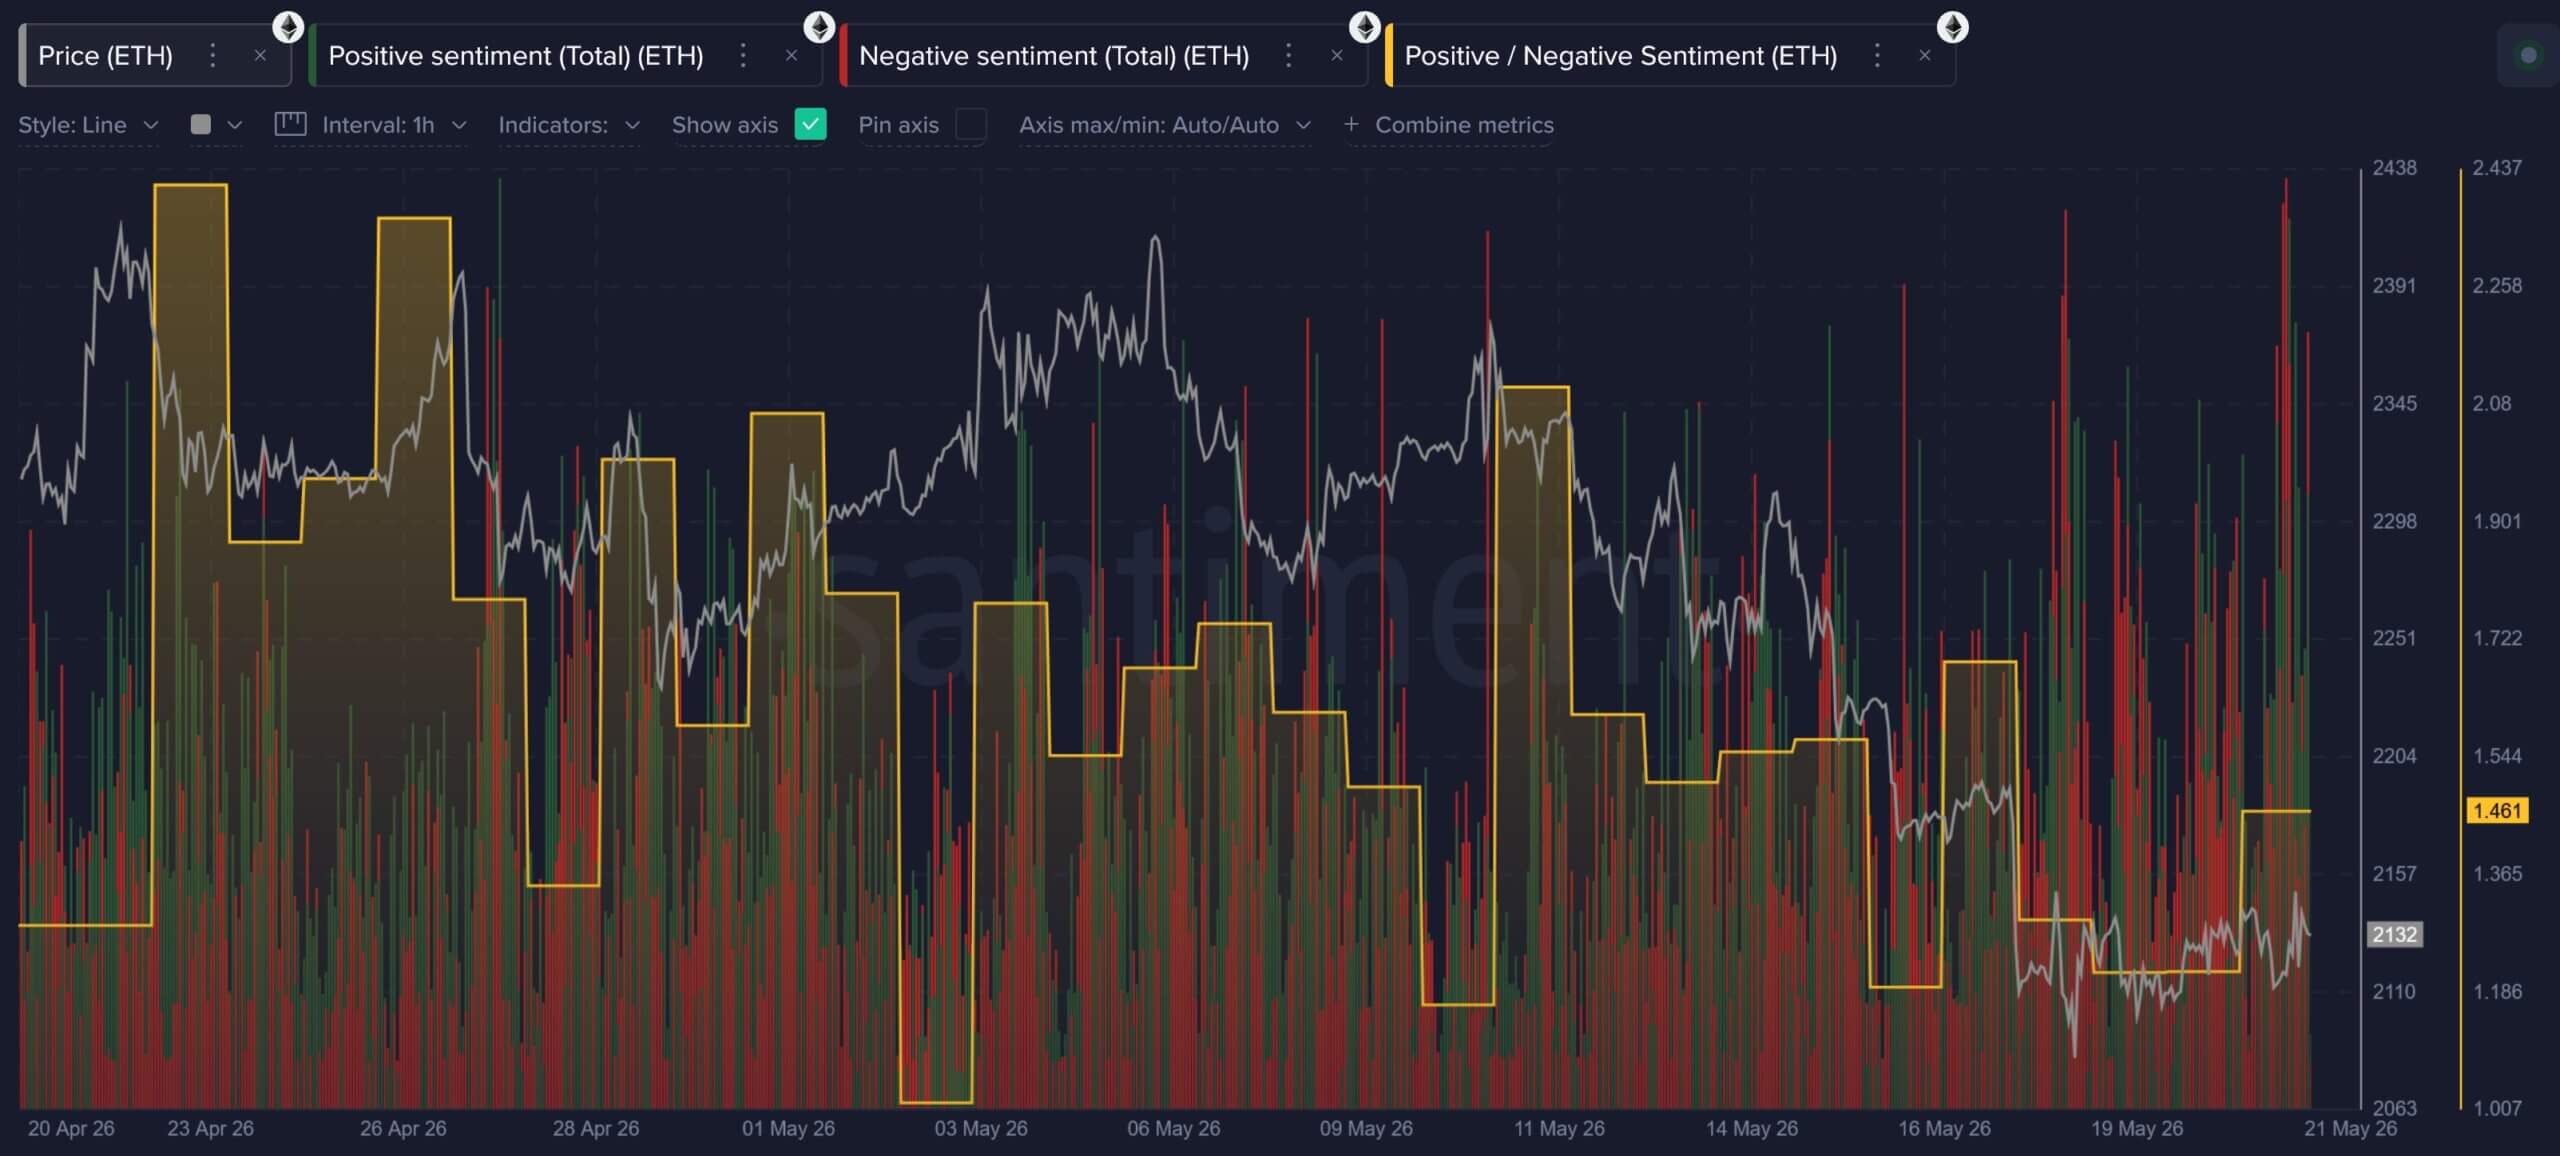
Ethereum’s market sentiment has deteriorated significantly as the blockchain network’s native ETH token moves through a medium-term bear phase.
Data from blockchain analytics platform Santiment shows that while ETH-related discussions increased in frequency throughout May, the tone of that commentary has shifted toward frustration, disappointment, and concern about deeper downside potential.
Ethereum Market Sentiment (Source: Santiment)
Analysts at the firm noted that this shift in sentiment reflects a combination of market pressures building simultaneously, including weak spot price action, persistent exchange-traded fund (ETF) outflows, high-profile departures from the Ethereum Foundation, public criticism from longtime ecosystem supporters, and stronger price momentum across competing layer-1 networks like Hyperliquid, Zcash, and Solana.
Broader market data from CryptoQuant reinforces this picture of institutional deceleration. The firm’s spot market and fundamental indicators point to severe structural weakness as ETH prices drop toward the critical $2,000 support level.
This has created a split-market identity in which spot investors are steadily reducing exposure, market liquidity has thinned, and institutional buying pressure has largely vanished from major trading desks.
Spot selling leaves Ethereum without a durable bid
Indeed, CryptoQuant’s fund-tracking data highlights the extent of the contraction in the institutional bid over the last two quarters.
According to the firm, total fund holdings, which peaked above 7 million ETH in October 2025, have steadily declined to a range around 5.5 million ETH.
This persistent unwinding indicates that large-scale allocators have systematically reduced their core exposure throughout the current multi-month drawdown.
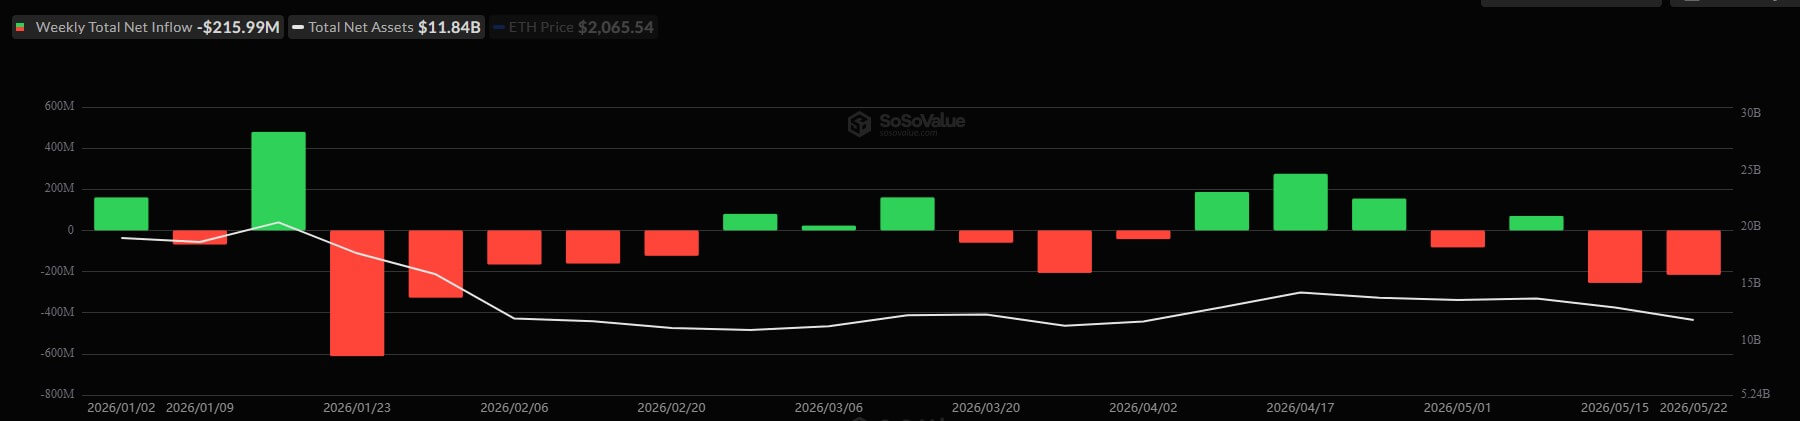
Notably, the regulated ETF market has reinforced this structural pressure. Total assets under management across Ethereum ETFs now stand near $12.14 billion, marking a 23% decline from their January peak.
Data from SoSoValue shows that May proved particularly challenging, with two consecutive weeks of net outflows totaling approximately $470 million, representing one of the largest episodes of concentrated capital flight of the year.
Ethereum ETFs Weekly Outflows (Source: SoSoValue)
This institutional withdrawal is further illustrated by the Coinbase Premium Index, which tracks the price disparity between Coinbase Pro and major offshore platforms.
The index remained negative throughout May, signaling an absence of spot demand from US institutional buyers.
At the same time, ETH liquidity has thinned alongside this reduction in fund reserves.
According to CryptoQuant, daily fund trading volume has trended downward since February 2026, dropping well below its trailing 1-year moving average to a recent range of $17 million to $42 million.
This volume compression points to a thinner spot market where dip-buying appetite has faded, leaving the asset highly exposed to volatility spikes during periods of negative news.
ETH options traders hedge as leveraged longs hold on
Beneath the spot market liquidation, derivatives data reveal an ongoing debate over whether ETH is breaking into a structural decline or forming a base for a leveraged rebound.
This disconnect has left the derivatives market divided, with professional traders aggressively hedging downside risk even as speculative perpetual futures traders maintain long positioning.
Data from Block Scholes reveals that ETH’s 25-delta risk reversal skew over a seven-day horizon has traded near-7%, indicating that options market participants are paying a premium for downside put protection.
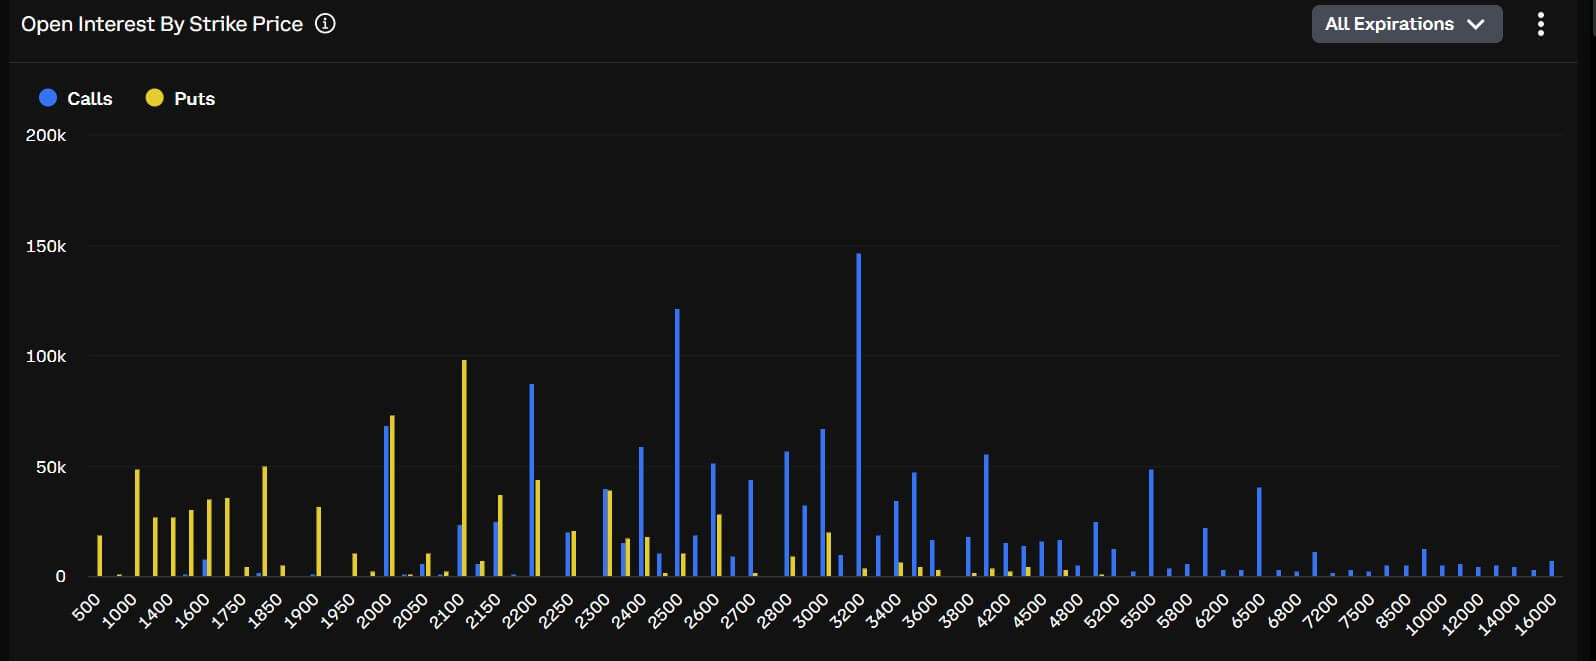
This defensive posture is supported by clearing data from the Deribit exchange, where open interest for put options targeting the $2,100 and $2,000 strike prices has concentrated past $380 million, placing those technical areas at the center of short-term institutional positioning.
ETH Options Traders Positioning (Source: Deribit)
Market Note: This concentrated options activity reflects a market preparing for extended weakness. Having already slipped below the $2,100 support shelf, Block Scholes’ risk appetite indexes show slowing momentum, leaving the asset dependent on defensive hedging in the absence of spot accumulation.
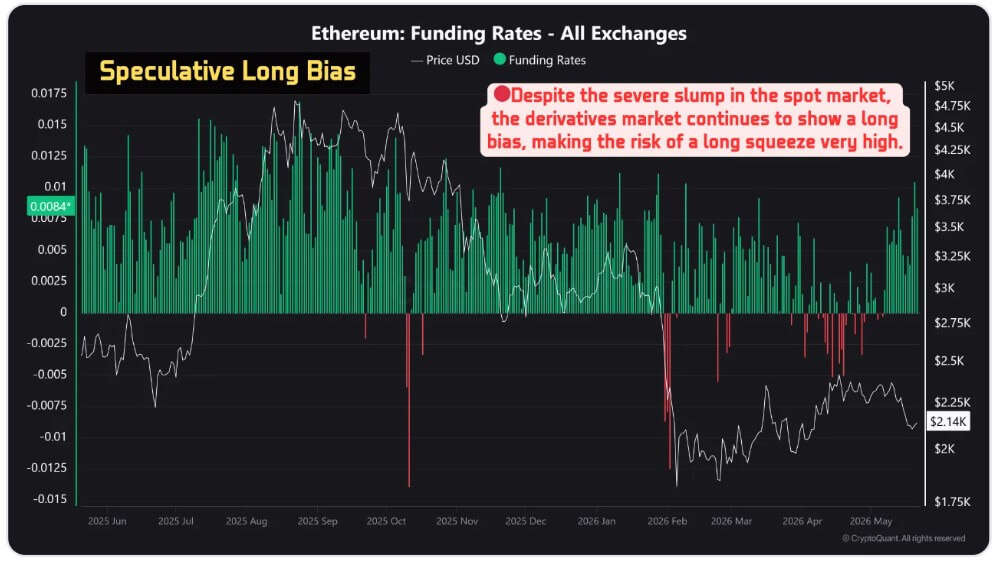
Concurrently, the perpetual futures market sends a more complicated signal. CryptoQuant data shows that Ethereum’s derivatives funding rate has settled firmly in positive territory, reaching 0.0082 on May 21, 2026.
Ethereum Funding Rates (Source: CryptoQuant)
This positive rate indicates that speculative long bias has not fully collapsed despite declines in market capitalization, fund holdings, and spot trading volume.
The resulting split identity creates a delicate technical backdrop: while options traders position for a breakdown, perpetual futures traders continue to hold leveraged long exposure.
This structural disconnect can fuel rapid short-squeezes if spot demand unexpectedly returns, but it significantly elevates the risk of cascading liquidations if the spot price breaches the heavy open interest concentrated at the $2,000 floor.
Ethereum Foundation exits collide with a weaker ETH value thesis
Ethereum’s financial underperformance has coincided with an acceleration of senior personnel departures from the Ethereum Foundation (EF), the Swiss non-profit entity that stewards the blockchain’s core development.
The internal churn intensified following the formal resignations of research veterans Carl Beek and Julian Ma. Beek had spent seven years focused on Beacon Chain design, while Ma authored the network’s Forwarding Oversight Committee for Incentivized Labs (FOCIL) framework.
Their departures bring the total number of senior exits or step-backs to at least nine since February, with five landing in May alone.
The list includes former co-Executive Director Tomasz Stańczak, board co-steward Josh Stark, Protocol Guild contributor Trent Van Epps, and protocol cluster leads Barnabé Monnot and Tim Beiko.
Additionally, senior researcher Alex Stokes recently commenced a three-month sabbatical, further thinning the organization’s visible technical leadership during a period of acute market stress.
Ecosystem analysts trace this administrative migration back to the publication of the foundation’s “Mandate” document in mid-March.
The 38-page framework codified the foundation’s dedication to “CROPS” principles: censorship resistance, open-source deployment, privacy, and base-layer security.
Crucially, the document framed the foundation as an ecosystem steward rather than a corporate enterprise, explicitly stating that its purpose is to protect network neutrality, not to maximize token price, optimize investor returns, or aggressively coordinate commercial expansion.
This neutrality-first posture has become increasingly difficult for parts of the market to accept as alternative networks capture speculative market share.
Tommy Shaughnessy, co-founder of Delphi Ventures, noted that the departures are more serious than they appear, adding that the exit of reform-minded personnel leaves fewer internal voices to challenge the foundation’s structural direction.
Reform calls test Ethereum’s neutrality-first model
The perceived lack of commercial execution by the foundation has prompted several prominent former insiders to call for structural governance reforms.
Dankrad Feist, a notable researcher who left the foundation last year to join the Stripe-backed layer-1 network Tempo, publicly advocated creating an entirely separate entity to safeguard the network’s economic relevance.
Feist proposed establishing an independent, alternative organization backed by at least $1 billion in capital, funded in part by network staking revenues. This proposed body would be directly accountable to token holders and expressly tasked with driving ETH’s financial adoption and market value.
According to him, this leaves the ecosystem without an agile institution incentivized to promote the asset in capital markets.
Bankless co-founder Ryan Sean Adams supported this view, stating that Ethereum’s future cannot depend solely on the foundation.
Adams argued that the ecosystem requires competitive, well-capitalized institutions dedicated to capital efficiency, aggressive communication, and commercial execution. These are roles the foundation was never structurally designed to fulfill.
The consensus among these reform proposals is not to replace the foundation, but to establish a dual-institution model: one to protect base-layer neutrality and public goods, and another to promote the asset and compete for institutional capital.
This push for reform has drawn a direct response from Ethereum bulls, who argue that the market is overreacting to short-term price action and natural organizational transitions.
ETH investor member Ryan Berckmans characterized the talent turnover as a healthy handoff to a younger generation of developers.
Berckmans argued that Ethereum has successfully navigated previous periods of regulatory pressure and leadership transitions while still delivering major upgrades like the Merge, blob transactions, and a dominant position in on-chain application capital.
He noted that the expanding deployment of stablecoins and tokenized assets by global corporations continues to support the network’s long-term trajectory.
This perspective is shared by substantial institutional holders.
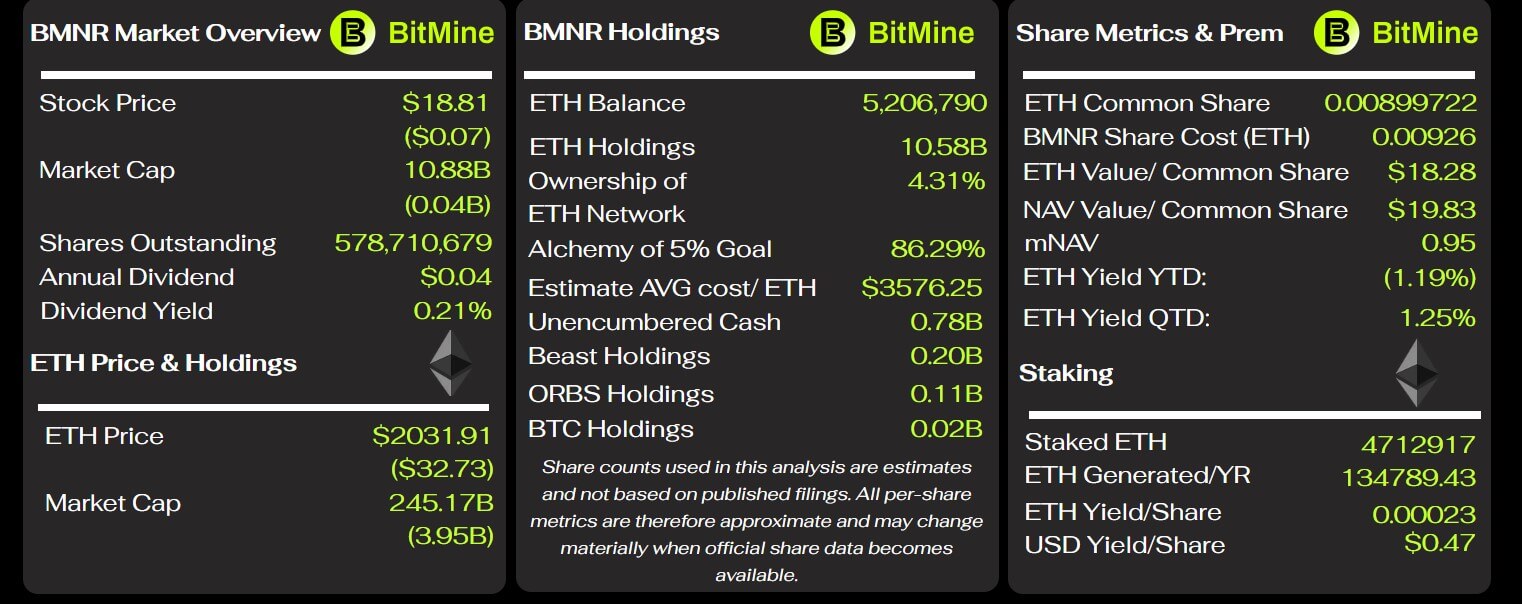
Thomas Lee, chairman of BitMine, dismissed the current market anxiety as typical cyclical capitulation. BitMIne is the largest publicly traded corporate holder of ETH, with a portfolio of 5.2 million ETH and over $10 billion actively staked tokens.
BitMine Key Metrics (Source: BitMine Tracker)
Lee asserted that blockchain infrastructure represents the foundational settlement highway for agentic artificial intelligence commerce and institutional finance, positions where Ethereum maintains a distinct structural advantage due to its established security record, deep liquidity, and institutional familiarity.
How Ethereum can recover from the current FUD
Market observers have noted that Ethereum’s near-term trajectory now hinges on whether its technical roadmap and commercial moats translate into a coherent investment thesis for ETH.
Strategic analysis from Galaxy Digital indicates that the network must execute a disciplined operational agenda to reverse ongoing capital flight.
According to Galaxy’s recovery framework, the immediate focus must center on shipping the Glamsterdam upgrade, keeping the subsequent Hegotá deployment on track, clarifying administrative responsibilities within the foundation, and concentrating resources on core commercial verticals.
These key areas include high-value decentralized finance, institutional asset issuance, tokenized RWAs, stablecoin settlement, and privacy-preserving financial infrastructure. These are sectors where Ethereum’s credible neutrality and security record serve as a commercial necessity rather than an abstract principle.
Galaxy also pointed to the need for Ethereum to move faster on narratives likely to define the next cycle, including layer-1 scaling, on-chain privacy, post-quantum security, and AI-native economic infrastructure.
While much of this technical architecture is documented in the open-source “Strawmap” development framework, the more complex challenge remains the coordination among commercial and institutional actors.
This coordination gap sits at the center of Ethereum’s current market friction.
The foundation’s Mandate provides a clear statement of base-layer engineering principles, but it does not provide capital markets with a simple answer on value accrual, nor does it create an entity designed to defend the asset against aggressive layer-1 competitors.
Consequently, the current drawdown has evolved into more than a simple price correction; it is an active test of whether a decentralized structure can distribute commercial responsibility across new institutions without losing operational coherence.
If the ecosystem can turn its current administrative churn into clearly defined roles and convert its technical roadmap into a concise asset case, this period of underperformance could serve as a necessary governance reset.
However, if it cannot, the market may continue to treat weak spot demand, senior departures, and the application-layer economic shift as evidence that Ethereum’s network strength no longer guarantees protection of the underlying token’s value.
Ethereum (ETH) has shed nearly 30% of its market value so far this year. Despite numerous recovery attempts, its market performance throughout May remained weak. Growing fear and frustration around the asset have become increasingly visible across social media and market activity.
According to Santiment, the downturn has not been driven by a single major negative event, but rather by several bearish narratives building at the same time.
Bearish Narratives Spiral
One of the clearest signs highlighted by the firm was the rise in Ethereum’s social dominance even as prices continued falling. While higher social dominance can often signal strong bullish attention during rallies, Santiment noted that Ethereum’s discussion volume surged after its April 17 local top precisely when the asset began losing momentum.
Instead of conversations centered around optimism or new highs, social media discussions were increasingly focused on disappointment, frustration, and concerns about further downside. Santiment also flagged a steady deterioration in sentiment ratios on social media platforms.
During late April, Ethereum maintained relatively strong sentiment levels, as it recorded more than two bullish comments for every bearish one. However, that ratio gradually declined throughout May until bullish and bearish commentary became nearly equal. The firm said this kind of sentiment erosion typically indicates weakening trader confidence in an asset’s short-term outlook.
Ethereum’s weak price performance itself has been one of the biggest contributors to the negative mood. Many traders have increasingly viewed ETH as “dead money” compared to assets that have shown stronger momentum during 2026, Santiment said in its latest post.
While Bitcoin has continued attracting institutional confidence and newer ecosystems have drawn speculative interest, Ethereum has struggled to regain the market leadership role it held in previous cycles. ETF flows also added to bearish sentiment. Several Ethereum exchange-traded funds reportedly recorded continued outflows throughout May, including significant withdrawals from BlackRock-related funds.
Santiment added that days with more than $50 million in net inflows, once relatively common for Ethereum ETFs, have not occurred for almost three weeks. Although ETF flows often follow sentiment rather than predict it, retail traders frequently interpret outflows as evidence that institutions are losing confidence in the asset, which further adds to fears already created by falling prices.
Negative headlines surrounding the Ethereum Foundation also contributed to the change in market mood. Reports about researcher departures and ongoing exits from the ecosystem spread widely across social media. Many traders see them as signs of instability within Ethereum’s leadership and development community.
At the same time, viral rumors claiming prominent Ethereum figures, such as David Hoffman, were reducing or exiting their ETH holdings further fueled uncertainty, even when some reports lacked full context. Santiment said such narratives can spread rapidly in crypto markets, especially when traders begin fearing that insiders are abandoning positions before the broader market reacts.
Contrarian Setup?
Competition from other blockchain ecosystems has also intensified pressure on Ethereum’s reputation. Data showed Ethereum still leads the crypto industry in raw development activity, as it generates millions of GitHub events and maintains one of the largest developer communities in the sector.
However, retail traders have increasingly prioritized short-term price performance over long-term development strength, while ecosystems such as Solana and BNB Chain continue to attract speculative enthusiasm. On-chain activity has weakened as well, with both daily active addresses and network growth declining from the high levels seen during Ethereum’s strongest rallies in 2024 and 2025.
Despite the overwhelmingly bearish environment, the firm said extreme pessimism can sometimes point to exhaustion among traders and potentially emerge near major market turning points.
“Growing bearishness may eventually become constructive from a contrarian perspective. Historically, markets tend to punish the crowd when consensus becomes too one-sided. Ethereum is now reaching a point where social media discussion has become overwhelmingly focused on reasons to abandon the asset. “


 Reached Peak Pessimism: Or Is More Pain Coming?")