The combination of an age-old UFO enigma in America with the crypto world has led to the holding of Bitcoins in Roswell, the capital of New Mexico, USA.
In this regard, on-chain analytics company Arkham Intelligence has drawn attention to the entity that apparently holds 0.173 BTC, worth $13,312.52. The timing and location of the event seem to have sparked discussions suggesting that aliens might be quietly collecting their Bitcoin hoard.
Roswell’s UFO legacy revisited through Bitcoin
Roswell became a global interest in 1947 when the United States Air Force issued a report stating that they found a “flying disc” in the vicinity of Roswell. This report, issued on July 8, 1947, sparked rumors about the crash of an alien spacecraft.
The military later denied their claim, explaining that the object was merely a piece of a weather balloon. Decades of witness claims, secret documents, and mysterious metallic remains have kept the story of Roswell alive.
This has contributed to the city becoming a hotspot for UFO conspiracy theorists. In fact, the city’s very logo exploits this extraterrestrial background, something crypto fans cannot ignore, given recent Bitcoin transactions.
In the last year, Roswell has become the first U.S. municipality to officially establish a Strategic Bitcoin Reserve via donations. The very first seed contribution, deposited on April 29, 2025, included 3,050,323 satoshis, equaling 0.0305 BTC and valued at around $2,906.
ALIENS ARE BUYING BITCOIN
The city of Roswell, New Mexico was the site of a famous UFO crash in 1947. The US Army Air Force announced possession of a “flying disc”, believed by many to be an alien spacecraft.
Anonymous subsequent contributions increased the balance to 0.173 BTC. The donations appear as deposits from various Bitcoin addresses, including some associated with regular retail wallets and services like Robinhood.
The city’s Arkham profile features a customized avatar combining extraterrestrial imagery with the Roswell Cosmicon logo. The reception of the first contribution has been signed by the mayor pro tem, Juliana Halvorson, and Bitcoin enthusiast Guy Malone.
The Arkham dashboard shows that the reserve is maintained on the Bitcoin blockchain and that there have been no outflows. The chart showing the evolution of balances shows a continuous increase since mid-2025, indicating that the total current market value is driven by Bitcoin price growth, not the municipality’s purchases.
Roswell passes landmark 10-year HODL ordinance
According to reports, the management of Roswell’s Bitcoin is regulated by a very restrictive municipal ordinance that prohibits quick selling of these digital currencies. All Bitcoin donations have to be held for at least 10 years.
After the fund exceeds $1 million in value, the city can spend no more than 21 percent of the funds annually. Such spending can take place once every five years. Uses of the Bitcoin reserve are highly restricted to two purposes only—subsidizing the payment of elderly people’s water bills and financing disaster relief efforts.
The announcement has led to a great deal of discussion on crypto forums. The Arkham blog post presented a provocative question: “Is this the first BTC in the possession of extraterrestrials?”
This prompted a number of comments suggesting that the original visitors from 1947 might have returned and diversified into Bitcoin. Another interesting point to note is that the irony of a city known for covering up a weather balloon as aliens is now amassing Bitcoins under the table. CoinDelisi, a Turkish crypto analyst, found a way to spin the story into an amusing tale, pointing out that, even though these are donated coins, they’ve become memes in the crypto community.
Do UFOs – now officially termed Unidentified Anomalous Phenomena – exist?
The Department of Defense created the All-domain Anomaly Resolution Office (AARO) in 2022 to research UAP in an evidence-based fashion. The first volume of AARO’s Historical Record Report, published in 2024, states that, over 80 years of investigation by various government bodies, there is no empirical evidence to support the theory of an extraterrestrial origin of any UAP incident or of the United States’ recovery and reverse engineering of alien spacecraft.
On February 21, 2026, President Donald Trump issued a directive ordering various government agencies to declassify any documents regarding UAP/UFOs and other matters related to extraterrestrials. In accordance with that directive, the Department of Defense (through the website war.gov/ufo) has published multiple batches of papers and videos (the first batch was released on May 8, 2026; the second on May 22, 2026).
Rising short positions across American stocks are starting to shape a different conversation around Bitcoin’s role in global markets.
According to CryptoQuant contributor XWIN Japan, a market increasingly built on hedging, concentrated AI trades, and heavy leverage could push more institutional capital toward BTC if liquidity conditions improve later in the year.
Wall Street Hedging and Bitcoin’s Changing Behavior
XWIN Japan argued in a market update published earlier today that the rise in US equity short interest does not necessarily point to outright bearish sentiment. Instead, hedge funds appear to be stacking defensive positions while keeping long exposure intact.
Per the crypto research institution, hedge fund gross leverage has climbed to around 293%, alongside record S&P 500 short exposure and elevated Days-to-Cover metrics.
Much of that pressure appears tied to heavy concentration in a handful of AI-related megacap stocks, while weaker sectors and smaller companies have been attracting shorter bets.
That backdrop matters for Bitcoin because it has historically traded closely with equities during market panics. For example, during the COVID-19 selloff in 2020, BTC fell alongside stocks rather than acting as a safe haven.
But according to XWIN, that relationship started to shift in 2025. While the S&P 500 has traded in a relatively tight range, BTC has shown larger swings tied to ETF demand, leverage activity, and crypto-native liquidity flows.
It concluded that going forward, Bitcoin may become a hybrid asset, still exposed to macro liquidity conditions, but more capable of moving on its own terms.
“If future conditions include Fed easing, weaker dollar conditions, and renewed ETF inflows,” XWIN wrote, “Bitcoin could become a secondary liquidity destination rather than simply a correlated tech-like asset.”
The OG crypto asset had fallen over the weekend to around $74,000 but rebounded above $77,000 as reports suggested developments toward a potential ceasefire agreement between the USA and Iran.
But as of the time of writing, data on CoinGecko showed it had dropped back below $77,000 by a few hundred dollars, leaving it down almost 30% over the past year.
On-Chain Activity Cools While Traders Watch Key Levels
Meanwhile, the current consolidation phase has seen Bitcoin’s network activity drop off sharply, with crypto analyst Ali Martinez revealing that active addresses fell nearly 40% in two weeks, from 821,000 to 494,000.
According to him, weaker activity during sideways price action often indicates short-term traders leaving the market, while longer-term holders retain supply.
He added that derivatives traders are increasingly positioned for a breakout, with funding rates recently touching 0.4%, their highest level in more than two months. On-chain data also showed large holders redistributing more than 18,000 BTC during the consolidation period.
Martinez identified resistance around $78,000 and support near $76,000, with a move above resistance, in his opinion, possibly opening the door toward $85,000, while losing support may send Bitcoin toward the mid-$60,000 range.
XRP has spent the better part of three months going nowhere while Bitcoin (BTC) climbed from around $60,000 to $80,000, and one chart analyst is done pretending otherwise.
According to them, the gap between community expectation and actual market performance has rarely looked wider.
XRP Has Been Losing Ground to Bitcoin Since 2017
UK-based technical analyst ChartNerd laid it out plainly in a post on Monday:
“I’m sorry to break this to my $XRP community. I’m just tired of the constant hopium: we have been underperforming Bitcoin since 2017, with NO signs of any major rotation. In fact, over the last 3 months, BTC has climbed 60K-80K while $XRP/BTC has lost its 20 MEMA.”
That 20-period exponential moving average on the XRP/BTC pair is a metric traders use to track medium-term momentum in one asset relative to another. Losing it, as ChartNerd’s chart shows, puts the pair back toward the bottom of its long-term range.
Historically, that lower zone is where XRP has delivered its most explosive outperformance against Bitcoin, including the one in November 2024. But the analyst is careful not to spin that as a near-term buy signal. The pattern has to confirm first, and right now, the breakdown is what has confirmed.
“While BTC has climbed 60-80K, $XRP has done nothing but trend sideways, all while the XRP/BTC pair is breaking down,” ChartNerd added in a follow-up post.
In a separate May 21 update, the analyst noted the XRP/BTC pair had been declining for 15 consecutive weeks, directly explaining why XRP’s USD price had gone essentially flat over the same period.
“I expect $XRP will likely underperform against Bitcoin for the majority of the year,” he wrote.
Subdued Short-Term Outlook
The short-term picture is similarly subdued, with XRP trading around $1.36 at the time of writing, within a tight 24-hour range of $1.34 to $1.37.
ChartNerd has identified $1.30 as a key support level, and he expects resistance in the $1.40 territory on any recovery attempt, describing that zone as a potential support/resistance flip.
His longer-range bear case points toward the $0.90-$0.70 area if broader conditions deteriorate, while he has noted that XRP’s 2-week regression band lower boundary is currently sitting near $1.00.
Bitcoin, meanwhile, is trading around $77,000 after a rough stretch that saw it drop to just above $74,000 last week. However, it has recovered on news of progress in US-Iran peace talks, and its dominance over the rest of crypto has remained above 58%.
That high dominance figure is itself part of what is weighing on XRP and most altcoins: when Bitcoin is absorbing the majority of capital flow, altcoins tend to lag.
Bitcoin remains under bearish pressure after failing to sustain momentum above the critical $80K-$82K resistance region. However, recent price action suggests buyers are attempting to defend the important $75K support zone, increasing the probability of a short-term corrective rebound before the broader downtrend resumes.
While the market structure still favors sellers, the current positioning near key support and liquidity clusters could trigger a temporary bullish correction in the coming sessions.
Bitcoin Price Analysis: The Daily Chart
On the daily timeframe, BTC has entered a corrective phase after being rejected from the major supply zone around $82K-$84K, which also aligned with the upper boundary of the ascending channel. The rejection accelerated selling pressure and pushed the asset toward the important demand area at $75K-$76K.
Recently, the price swept below the $75K support region before quickly recovering, suggesting active buyer interest and potential liquidity collection beneath local lows. This recovery has led to a modest bullish reaction, with BTC currently attempting to stabilize above the $76K area.
Despite this rebound, the broader structure remains cautious. Bitcoin is still trading beneath previous support turned resistance, and as long as Bitcoin remains below the $80K-$82K region, any upside movement may simply represent a corrective pullback within a larger bearish retracement.
The first upside target for a relief rally sits around $78K-$80K, while stronger resistance remains at $82K-$84K. Failure to reclaim these levels could increase the probability of another bearish leg toward the next major daily demand zone around $70K-$71K. A deeper breakdown may eventually expose the lower support area near $65K-$66K.
BTC/USDT 4-Hour Chart
The 4-hour chart highlights a clearer short-term recovery attempt. After reaching the $75K-$76K order block, Bitcoin generated a sharp bounce and is now consolidating around $76K-$77K.
This reaction indicates that buyers are defending the local support area, potentially setting the stage for a corrective move higher. If momentum persists, the first pullback target lies near the $78K-$79K range, followed by the more significant resistance zone around $80K-$82K.
However, the broader lower-high formation remains intact, and recent price action still reflects weakening bullish momentum compared to earlier recovery phases. As a result, the current rebound could evolve into a classic bearish continuation setup, where price revisits resistance before initiating another decline.
For bulls to regain control, Bitcoin would need to reclaim the $80K-$82K region convincingly. Otherwise, the current move is more likely to be interpreted as temporary relief rather than a trend reversal.
Sentiment Analysis
The liquidation heatmap provides additional context supporting the corrective-bounce scenario. A notable concentration of short liquidations has accumulated above the current price, particularly within the $80K-$85K region.
Markets often gravitate toward nearby liquidity pools before resuming the prevailing trend. Therefore, Bitcoin may first move higher to absorb these leveraged short positions, potentially fueling a squeeze toward the $80K-$82K resistance area.
At the same time, substantial liquidity clusters remain below price around the $60K-$63K region, indicating that downside targets continue to exist if bearish momentum returns after the correction.
This creates a two-step scenario: an initial bullish retracement driven by liquidation hunting toward $80K-$82K, followed by renewed selling pressure and another bearish leg toward lower support levels. The interaction between price and these liquidity zones will likely determine Bitcoin’s next major move.
A recent TradingView technical outlook suggests Bitcoin remains locked beneath a stubborn upper trendline resistance that continues to suppress bullish momentum. Despite several recovery attempts, BTC has repeatedly failed to break through the resistance zone, causing speculations that the price could push below $60,000.
Bitcoin Trapped Beneath A Heavy Ceiling
The TradingView chart highlights how this upper trendline has consistently acted as a ceiling for price action, rejecting Bitcoin each time buyers attempt to push higher. That resistance area also overlaps with key Fibonacci retracement levels, making it an increasingly important barrier within the current market structure.
Current price action appears to support that outlook. Bitcoin has struggled to sustain upside momentum and recently slipped lower after another rejection near the top of the rising formation. Attention is now shifting toward the $73,000 to $75,000 support region, which analysts view as critical for maintaining the broader bullish structure.
The setup also shows a narrowing wedge-like recovery structure developing after Bitcoin’s earlier selloff. However, rather than breaking upward decisively, BTC has started rolling over near resistance once again, signaling that the market still lacks the momentum needed to overpower the upper trendline.
This weakness is already becoming visible across broader market performance metrics. Bitcoin remains under pressure on higher timeframes and has recorded losses across the weekly and 14-day charts. For bullish momentum to regain strength, analysts say Bitcoin must finally break above the upper trendline resistance with strong conviction. Until that happens, the current price action continues to reinforce the idea that the trendline ceiling remains firmly in control of the market.
Can Bitcoin Crash Below $60,000?
While the dominant outlook favours Bitcoin breaking the upper trendline to regain bullish momentum, analysts are not dismissing the possibility of a much deeper flush if key supports collapse. The immediate downside focus sits between $69,000 and $66,000, where another major support region intersects with the rising trendline structure from previous swing lows. A move into that range would likely represent an aggressive but technically acceptable retracement within the broader cycle.
The more concerning scenario emerges if Bitcoin loses the $66,000 threshold entirely. According to the chart, that breakdown would invalidate the current ascending support framework and potentially trigger a broader risk-off reaction across crypto markets.
In that situation, volatility could increase rapidly. Liquidity gaps below current price levels may expose Bitcoin to a sharp capitulation move capable of driving price beneath $60,000 before stronger demand returns. There is also a hint at the possibility of a panic-driven wick stretching toward the low-$50,000 region if market conditions deteriorate aggressively.
For now, however, the market remains at an inflection point rather than in confirmed collapse. The behavior of buyers around the $73,000 to $75,000 area will likely determine whether Bitcoin resumes its climb toward six-figure territory or slides into a much deeper corrective phase.
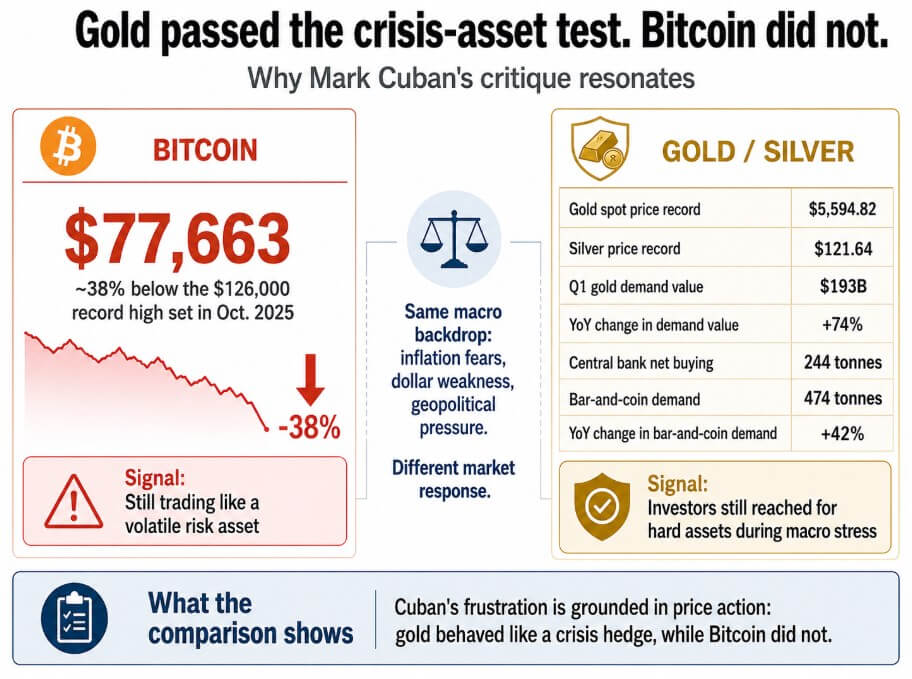
Mark Cuban sold most of his Bitcoin because it failed to provide a hedge when fiat confidence weakened and geopolitical risk rose.
Cuban called it “not the hedge I expected it to be,” and the price record supports his frustration. Bitcoin traded around $77,663 in mid-May 2026, roughly 38% below the record high of $126,000 set in early October 2025.
Spot gold hit a record $5,594.82 on Jan. 29, while silver touched $121.64 the same day, driven by the same macro variables Cuban cited: inflation fears, dollar weakness, and geopolitical pressure.
World Gold Council data shows that gold demand in the first quarter reached 1,231 tonnes, including OTC, and the dollar value of quarterly demand jumped 74% year over year to a record $193 billion.
Central banks bought 244 tonnes net in the same period, and bar-and-coin demand hit 474 tonnes, up 42% year over year. Cuban also told Portfolio Players he is moving more money into Ethereum than Bitcoin, but the hedge critique is specific to Bitcoin.
Under the same macro backdrop of inflation fears and dollar weakness, gold hit a record $5,594.82 while Bitcoin traded 38% below its all-time high.
The ‘digital gold’ pitch always had a problem
Bitcoin.org describes the asset as peer-to-peer money with no central authority or banks and specifies that issuance halves over time, eventually stopping at 21 million Bitcoin. Nothing in that description commits Bitcoin to rising when geopolitical stress rises.
Cuban built a thesis on the “digital gold” narrative that the market constructed and the Bitcoin whitepaper never endorsed.
Bitcoin has traded as a liquidity-sensitive, high-beta asset that correlates with the Nasdaq during risk-off episodes and surges when risk appetite returns.
Last year, crypto moved with broader equities through the April tariff shock before Bitcoin hit its October record, then suffered a major leverage wipeout. More recently, Glassnode’s May 20 report describes Bitcoin as structurally resilient but notes that spot demand has weakened, ETF accumulation has slowed, and options positioning has turned defensive.
Cuban applied a gold benchmark to an asset that has never consistently moved like gold, and the resulting distance between what he expected and what the price did is what drove him to sell.
Test
Gold
Bitcoin
Crisis behavior
Cleaner panic shelter
Often sells off with risk assets
Volatility profile
Lower, more established
Much higher, adoption-sensitive
Main demand driver
Inflation fear, geopolitics, central banks
ETF flows, liquidity, regulation, leverage cycles
Monetary property
No issuer, physical scarcity
21M cap, no central issuer, permissionless transfer
Best framing
Crisis shelter now
Monetary optionality later
Bitcoin long-term holder supply rose by over 2 million BTC during the current drawdown, reaching 16.3 million BTC, with roughly 200,000 BTC added in the past month alone. Cuban is judging Bitcoin by whether it acts like gold in a crisis, while long-term holders are judging it by whether the network still functions and the supply cap holds ten years from now.
A hedge reduces portfolio risk during stress events with some consistency, but Bitcoin’s realized volatility runs far above gold’s, its price responds to ETF flows, regulatory headlines, and leverage cycles, and it has repeatedly correlated with equity drawdowns during acute stress.
Those are the mechanics of an early-stage monetary network still pricing in adoption uncertainty, with an asset that may be powerful over a long horizon precisely because it is too volatile and too liquidity-sensitive to function as a short-term panic hedge.
Investors reach for Bitcoin, if the adoption thesis holds, when they expect the monetary system itself to look different in the next decade. The fixed supply, permissionless transferability, and absence of a central issuer are the properties that make Bitcoin worth considering as long-duration monetary optionality.
The distance between $58,000 and $165,000
Citi’s March 2026 forecast is a 12-month base target of $112,000, a recessionary downside of $58,000, and a bull case of $165,000, which captures how wide the resulting uncertainty runs.
Glassnode places the Realized Price near $54,900 as a lower structural boundary, while the $70,000 level carries weight as the pre-election anchor.
Scenario
BTC level / range
Market logic
Narrative outcome
Structural floor
~$54,900
Realized Price lower boundary
Break below here weakens the adoption case
Recessionary bear case
$58,000
Higher yields, ETF outflows, weak spot demand
Bitcoin trades like a de-risking asset
Key anchor
$70,000
Pre-election reference level
Market tests whether support is real
Base case
$112,000
Citi 12-month target
Bitcoin survives as volatile monetary optionality
Bull case
$165,000
ETF demand, regulation, risk appetite recover
Adoption thesis absorbs the hedge failure
In the bear case, higher yields, continued ETF outflows, and weak spot demand keep Bitcoin pinned near structural support.
Bitcoin trades like a de-risking asset, fails to distinguish itself from the broader risk-off environment, and gold continues to absorb the crisis-hedge flows that Bitcoin’s marketing promised to capture.
In the bull case, ETF demand recovers, regulatory progress in the US provides institutions with cleaner on-ramps, and risk appetite returns enough to push Bitcoin back through the $112,000 Citi target and toward $165,000.
Bitcoin survives the critique by operating as a scarce, borderless, permissionless monetary network that gains value as more institutions and sovereigns want an asset outside traditional finance.
The 21 million supply cap and the absence of a central issuer are the properties that make Bitcoin worth holding as a long-duration bet on monetary distrust becoming infrastructure, and those properties held through the same drawdown Cuban is citing as proof of failure.
Bitcoin’s actual case rests on offering exposure to a world where more people want money outside the traditional system, which holds regardless of how Bitcoin performs against gold in any given crisis.
Bitcoin as a call option on monetary distrust
Cuban wanted Bitcoin to act like a predictable and consistent protection against the specific risks he saw coming.
Yet, Bitcoin may be closer to a call option on monetary distrust: valuable if the thesis plays out over a decade, volatile in the meantime, and a poor substitute for gold during acute stress.
Gold is still the cleaner crisis asset by every recent measure, shown through record prices, record quarterly demand value, sustained central bank buying, and consistent performance against the macro variables that define genuine panic.
The asset Cuban sold most of his stake still has a 21 million supply cap, still operates without a central issuer, and still accumulated 200,000 BTC of long-term holder supply in the past month.
Whether that is enough to justify the price range of $58,000 to $165,000 over the next year depends on whether the adoption thesis can replenish what the hedge thesis has lost.
Laszlo Hanyecz, a programmer, created history on May 22, 2010, when he spent 10,000 Bitcoin on two pizzas. The trade was valued at about $41(market cap under US$1M) at the time.
According to Binance, the 10,000 Bitcoins would be valued well over $700m (market cap over US$1.5T) now. In August 2025, when BTC price was at an all-time high of $126k, the coins would be worth more than $1 billion.
The amount now represents over 22 days of current issuance, given today’s block subsidy of approximately 450 BTC per day.
Major price milestones for Bitcoin have been reached amid dwindling new supply. At Pizza Day, roughly 14% of the total BTC supply had been mined. By the time BTC first traded above US$100 in 2013, this had risen to around 53%. According to Binance, nearly 80% had been mined by US$10K in November 2017, and over 94% by US$100K in December 2024.
This illustrates how Bitcoin’s issuance schedule is structurally diminishing. The supply curve flattens with each halving as daily issuance declines from 7,200 BTC per day during the Pizza Day era to 450 BTC presently and 225 BTC following the anticipated April 2028 halving. The remaining mineable Bitcoin represents a diminishing source of fresh supply versus any future growth in demand, since more than 94% of the total supply is currently in circulation.
Bitcoin Pizza Day shows global Bitcoin purchasing power after 16 years
To mark Bitcoin Pizza Day 2026, Binance used the initial pizza purchase as a lens to analyze the current crypto economy, highlighting how Bitcoin’s purchasing power has grown across major global cities. The comparison highlights how digital assets now interact with real estate, mobility, and daily consumption at scale, from Mumbai and Dubai to New York, London, and Tokyo.
Binance said that 10,000 BTC in Mumbai could purchase tens of millions of cups of chai and extensive access to commuter rail systems with thousands of years of journeys. The coins could also have major commercial real estate space in the city’s business districts,
In Dubai, the same sum could buy more than 12 million shawarmas, hundreds of luxury desert adventures, and dozens of ultra-luxury Palm Jumeira Villas.
The 10,000 BTC could purchase approximately 22 million slices of pizza, over 3,000 of Manhattan studio apartments, and enough subway rides to circle the city for generations.
In London, the same sum could purchase over 8 million pints at London pubs, several Premier League hospitality boxes for every match of the season, and purchase entire rows of townhouses in some boroughs.
Binance further said that the coins could buy millions of sushi plates in Tokyo, purchase thousands of high-speed rail journeys across Japan, and could also purchase entire floors in some central Tokyo apartment buildings.
Institutional adoption drives Bitcoin’s shift toward global infrastructure
Beyond the illustrative analogies, the larger message is that Bitcoin has shifted from novelty to infrastructure. Adoption patterns are increasingly influenced by both institutional involvement and grassroots usage in both established and emerging nations as digital assets continue to become integrated into payments, investment, and remittance flows.
SB Seker, Head of APAC at Binance, emphasized this evolution, noting, “Bitcoin Pizza Day has become one of crypto’s most celebrated traditions because it captures something essential: innovation happens when someone is willing to try something new, even if it seems impractical at the time. In 2010, Laszlo Hanyecz used Bitcoin to buy pizza because he believed digital currency should have use cases, not just sit in a wallet. Today, we are seeing that vision materialize at scale. Stablecoins are processing trillions in monthly volume, and users in markets like India are discovering crypto’s practical applications-from everyday transactions to wealth creation and preservation. Bitcoin Pizza Day celebrates the moment crypto moved from theory to practice, and reminds us that the real work is making that utility accessible to everyone.”
Binance said that institutions hold about 3.88 million BTC, or 18.5% of the 21 million hard cap. Strategy alone accounts for ~844K BTC, or 4% of total BTC, while public corporations narrowly lead all categories at ~1.24M BTC (5.9%). ETFs trail closely behind with ~1.32M BTC (6.3%), with BlackRock’s IBIT leading at ~811K BTC. An additional ~650K BTC (3.1%) is held by governments.
The crypto exchange explained that, excluding DeFi and other protocol holdings, pure institutional ownership is approximately 3.5 million BTC, or about one in six BTC. The adoption route is evolving. This is the first cycle in which the marginal buyer is an institution rather than a retailer. Approximately 1.24 million BTC (~US$95.7 billion NAV, ~5.9% of the circulating supply) are now held by 197 listed corporations. In the last 12 months alone, about half of that corporate accumulation occurred.
A renewed push to solidify the United States’ foothold in the digital asset market emerged Thursday as lawmakers unveiled legislation to establish a formal strategic Bitcoin reserve and consolidate the federal government’s multibillion-dollar cryptocurrency stockpile.
Spearheaded by Representative Nick Begich, the American Reserve Modernization Act (ARMA) of 2026 mandates the creation of a secure Bitcoin reserve within the US Department of the Treasury, alongside a separate “Digital Asset Stockpile” for federally held, non-Bitcoin cryptocurrencies.
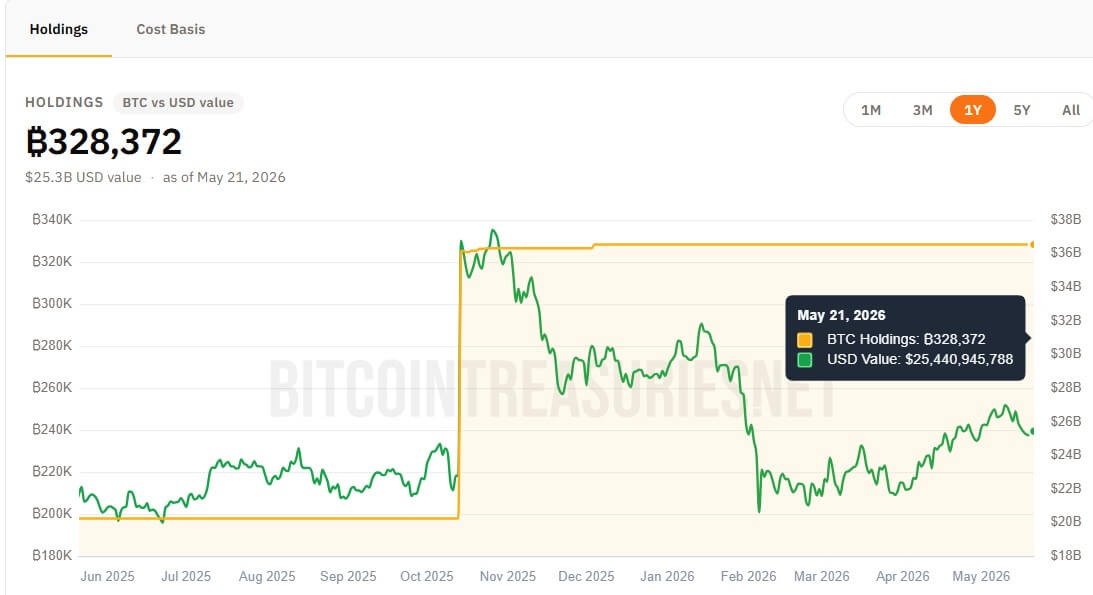
The legislation aims to provide a long-term structure to the government’s existing digital wealth, primarily amassed through law enforcement seizures. According to data from Bitcoin Treasuries, the US currently holds 328,372 Bitcoin, a stash valued at more than $25 billion.
US Government’s Bitcoin Holdings (Source: Bitcoin Treasuries)
“The American Reserve Modernization Act positions the United States to lead confidently in the digital age while protecting taxpayer interests, strengthening financial sovereignty, and reinforcing the principles of transparency and sound stewardship.”
The bill has 17 original House co-sponsors, including Buddy Carter, Ben Cline of Virginia, Barry Moore of Alabama, Burgess Owens of Utah, Mariannette Miller-Meeks of Iowa, Mike Carey and Michael Rulli of Ohio, Mike Collins of Georgia, Mike Lawler of New York, Riley Moore of West Virginia, and Tim Moore of North Carolina.
Apart from the strong legislative support, crypto industry leaders are already throwing their weight behind the measure.
Matt Cole, CEO of Bitcoin treasury firm Strive, called the proposal “the single most important crypto legislation that can come out of D.C.” for the long-term health and security of the United States.
ARMA establishes a 20-year Bitcoin bet
If enacted, the bill would radically alter how Washington handles digital assets. Rather than periodically auctioning off seized crypto, the Treasury would be forced to consolidate custody and oversight across all federal agencies.
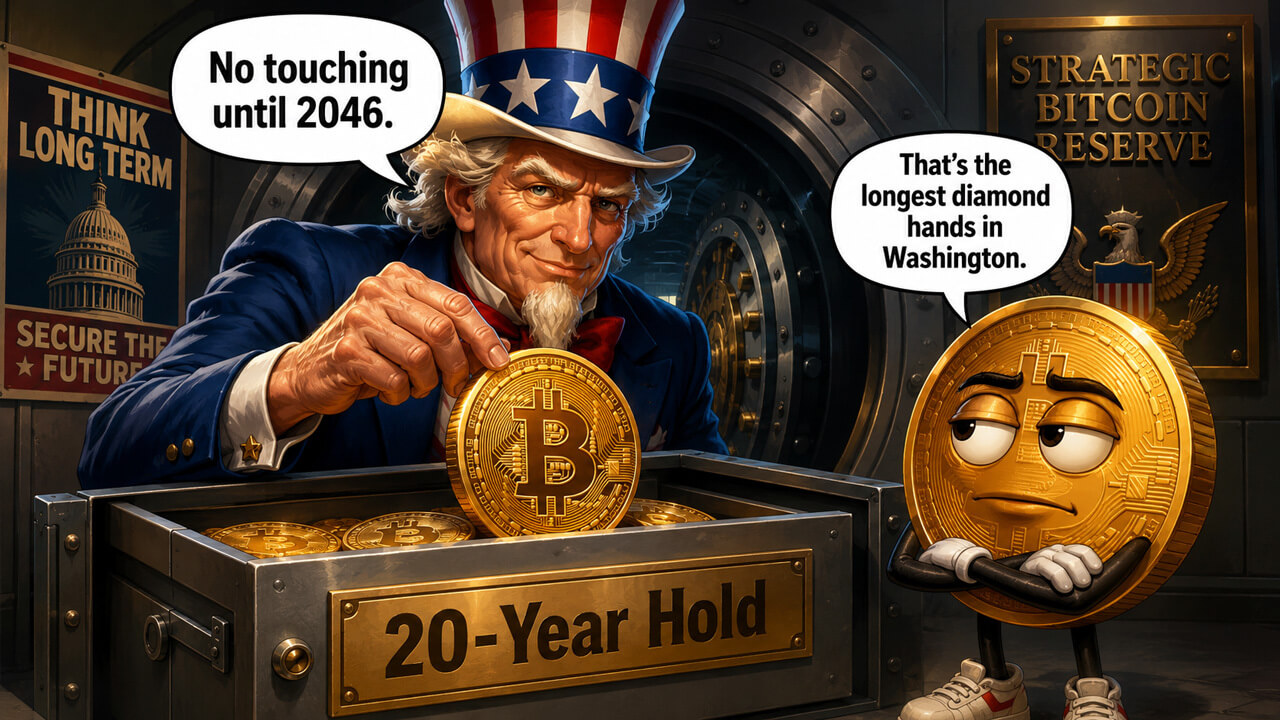
Crucially, the legislation requires that any Bitcoin held in the strategic reserve be maintained for at least 20 years, effectively turning the US government into a long-term “hodler.”
To address persistent industry demands for transparency, the bill establishes stringent reporting measures. The Treasury would be required to publish quarterly public “Proof of Reserve” reports, submit to independent third-party audits, and face direct congressional oversight.
The legislation also directs a study into budget-neutral acquisition strategies. The goal is to evaluate lawful methods for the government to expand its digital reserves without relying on tax increases, deficit spending, or adding to the national debt.
Furthermore, the bill offers an olive branch to crypto advocates by explicitly protecting self-custody rights, affirming that the federal government may not impair Americans’ lawful right to own, transfer, or independently secure their digital assets.
Last year, Sen. Cynthia Lummis proposed the BITCOIN Act, which would require the United States to acquire 1 million Bitcoin over five years, hold the assets for at least 20 years, and distribute storage across secure sites nationwide.
The bill also includes a financing mechanism tied to Federal Reserve gold certificates, a structure that would make the proposal a direct bet on converting part of the federal balance sheet into Bitcoin exposure.
However, these initiatives have considerably stalled despite the Trump administration’s pro-crypto stance.
Still, the Begich bill aims to build on the recent advancement of the Clarity Act, which passed the Senate Banking Committee with bipartisan support. That bill is designed to establish clear rules of the road for the industry and encourage institutional investment.
SanDisk stock is the best-performing asset of 2026 so far. The shares have gained 509% between January 1 and May 20. A $1,000 investment on day one is worth about $6,090 today.
That makes SanDisk the clear winner across stocks, crypto, commodities and indices. The runner-up is a crypto token called DeXe, up 363%. Intel comes third at 209%, followed by Seagate at 183%.
Comparing the Profits Across 15 Different Assets in 2026 (So Far)
Why Did SanDisk Stock Surge 500% This Year?
The driver behind SanDisk’s surge is the AI boom. The company makes memory chips that power data centres training large AI models. On April 30, it reported revenue of $5.95 billion, up 251% from a year earlier.
In the same earnings release, SanDisk disclosed a $42 billion order backlog from cloud customers. The stock then jumped to an all-time high of $1,562 on May 8. It now trades near $1,383.
By contrast, Bitcoin disappointed investors this year. The token opened in 2026 at $87,600 and has since fallen to about $76,800. That is a 22.9% loss, turning a $1,000 stake into $771.
Gold also failed to live up to its early promise. The metal briefly hit an all-time high of $5,589 on January 28. It has since dropped back to around $4,500, leaving holders with only a 6.5% gain for the year.
Oil tells a more dramatic story. Brent crude started the year at $60.59 a barrel and now trades near $113. That is an 86% jump, driven mainly by tensions around the Strait of Hormuz in April.
Value of $1,000 Investment in Each Asset Today
Copper Leads in Precious Metals
Industrial metals also had a strong run. Copper has climbed 42% on the London Metal Exchange, supported by demand from AI data centres and electric vehicles. Silver, however, rose only 3.4% after a sharp January spike faded.
Broader stock indices delivered steady but unspectacular returns. The Nasdaq 100 is up 16%. The S&P 500 is up 9.1%, and the Dow Jones has gained 3.9%.
Importantly, the household-name AI stocks did not lead the rally. Nvidia underperformed its own sector, and Microsoft is actually down for the year.
Instead, investors rotated into less obvious AI suppliers like SanDisk, Intel and Seagate.
Comparing Profits Across 4 Different Asset Classes
Risk also matters in any honest comparison. SanDisk’s gains came with sharp swings, and the stock has already pulled back more than 11% from its May peak. Even so, it has outpaced the Nasdaq 100 by more than 30 times this year.
In short, 2026 has rewarded a narrow group of AI-linked names and punished the assets most retail investors expected to lead.
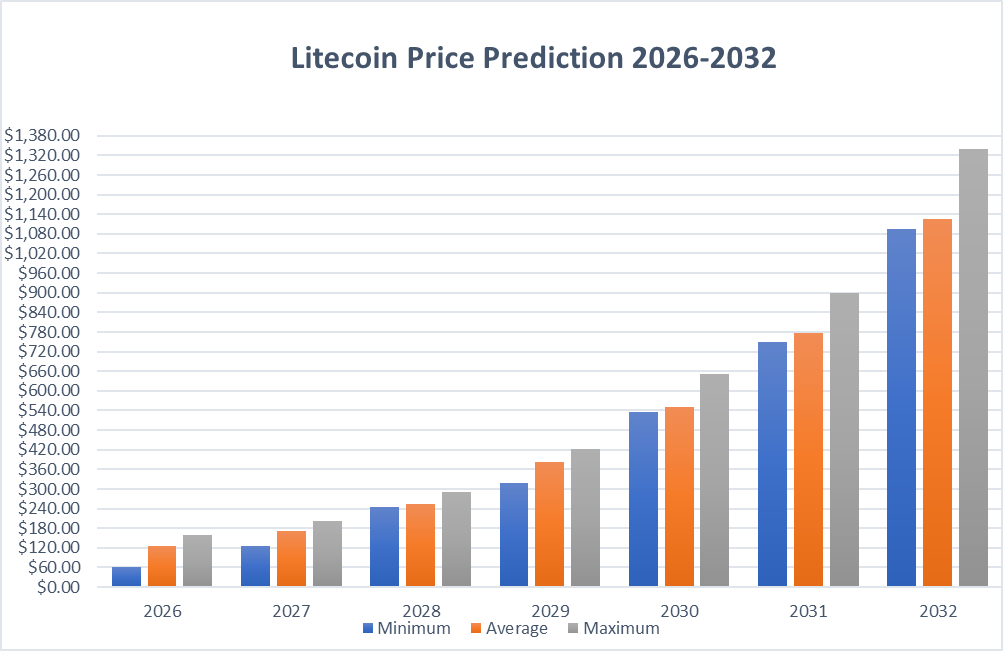
Our Litecoin price prediction for 2026 expects the maximum price of LTC to be $160.
In 2032, we expect Litecoin to attain a maximum of $1,338.47.
Following Bitcoin’s move toward $100K, Litecoin faced increasing buying activity. This surge in activity raises several questions for investors: Is it a good time to invest in Litecoin? Or Will Litecoin (LTC) hold above $200 in 2026? These are common questions that make predicting Litecoin’s price a bit tricky.
We have prepared a detailed analysis and forecast of Litecoin price prediction from 2026 to 2032 to assist you with these questions. This article includes the latest updates, news, and technical analysis to aid in your investment decisions.
Let’s dive into the most recent predictions for Litecoin’s price for 2026, 2027, and beyond!
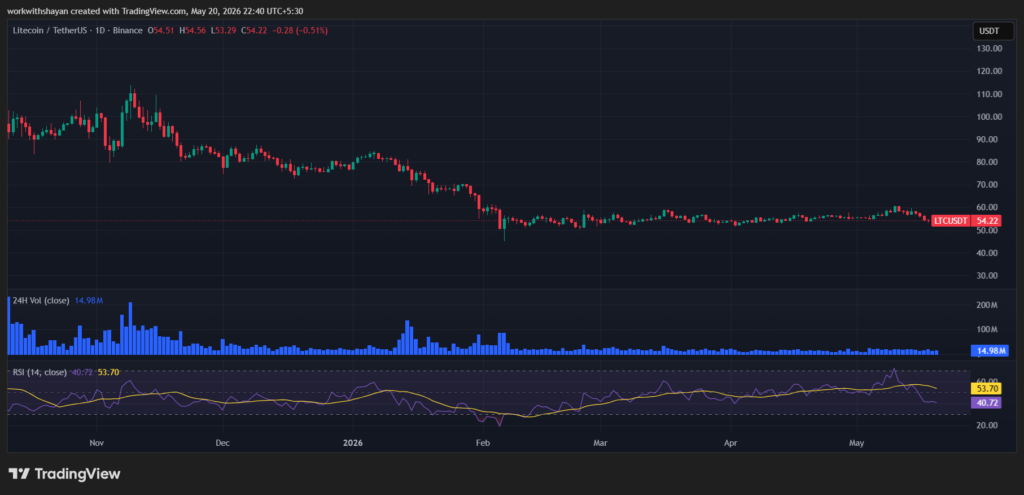
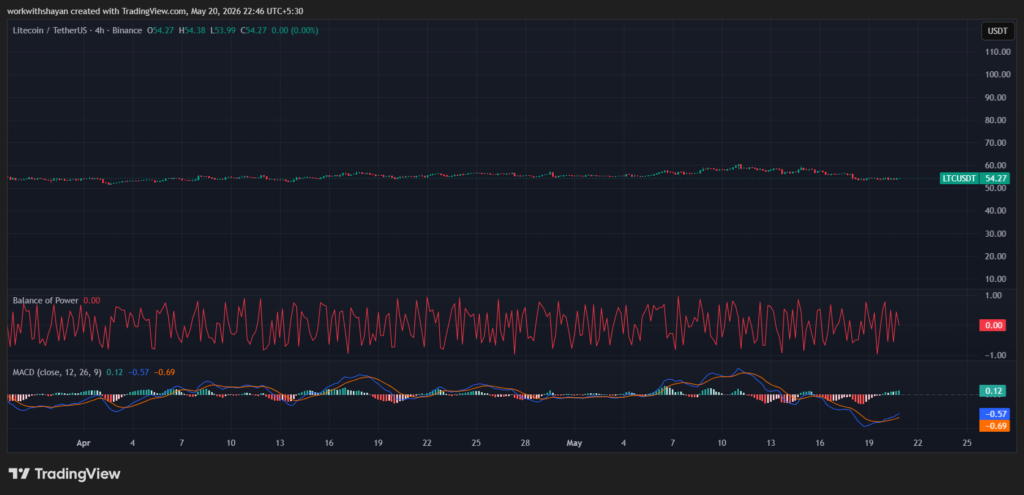
The LTC price analysis for 20 May confirms that the LTC price faced bullish pressure above $54. Currently, buyers are holding the price around key resistance levels.
Analyzing the daily price chart, Litecoin experienced bullish pressure as the overall sentiment turned positive. Buyers are now aiming for a push above immediate Fib levels toward $54. However, it also faces minor bearish retracement. The 24-hour volume increased to $15 million, showing a surge in interest in trading activity. LTC price is currently trading at $54, surging by over 0.2% in the last 24 hours.
The RSI-14 trend line has dropped from its previous level and trades below the midline at 40, suggesting that sellers are controlling the price chart.
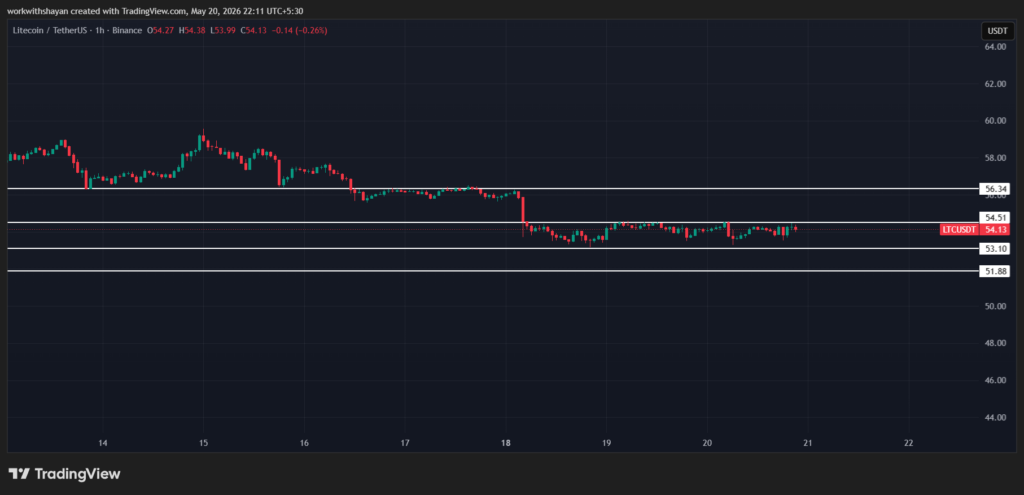
LTC/USD 4-hour price chart: Bulls aim for a hold above EMA trend lines
The 4-hour Litecoin price chart suggests that bullish domination is increasing to keep the altcoin above the EMA trend lines. Currently, buyers are defending a drop below the EMA20 trend line.
The BoP indicator trades in a positive region at 0, signifying that buyers are triggering a minor upward correction.
Additionally, the MACD trend line has formed green candles above the signal line, and the indicator aims for positive momentum, strengthening the chances of a bullish push.
Litecoin technical indicators: Levels and action
Daily simple moving average (SMA)
Period
Value
Action
SMA 3
$57.88
SELL
SMA 5
$58.44
SELL
SMA 10
$57.50
SELL
SMA 21
$56.59
BUY
SMA 50
$55.38
BUY
SMA 100
$55.10
BUY
SMA 200
$68.76
SELL
Daily exponential moving average (EMA)
Period
Value
Action
EMA 3
$57.74
SELL
EMA 5
$57.87
SELL
EMA 10
$57.54
SELL
EMA 21
$56.82
BUY
EMA 50
$56.29
BUY
EMA 100
$58.98
SELL
EMA 200
$66.87
SELL
What to expect from LTC price analysis next?
The hourly price chart confirms that bulls induce buying pressure to hold the price; however, sellers may soon return. If the LTC holds momentum above $54.51, it may climb toward $56.34.
If bulls fail to initiate a surge, the LTC price may drop below the immediate support line at $53.1, which may result in a correction to $51.88.
Is Litecoin a good investment?
Litecoin is an alternative to Bitcoin, making it an appealing choice for everyday transactions worldwide. Additionally, with a finite cap of 84 million coins, LTC presents itself as a potential investment for value preservation, akin to Bitcoin’s role as a digital asset.
Why is the LTC price up today?
Buyers are triggering a push above Fib levels at $54 as lower levels saw minor accumulation on the LTC price chart.
Will LTC Recover?
If bulls hold the price above the $60 level, we might see a strong recovery in the coming days.
What is the LTC price prediction for 2026?
The forecasted lowest price for Litecoin is $60. According to our analysis, the highest possible price for LTC could be $160, with an average expected price of $125.
Will Litecoin reach $100?
Litecoin price already touched the $100 mark last year; however, it is now consolidating. By the end of 2026, Litecoin might surge above $150.
Will LTC price reach $500?
According to our Litecoin price prediction, the LTC price might hit the $500 mark in 2030. However, this rally depends on the future buying interest in the altcoin market.
Does LTC have a good long-term future?
Despite the recent adjustments and potential peak formation, Litecoin exhibits a robust long-term price trajectory and outlook, indicating a high potential for future growth. If the network continues to witness robust activities and growth, the price might reach $1000 in no time.
Recent news/opinion on Litecoin
Litecoin underwent a 13-block reorganization on April 25 after a bug in its MWEB privacy layer enabled invalid transactions. Developers quickly released a mandatory patch and coordinated with mining pools to remove the fraudulent blocks.
Litecoin update:
• A zero-day bug caused a DoS attack that disrupted major mining pools. • Non-updated mining nodes allowed an invalid MWEB transaction allowing them to peg out coins to third party DEX’s • A 13-block reorg reversed those invalid transactions — they will not…
Litecoin’s price shows signs of bullish moves as it has been surging toward $60. However, as BTC’s price aims for a hold above the $80K mark in May, Litecoin’s price intends to end this month on a bullish note.
As a result, we might see the LTC price record a low of $50, with a maximum price of $70 and an average price of $60.
Month
Potential Low ($)
Potential Average ($)
Potential High ($)
Litecoin Price Prediction May 2026
$50
$60
$70
Litecoin price prediction 2026
The forecasted lowest price for Litecoin is $50. According to our analysis, the highest possible price for LTC could be $160, with an average expected price of $125.
Year
Potential Low ($)
Potential Average ($)
Potential High ($)
Litecoin Price Prediction 2026
50
125
160
Litecoin Price Predictions 2027-2032
Year
Minimum Price ($)
Average Price ($)
Maximum Price ($)
2027
126.67
172.3
200.87
2028
245.93
252.82
291.04
2029
317.79
381.9
423.14
2030
534.25
549.53
651.74
2031
747.98
775.45
899.15
2032
1,095.74
1,126.76
1,338.47
Litecoin price prediction 2027
Litecoin’s growing popularity is evident in its expanding social media presence, particularly on Reddit, with active users reaching 2021 levels before its all-time high.
Experts predict a significant rally by 2027, with prices ranging between $126.67 and $200.87 and an average of $172.30. Advancements from the Litecoin Foundation are expected to drive a strong rebound, boosting its market cap and valuation.
Litecoin (LTC) price prediction 2028
In 2028, the price of Litecoin is expected to reach a minimum value of $245.93. The maximum price could be as high as $291.04, with the average trading price throughout the year around $252.82.
Litecoin price prediction 2029
In 2029, the lowest forecasted price of Litecoin is $317.79. Based on our analysis, the maximum price could rise to $423.14, with an average price of $381.90 for the year.
Litecoin’s price forecast 2030
Our detailed analysis of past Litecoin price data indicates that in 2030, the minimum price of Litecoin could be approximately $534.25. The price could peak at $651.74, with an average trading value around $549.53.
Litecoin (LTC) price prediction 2031
For 2031, the minimum predicted price of Litecoin is $747.98. The price could reach a maximum of $899.15, with the average trading price expected to be about $775.45 throughout the year.
Litecoin price prediction 2032
Our detailed analysis of past Litecoin price data indicates that in 2032, the minimum price of Litecoin could be approximately $1,095.74. The price could peak at $1,338.47, with an average trading value around $1,126.76.
According to the Litecoin price prediction by Cryptopolitan, it is anticipated that various leading institutions will invest in and start accepting LTC as a form of payment. Additionally, the growing frequency of events likely to influence LTC’s price could enhance its public perception.
The forecasted lowest price for Litecoin is $50 in 2026. According to our analysis, the highest possible price for LTC could be $160, with an average expected price of $125.
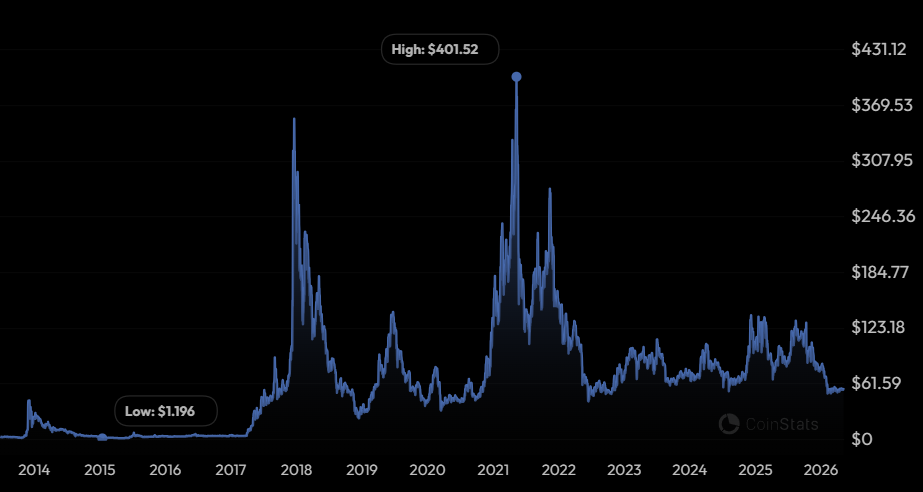
Litecoin traded between $1 and $5 in its early years before surging to over $300 during the crypto bubble of late 2017 to early 2018.
In 2021, Litecoin hit an all-time high of $412.96 early in the year but dropped significantly, closing at $144.56 by the end of the year.
In 2022, Litecoin experienced significant losses, dropping below $45 mid-year. However, it managed to outperform the broader market despite a nearly 55% decline overall.
2023 saw high volatility for Litecoin, peaking at $114.50 in July but declining sharply due to market pressures, ending the year at $72.80 with a modest 7% rise despite underperforming the broader market.
In 2024, Litecoin started the year around $68.20, climbed to $102.40 in April, and then fell below $80. After further declines in May and June, it dropped to $49 in August before rebounding to $70. By November, Litecoin surged past $100 and attempted to hold above $140 in December.
In January 2025, the price of Litecoin surged to $140.
However, the LTC price crashed in February as it dropped toward the low of $80.
In March, the price of LTC consolidated below $90 after failing to break the $100 resistance. By the end of April, LTC price surged toward the $88 but struggled to maintain that level in early May.
By the end of June, LTC price declined below $85. In July, the price surged toward $123 but declined later.
In early August, the price of Litecoin aimed for a move above $125. However, it later declined and dropped below $110 in early September.
In early October, the price of Litecoin surged toward $125 twice but failed to meet buyers’ demand.
In November, the LTC price dropped below the $80 level. By the end of the month, the price of LTC consolidated below $85.
LTC ended 2025 on a bearish note by trading below $80. In January 2026, the price of LTC declined further as it crashed toward $44 in February.
In early April, the price of LTC surged toward $53. By the end of April, LTC surged toward $57.