Despite crypto’s volatility, XRP is still viewed by some investors as a long-term asset that could help them retire or protect their capital from inflation and currency devaluation.
But is there any math behind that argument? Some analysts have projected paths to $1 million by 2035, while others warn that XRP still faces extreme volatility and questions over its DeFi and institutional utility.
XRP is the native token of the Ripple network, designed for fast, low-cost international transactions. Supporters highlight real-world adoption by financial institutions and positioning within ISO 20022 messaging standards, making it one of the few crypto assets directly tied to traditional banking infrastructure currently in use.
— The Wolf Of All Streets (@scottmelker) June 15, 2026
The retirement math depends entirely on the price scenario the investor assumes for the next decade. Some long-term prediction models describe paths to a $1 million portfolio by 2035 under three sets of price assumptions. The token currently trades near $1.34, and projections vary widely among analysts and time horizons.
The conservative scenario assumes XRP reaching around $3.13 by 2035. Under this projection, an investor would need approximately 319,000 tokens to hit the $1 million target.
The equivalent investment today would be around $428,000 in XRP, accumulated through purchases over time at current prices.
A more bullish range of $9 to $10 per XRP changes the math dramatically. Investors would need only between 100,000 and 105,000 tokens to reach the same target by 2035.
The required upfront capital drops significantly because each token contributes more to the final portfolio value.
The most aggressive scenario considers XRP reaching $20 to $40 per token. Under these assumptions, just 25,000 XRP (currently valued at around $33,000) could grow into a retirement nest egg.
The asymmetric upside is what attracts speculative investors to the token despite mainstream advisor warnings.
“You understand Bitcoin’s scarcity and have watched it become the best performing asset of the last 15 years. You understand XRP’s utility and why many believe it could become significantly more valuable if adoption continues to grow. The question is, does your retirement account reflect that conviction?,” Bri Teresi said on X.
Why Mainstream Analysts Warn Against XRP as a Core Holding
Mainstream financial voices urge caution about treating XRP as a primary retirement vehicle. Motley Fool analysts note that the token has experienced multiple drawdowns greater than 50% throughout its trading history. For investors nearing retirement, this volatility could permanently impair capital just when liquidity matters most.
The risk profile suits investors with long time horizons and a high tolerance for swings. Younger savers with 20 or 30 years until retirement can withstand major drawdowns without compromising their financial future.
Older investors with less than a decade left should treat XRP as a small satellite position only.
Executive actions that open 401(k) plans to alternative assets create new pathways for crypto in retirement accounts in 2026. The shift could legitimize XRP exposure within traditional retirement vehicles, but does not eliminate the underlying volatility risk for individual portfolios.
What Could Go Wrong: The Risks XRP Community Must Accept
Beyond price volatility, treating XRP as a retirement asset requires honest acknowledgment of structural risks. Investors who entered at previous peaks waited years before recovering principal, a timeline incompatible with anyone needing liquidity within the next decade.
Regulatory uncertainty persists despite recent clarity milestones in the United States. Future administrations could reverse current frameworks, or new global treaties could restrict cross-border crypto flows.
Stablecoins backed by major institutions and emerging central bank digital currencies (CBDCs) also compete directly for the same payment use cases that justify the bull case.
Custody adds another layer of risk, often underestimated by new investors. Exchange hacks have wiped out years of accumulated savings overnight throughout crypto history.
Self-custody via hardware wallets is essential but introduces operational complexity that retirees particularly need to master before committing significant capital.
How to Spot a Fragile Token Launch Before You Buy In — Blockchain Interviews
Blockchain Interviews · Investor Guide
How to spot a fragile token launch before you buy in
By Ashton Addison · CryptoCoinShow · Based on our interview with Scott Byron, Managing Director at Forgd
Most retail traders learn about liquidity the hard way — watching a token crater in the first hour and wondering what they missed. The signals were there. They just didn’t know what to look for.
Token launches fail at a startling rate, and the common narrative blames the project, the market timing, or bad luck. But after working with over 500 token launches and tracking data across 35+ market-making firms, the team at Forgd has a different conclusion: most launch failures are structural, and most of them are visible in advance — if you know where to look.
Scott Byron, Managing Director at Forgd, joined Ashton Addison on Blockchain Interviews to walk through exactly this. What follows is a practical breakdown of the warning signs retail traders can use before committing capital to a new token launch.
Why launch day is already too late to diagnose the problem
The decisions that determine whether a launch succeeds are made months before the token ever hits an exchange. Market maker selection, vesting schedule structure, exchange listing strategy, liquidity depth — all of it gets locked in during the lead-up period. By the time a token goes live, the foundation is either solid or it isn’t.
“Once you see fragile liquidity on day one, recovery is almost impossible. The narrative breaks, the community loses confidence, and the market maker has little incentive to defend a price that’s already under pressure.”
Scott Byron, Managing Director, Forgd
This is why retail traders who wait for launch day to evaluate a project are often evaluating the aftermath of decisions that were already made. The better question is: what does the pre-launch setup tell you?
The red flags worth watching before you buy
1. Thin or missing order book depth
One of the clearest early signals is the order book itself. A well-supported launch will show meaningful bid depth within 1–2% of the current price on both sides. When you see a wide spread, steep drop-off just below the current price, or almost no visible bids, that’s a sign the market maker either isn’t active or is providing minimal support.
This isn’t just a cosmetic issue. Thin order books mean small sell orders can move price dramatically — which triggers stop-losses, creates panic, and accelerates the kind of cascade that turns a soft open into a collapse. Forgd’s data across hundreds of launches shows this pattern repeating constantly.
2. Only on a DEX, or only on a CEX
Exchange listing strategy is something most retail traders overlook entirely, but it’s a meaningful signal. A legitimate, well-funded launch should have presence on both centralized exchanges (CEXes) and decentralized exchanges (DEXes) — they serve different audiences and require different liquidity approaches.
A project that launches exclusively on a DEX may be doing so because it couldn’t secure a CEX listing, which raises questions about vetting and credibility. A project that launches only on a CEX may be avoiding the on-chain transparency that DEX trading provides. The strongest launches cover both, and they do it intentionally — CEXes bring volume and distribution, DEXes attract the protocol-native audience most likely to become long-term holders.
Geography matters too. A project skipping Asian exchange listings is deliberately cutting off a major portion of the buyer base. That either reflects poor planning or a very narrow target market — neither is a great sign.
For founders navigating this themselves, Forgd’s Exchange and Listing Research tool makes this data publicly accessible for the first time. It provides visibility on listing fees, security deposits, historical listing performance, and due diligence questionnaire requirements across top-tier CEXes including Binance, OKX, Bybit, Coinbase, and KuCoin — information that was previously only available through backchannels and relationships. For a retail trader, seeing that a project chose exchanges well-suited to their profile and FDV is itself a green flag. It suggests the team did the homework.
3. A vesting schedule that puts pressure on price immediately
Vesting schedules and token unlock timelines are public information on most launches, but few retail traders actually model out what they mean for circulating supply in the first 30, 60, and 90 days. This is worth doing.
Aggressive early unlocks — especially for team, advisor, or early investor allocations — create natural selling pressure right when the project needs price stability most. When those unlocks hit at the same time a market maker’s initial commitment period ends, the combination can be toxic. Byron describes this as one of the most common structural failures Forgd encounters: teams that didn’t think through the timing interaction between their vesting cliffs and their liquidity support schedule.
This is another area where Forgd has built a free tool that benefits both founders and informed investors. The Tokenomics Research tool lets you model token distributions, emission schedules, and demand drivers, then run price discovery simulations to stress-test how a given supply structure holds up at launch. For a retail trader, it’s worth cross-referencing any project’s published tokenomics against what well-structured launches actually look like — the difference is usually visible immediately.
Quick-check: 5 things to verify before a token launch
Order book depth within 1–2% of price on both sides at open — is there meaningful bid support, or does it fall off a cliff?
Is the token listed on both a CEX and a DEX? Single-venue launches warrant closer scrutiny. Use Forgd’s Exchange Research tool to check if the chosen exchanges match the project’s FDV and profile.
Check the vesting schedule — when do team, advisor, and early investor unlocks hit relative to launch? Use Forgd’s Tokenomics Research tool to benchmark the supply structure against well-performing launches.
Is there a named, verifiable market maker? Projects that can’t or won’t disclose this are hiding something.
What does post-launch trading volume look like after hour 1? Sustained volume is a good sign. A spike followed by a cliff is not.
The market maker question most investors never ask
One of the most underappreciated signals in a token launch is whether the project can tell you who their market maker is — and whether that firm has a verifiable track record.
The market making industry for crypto tokens has historically operated with almost no transparency. There are 30+ firms active in this space, operating under two primary engagement structures: a loan model, where the market maker borrows tokens and uses them to provide liquidity in exchange for an option at a fixed price, and a retainer model, where the project pays a monthly fee for ongoing liquidity services. Each structure creates different incentives, and understanding which one a project is using tells you a lot about whether the market maker’s interests are aligned with long-term price stability.
Forgd built its market maker leaderboard specifically because this data didn’t exist anywhere. Founders were choosing market makers based on reputation and relationships rather than actual performance data — and retail traders had no way to evaluate quality at all. The leaderboard, available at forgd.com, tracks performance across firms and gives both founders and informed investors a benchmark.
What good liquidity actually looks like
It’s worth being specific about what you’re looking for as a positive signal, not just what to avoid. A well-supported launch tends to show consistent spreads through the first few hours of trading, not dramatic swings. Volume stays relatively stable rather than spiking on open and then disappearing. The price may move, but it moves in both directions — evidence that the order book is active and that there’s genuine two-sided interest.
Projects that have done the work tend to want to show it. If a team is transparent about their market maker, has published their vesting schedule, and is listed on multiple quality exchanges, those aren’t just checkboxes — they’re signals that someone planned this out. That doesn’t guarantee success, but it eliminates a category of failure that takes down a surprising number of launches that otherwise had strong fundamentals.
“The projects that succeed in 2026 are the ones that treat the capital markets side of their launch with the same rigor they apply to the product. Most still don’t.”
Scott Byron, Managing Director, Forgd
The shift Forgd is trying to accelerate is a move from reputation-based decision making to data-based decision making — on both sides of the table. Founders picking market makers with better information. Retail traders evaluating launches with a clearer framework. The more that happens, the fewer entirely preventable launch failures there are.
For retail traders, the practical takeaway is simple: the information you need to make a better call is almost always available before you buy. You just have to know what you’re looking at.
Full Interview
🎙 Blockchain Interviews
Scott Byron, Managing Director at Forgd
Scott joined Ashton Addison to go deep on why token launches fail, how market making works under the hood, and what retail traders and founders can do differently. Click any timestamp to jump to that moment.
00:00Introduction: Scott Byron, Managing Director at Forgd
01:22What Forgd is and the problem it was built to solve
03:33Why market maker data has been a black box and what Forgd actually tracks
06:42The two market maker engagement structures every investor should understand
10:16Why 2025 was the most brutal year for altcoin launches in recent memory
14:05Why failed launches almost never recover and what triggers the collapse
17:18Vesting schedules, cliffs, and what they mean for your buy timing
21:35How to spot fragile liquidity in the first minutes after launch
27:20CEX vs DEX: why choosing one over the other is the wrong move
34:24What it actually takes to succeed in the 2026 market
38:09How to access Forgd’s market maker leaderboard at forgd.com
There’s a scene in the new film Obsession (2026) that’s been living rent-free in a lot of heads since its release. A character gets a fragile little novelty toy, the “One Wish Willow”, and wishes for a billion dollars. (Spoiler alert) and cash literally rains from the ceiling. It’s absurd, it’s funny, and for about three seconds, everyone watching thinks: what would I wish for?
Here’s a better question: what if you didn’t need a wish at all?
The crypto market has always attracted dreamers. That’s not a criticism; it’s how generational wealth gets built. But there’s a difference between dreaming and deciding. Between waiting for the moment to feel right and recognizing that the moment is already here, already moving, already filling up.
Solana Unchained ($UCHN) is in Phase 1 of its presale. The price is $0.05. The listing target is $0.50. That’s a 10x multiple, not a projection, not a promise, a number locked into the structure of the raise before a single token hits an exchange. Phase 1 is already over 30% sold, and the window closes June 6, 2026.
Phase 2 Opens At $0.07. Math Doesn’t Get Easier From Here
$UCHN is a utility-driven token built on Solana, one of the fastest, most battle-tested blockchains in the world. The kind of infrastructure that doesn’t flinch when volume spikes. The kind of network that institutional money has started to take seriously. Solana Unchained is designed to operate inside that ecosystem with purpose, not as a meme, not as a gamble, but as a project built for what comes after the hype cycle settles.
The tokenomics are transparent. The roadmap is public. The presale is structured into 10 phases with incrementally rising prices, each phase rewarding those who moved earlier rather than those who wished they had.
And about that billion-dollar wish
(Spoiler alert) In Obsession, the wish works, but nobody’s in control of what happens next. A $1 billion market cap for Solana Unchained is a different kind of story. With a total supply of 100 million, a $1B market cap would put $UCHN at $10 per token. A long way from current numbers, but crypto has seen even more fascinating stories.
So, What Does Solana Unchained Do?
Solana Unchained isn’t chasing a trend; it’s building infrastructure.
At the core of the ecosystem is the AI Tool Hub, a token-gated platform giving $UCHN holders access to premium AI tools for trading insights, content automation, and DeFi workflows, live during 2026, and some will be live during presale and upon launch, not promised for someday.
Stack that with the Unchained Vault, which offers presale investors a tiered yield account paying 15% to 150% APR weekly, directly to users’ wallets in USDC or $UCHN, with zero lockup requirements. Then there’s the Unchained Wallet, a non-custodial, mobile-first wallet with built-in crypto commerce, social recovery, and on-chain inheritance, solving one of the most overlooked problems in the space: permanent loss of access.
Underneath all of it runs a Native Commerce Protocol that enables real crypto transactions without KYC or middlemen, on Solana’s fast, low-fee network. The supply is fixed to100 million tokens, and 60% is allocated to the presale. There’s no hidden inflation.
The Community Is Paying Attention, And So Are the Auditors.
Trust in crypto isn’t claimed; it’s verified. Solana Unchained has passed independent security audits by Solidproof, Spywolf, and Cyberscope, three of the most recognized names in blockchain contract verification. The team verified their identities to Spywolf, and it is on record. The audit reports are public. Some analysts have already produced coverage on the project, like Crypto League and Crypto Volt. Coverage has also landed across Fidelity, Business Insider, and Benzinga, putting Solana Unchained in front of audiences well beyond the typical crypto bubble. The foundation is audited, the community is growing, and Phase 1 closes June 6, 2026.
Disclaimer: The above article is sponsored content; it’s written by a third party. CryptoPotato doesn’t endorse or assume responsibility for the content, advertising, products, quality, accuracy, or other materials on this page. Nothing in it should be construed as financial advice. Readers are strongly advised to verify the information independently and carefully before engaging with any company or project mentioned and to do their own research. Investing in cryptocurrencies carries a risk of capital loss, and readers are also advised to consult a professional before making any decisions that may or may not be based on the above-sponsored content.
Readers are also advised to read CryptoPotato’s full disclaimer.
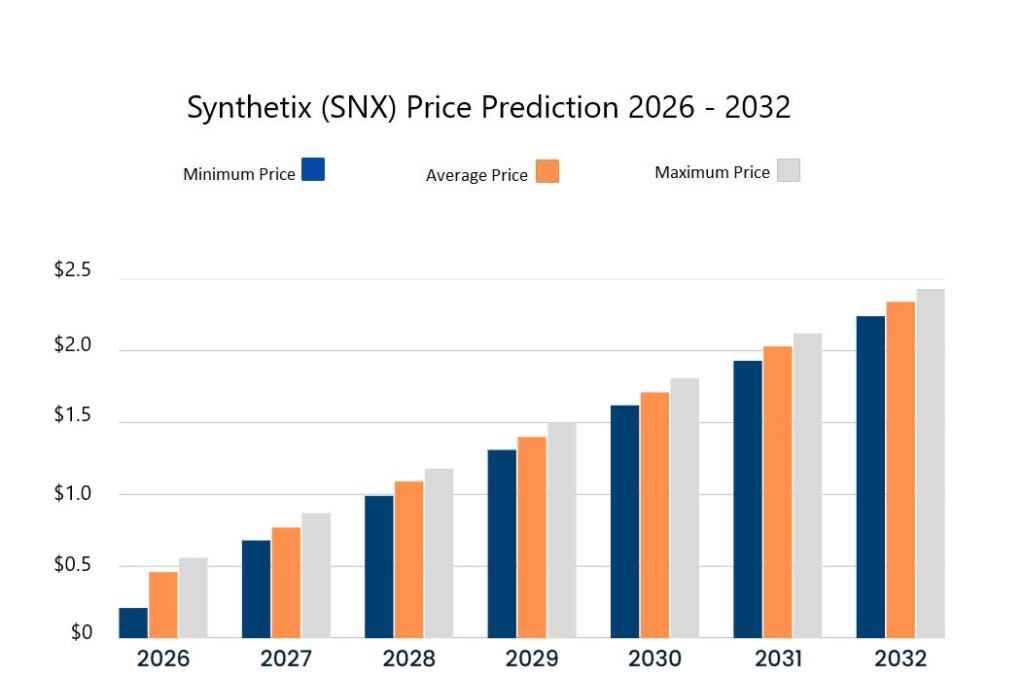
The average SNX price prediction for 2026 is $0.560931.
In 2028, it will range between $0.99721 and $1.18, with an average price of $1.09.
In 2032, it will range between $2.24 and $2.43, with an average price of $2.34.
SNX is the native token for the Synthetix Network and is used for governance. It is listed on top exchanges like Binance, Uniswap, Coinbase, OKX, and Bybit. Synthetic is a decentralized protocol that allows you to create and transact synthetic tokens on the Ethereum blockchain.
Is SNX a good investment? Will it go up? Where will it be in five years? Let’s get into the SNX price prediction and technical analysis.
Overview
Cryptocurrency
Synthetix
Abbreviation
SNX
Current Price
$0.322 (+6.68%)
Market Cap
$110.61M
Trading Volume (24-hour)
$7.58M
Circulating Supply
344.51M SNX
All-time High
$28.77 (Feb 14, 2021)
All-time Low
$0.03258 (Jan 5, 2019)
24-hour High
$0.3252
24-hour Low
$0.295
SNX price prediction: Technical analysis
Metric
Value
Price Prediction
$0.2820 (-8.41%)
Fear & Greed Index
30 (Fear)
Market Sentiment
Neutral
Volatility
5.30% (High)
Green Days
12/30 (40%)
50-Day SMA
$0.3115
200-Day SMA
$0.4025
14-Day RSI
42.28 (Neutral)
Synthetix price analysis
TL;DR Breakdown:
Synthetix coin price analysis confirmed a solid bullish trend, with the price set at $0.322.
The altcoin gained a significant 6.68% in the last 24 hours.
SNX coin faces resistance around $0.329.
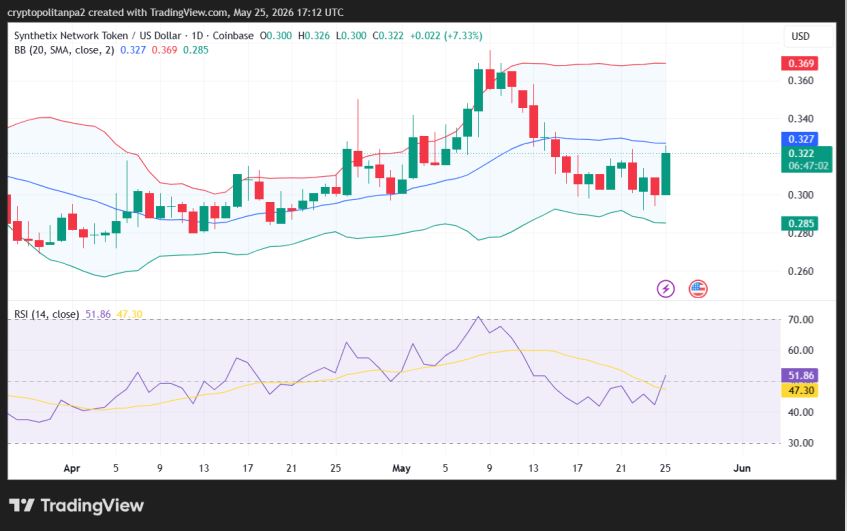
On May 25, 2026, Synthetix price analysis reveals an upward trend with a solid bullish recovery, as the altcoin’s price climbs back to $0.322 over the day. Overall, the cryptocurrency gained a significant 6.68% in value in the last 24 hours, rebounding sharply from yesterday’s steep correction. However, resistance is also present at $0.329, which may slow down the current bullish trend.
SNX/USD 1-day chart analysis
The one-day chart for Synthetix (SNX) reflects a bullish trend following recent corrections; however, the market has yet to shift into a fully buyer/seller-dominated phase. The token has registered significant gains of 6.68% for the last 24 hours, as it has increased to $0.322 today. A new green candlestick on the price chart highlights the presence of bullish dominance.
The distance between the Bollinger Bands defines the intensity of volatility. This distance is wide, leading to high volatility at the moment. Currently, the upper limit of the Bollinger Bands indicator, indicating resistance, sits at $0.369. Meanwhile, its lower limit, serving as support, has moved to $0.285.
The Relative Strength Index (RSI) indicator curve is trending in the neutral area, currently at 51. This situation suggests that buyers are currently controlling the momentum, and bullish pressure might increase if they continue to lead as the coin gains value.
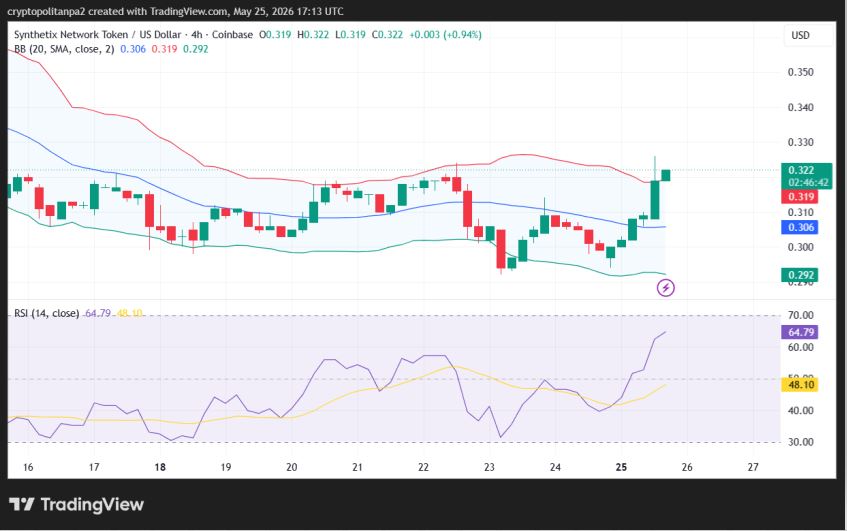
SNX/USD 4-hour chart analysis
The four-hour price analysis of Synthetix Coin also signals buying interest for the coin at the current price level. The SNX/USD price significantly increased to $0.322 after going through a recovery in the last four hours. The volatility levels are increasing on the 4-hour chart, suggesting a high probability of an upcoming reversal or further price appreciation.
The upper Bollinger Band has shifted to $0.319, indicating a broken resistance level. The lower Bollinger Band has moved to $0.292, showing the support level. Overall, the indicator suggests that the bulls have taken the price above the upper limit of the indicator.
The RSI indicator is in the neutral region. Its value increased to 64 over the past four hours. The upward curve on the RSI graph reflects a positive market sentiment. The bulls have been dominating the price chart for the past few hours, and this trend has also resulted in a relatively balanced trading setup for intraday traders for the time being.
SNX technical indicators: Levels and action
Daily simple moving averages
Period
Value ($)
Action
SMA 3
0.3038
BUY
SMA 5
0.3086
BUY
SMA 10
0.3097
BUY
SMA 21
0.3268
SELL
SMA 50
0.3115
BUY
SMA 100
0.3137
BUY
SMA 200
0.4025
SELL
Daily exponential moving averages
Period
Value ($)
Action
EMA 3
0.3044
BUY
EMA 5
0.3067
BUY
EMA 10
0.3120
BUY
EMA 21
0.3170
BUY
EMA 50
0.3166
BUY
EMA 100
0.3394
SELL
EMA 200
0.4166
SELL
What can we expect from the SNX price analysis next?
Synthetix Coin price analysis shows a bullish trend regarding current market events. The coin’s price has been trending near $0.322 for the last 24 hours. If the buying momentum continues, the SNX price might retest resistance at the $0.347 level. Conversely, if selling pressure overwhelms, the altcoin may again plunge to the $0.292 level.
Is SNX a good investment?
The Synthetix rebranding in 2018 rejuvenated the ecosystem, which has grown continually with multiple listed synths. Despite concerns over the stability of its stablecoins, SNX, the native token, is set to mark new records, as seen in Cryptopolitan’s SNX price predictions from 2026 to 2032. It is expected that SNX will reach $1.81 by 2030.
Why is SNX up?
The cryptocurrency market is getting positive sentiment today, and SNX is following suit. From a larger perspective, the token is slowly recovering as the SNX price is trading at $0.322, and it has seen an appreciation of 6.68% of its total value in the last 24 hours, and the gains are on the higher side.
What is the target price for SNX?
The target price for SNX is $0.560931 for the current year, which is still quite higher than the current Synthetix price.
Will SNX reach $5?
The current price action does not justify predicting a $5 target. However, in the cryptocurrency market, things change rapidly, and if the token maintains its price levels, a recovery can be initiated. It can be expected that SNX will reach a maximum of $2.43 by 2032. However, this is not investment advice, and anyone willing to purchase SNX tokens should seek independent professional consultation.
Will SNX reach $1?
Considering the future price movements, SNX will reach the $1 level by 2028. The last time SNX was seen at the $1 level was in November 2025.
Will SNX reach $10?
According to crypto analysts’ price predictions, SNX may not reach this level in the next five years. Considering the current market cap of the token, it seems like a distant target.
Will SNX reach $100?
No, market analysts don’t expect SNX to reach $100 during the next 10 years, considering the long term Synthetix price forecast.
How high can SNX go?
The highest expected price for SNX is $2.14, which it will achieve in 2032.
Does SNX have a future?
SNX is trading significantly lower than its mid-December price levels, making it an ideal time for buyers to enter the market. Given its current low price and a favorable future valuation of $2.43 by the end of 2032, the asset appears to be a worthwhile investment. However, one’s own research is advised.
Recent news/ updates on SNX
Synthetix introduced the new Synthetix Markets page. The option will show live stats for market sentiment, open interest, 24h volume, funding rate, token dominance, and implied volatility + alt dominance.
Introducing the new & improved Synthetix Markets page ⚔️
This month, SNX is expected to reach a high of $0.430, with an average price of $0.310 and a minimum trading price of $0.243.
Month
Potential Low ($)
Potential Average ($)
Potential High ($)
May
$0.243
$0.310
$0.430
SNX price prediction 2026
The price of SNX is predicted to reach a minimum value of $0.211 by Q4 of 2026. Traders can anticipate a maximum value of $0.560931 and an average trading price of $0.467442.
Year
Potential Low ($)
Potential Average ($)
Potential High ($)
2026
$0.211
$0.467442
$0.560931
SNX price predictions 2027 – 2032
Year
Potential Low ($)
Potential Average ($)
Potential High ($)
2027
0.685582
0.77907
0.872559
2028
0.99721
1.09
1.18
2029
1.31
1.40
1.50
2030
1.62
1.71
1.81
2031
1.93
2.03
2.12
2032
2.24
2.34
2.43
Synthetix price prediction 2027
The year 2027 will experience more bullish momentum. According to the SNX price prediction, it will range between $0.685582 and $0.872559, with an average trading price of $0.77907.
Synthetix price prediction 2028
The Synthetix Network token prediction climbs even higher into 2028. According to the projections, the price of SNX will range between $0.99721 and $1.18, with an average of $1.09.
Synthetix price prediction 2029
According to our Synthetix Network token price prediction for 2029, we expect a maximum price of Synthetix to be $1.50, a minimum price of $1.31, and an average price of $1.40.
Synthetix price prediction 2030
According to the Synthetix price prediction for 2030, the price of SNX will range from $1.62 to $1.81, with an average price of $1.71.
Synthetix price prediction 2031
The Synthetix Network token price prediction for 2031 indicates the price will range between $1.93 and $2.12. The average Synthetix price forecast is $2.03.
SNX price prediction 2032
The Synthetix forecast for 2032 is a high of $2.43. According to the SNX coin price prediction, it will reach a minimum price of $2.24 and average at $2.34.
Our analysis shows that SNX has been highly volatile since its historical listing price. It remains unpredictable at current levels, with predictions indicating it will break out higher. SNX will achieve a high of $0.560931 by the end of 2026. SNX is expected to trade between $0.685582 and $0.872559 in 2027. In 2032, SNX will be priced between $2.24 and $2.43 with an average price of $2.34.
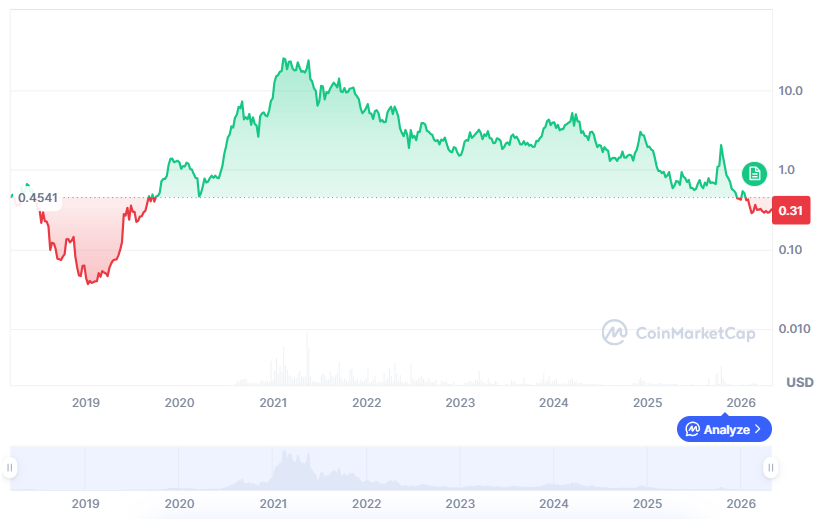
Synthetix historic price sentiment
SNX price history | Coinmarketcap
Kain Warwick launched Synthetix in September 2017 under Havven (HAV).
The HAV Airdrop Campaign ran between 4 and 14 February 2018 and offered two million tokens for around $1 million.
On November 30, 2018, Synthetic announced its rebranding from Havven. This included renaming its native token, HAV (Havven token), to SNX. The contract address did not change.
It registered its lowest price at $0.03258 on January 5, 2019.
Unlike most mega-altcoins, SNX did not rally after launch; it consistently traded below $0.5 until the last quarter of 2019.
In 2020, it made a mega rally to $7.3, as per historical SNX market data. In the 2021 bull cycle, it shot higher, and on February 14, it registered its all-time high at $28.77.
It reversed to $5 in July before pumping again to $15 in September.
In the 2022 crypto winter, SNX shed most of its value as it retreated to the $2 mark by the end of the year.
In 2023, it consistently traded between $1.5 and $3 until the last quarter, when it had its break.
In March 2024, SNX reached a high of $5; in July, SNX came down from the $2.01 to $1.65 range.
In August 2024, the SNX token’s price dipped as low as $1.20, and September saw a maximum price of $1.71.
In October 2024, SNX dipped and became rangebound. It closed the month with a $1.31 price tag, while December saw a stream of improved prices with a peak price of $3.38.
During the remainder of December, SNX kept shedding its value, and it entered 2025 with a wave of correction to $1.90.
The highest price of the SNX token was 2.27 in January, but it corrected to $1.20 in February.
In March, SNX price declined to $0.89, and in April it further descended to the $0.77 range.
In May 2025, it saw some recovery to $0.926, improving its market capitalization, and in July, the token peaked at $0.781, showing significant growth.
From August to September, SNX’s average price remained around $0.65 to $0.67, and in October 2025, SNX was trading above $1, finally peaking at $2.58 on the 13th of the month.
At the start of November, the SNX token was trending below $1.00. By the end of November, the price of SNX declined toward $0.55.
SNX started 2026 with a price tag of $0.45 under bearish pressure, and it decreased to $0.34 in February. The token was maintaining its price level near the same range till April.
In May, SNX is trending near $0.314, as the current market sentiment is neutral.
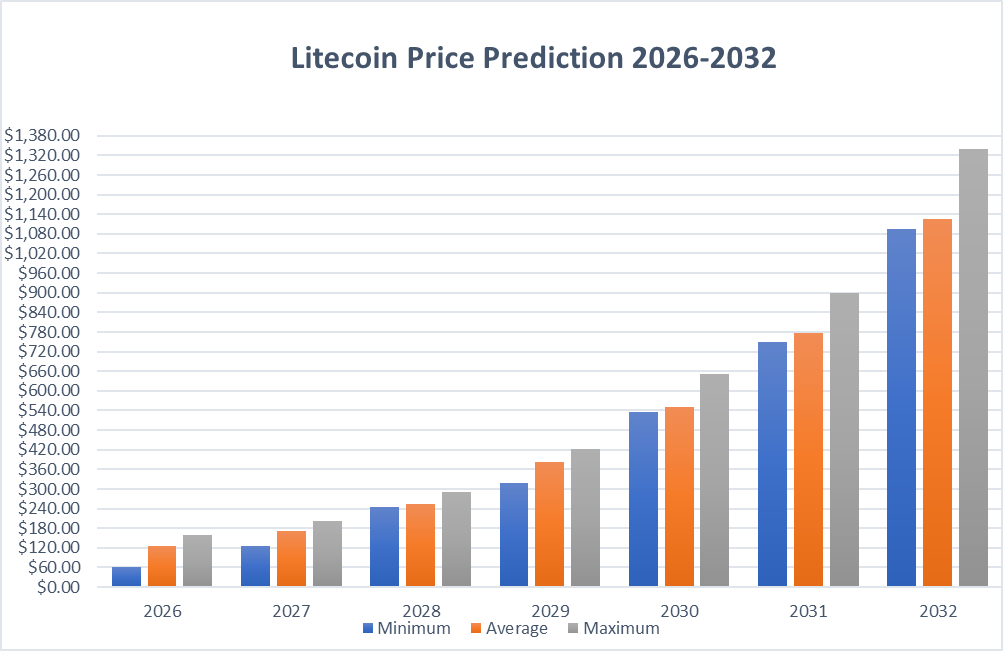
Our Litecoin price prediction for 2026 expects the maximum price of LTC to be $160.
In 2032, we expect Litecoin to attain a maximum of $1,338.47.
Following Bitcoin’s move toward $100K, Litecoin faced increasing buying activity. This surge in activity raises several questions for investors: Is it a good time to invest in Litecoin? Or Will Litecoin (LTC) hold above $200 in 2026? These are common questions that make predicting Litecoin’s price a bit tricky.
We have prepared a detailed analysis and forecast of Litecoin price prediction from 2026 to 2032 to assist you with these questions. This article includes the latest updates, news, and technical analysis to aid in your investment decisions.
Let’s dive into the most recent predictions for Litecoin’s price for 2026, 2027, and beyond!
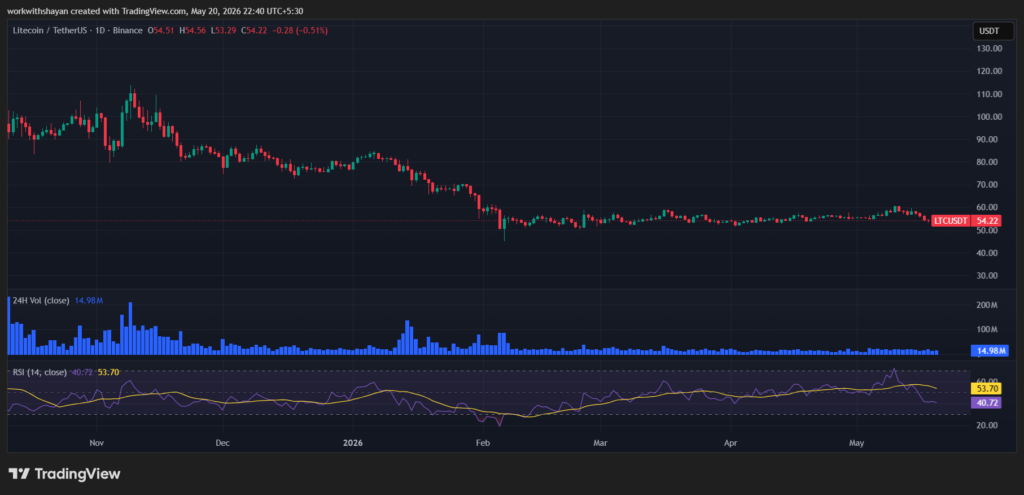
The LTC price analysis for 20 May confirms that the LTC price faced bullish pressure above $54. Currently, buyers are holding the price around key resistance levels.
Analyzing the daily price chart, Litecoin experienced bullish pressure as the overall sentiment turned positive. Buyers are now aiming for a push above immediate Fib levels toward $54. However, it also faces minor bearish retracement. The 24-hour volume increased to $15 million, showing a surge in interest in trading activity. LTC price is currently trading at $54, surging by over 0.2% in the last 24 hours.
The RSI-14 trend line has dropped from its previous level and trades below the midline at 40, suggesting that sellers are controlling the price chart.
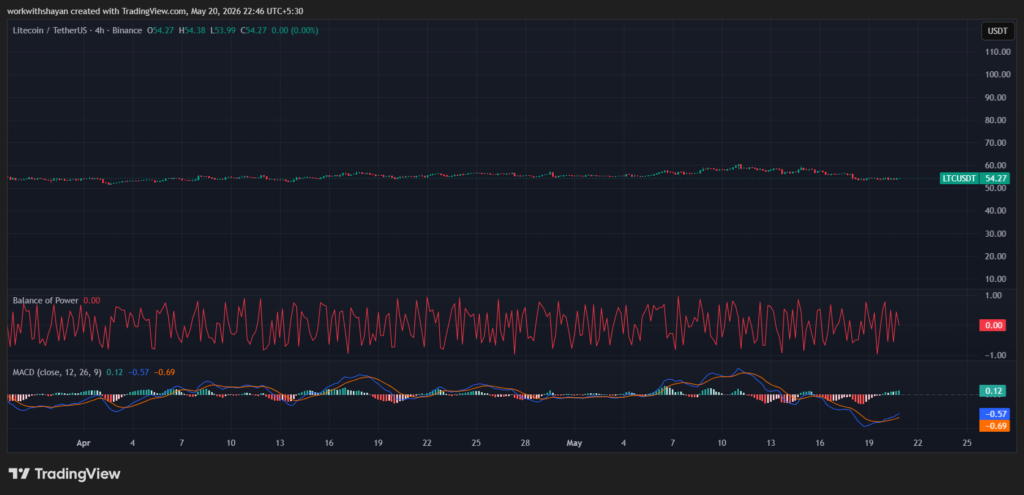
LTC/USD 4-hour price chart: Bulls aim for a hold above EMA trend lines
The 4-hour Litecoin price chart suggests that bullish domination is increasing to keep the altcoin above the EMA trend lines. Currently, buyers are defending a drop below the EMA20 trend line.
The BoP indicator trades in a positive region at 0, signifying that buyers are triggering a minor upward correction.
Additionally, the MACD trend line has formed green candles above the signal line, and the indicator aims for positive momentum, strengthening the chances of a bullish push.
Litecoin technical indicators: Levels and action
Daily simple moving average (SMA)
Period
Value
Action
SMA 3
$57.88
SELL
SMA 5
$58.44
SELL
SMA 10
$57.50
SELL
SMA 21
$56.59
BUY
SMA 50
$55.38
BUY
SMA 100
$55.10
BUY
SMA 200
$68.76
SELL
Daily exponential moving average (EMA)
Period
Value
Action
EMA 3
$57.74
SELL
EMA 5
$57.87
SELL
EMA 10
$57.54
SELL
EMA 21
$56.82
BUY
EMA 50
$56.29
BUY
EMA 100
$58.98
SELL
EMA 200
$66.87
SELL
What to expect from LTC price analysis next?
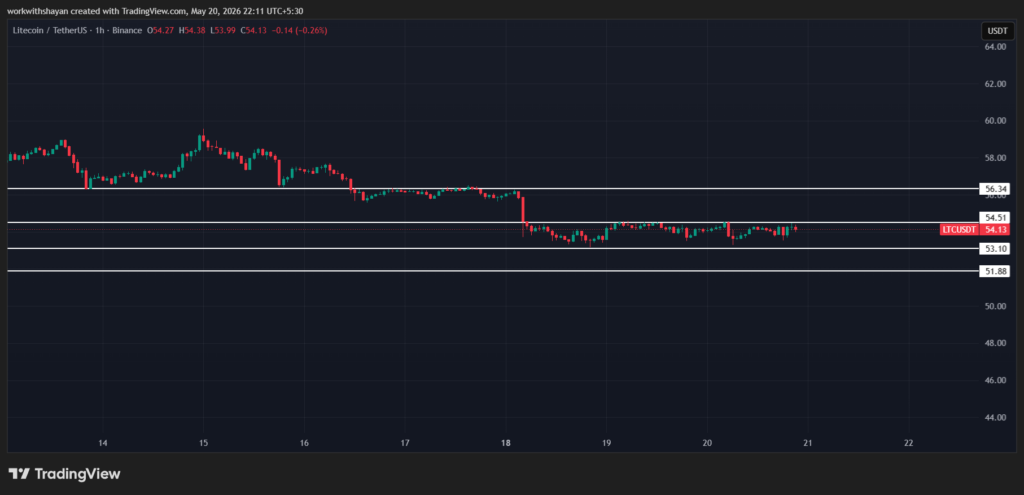
The hourly price chart confirms that bulls induce buying pressure to hold the price; however, sellers may soon return. If the LTC holds momentum above $54.51, it may climb toward $56.34.
If bulls fail to initiate a surge, the LTC price may drop below the immediate support line at $53.1, which may result in a correction to $51.88.
Is Litecoin a good investment?
Litecoin is an alternative to Bitcoin, making it an appealing choice for everyday transactions worldwide. Additionally, with a finite cap of 84 million coins, LTC presents itself as a potential investment for value preservation, akin to Bitcoin’s role as a digital asset.
Why is the LTC price up today?
Buyers are triggering a push above Fib levels at $54 as lower levels saw minor accumulation on the LTC price chart.
Will LTC Recover?
If bulls hold the price above the $60 level, we might see a strong recovery in the coming days.
What is the LTC price prediction for 2026?
The forecasted lowest price for Litecoin is $60. According to our analysis, the highest possible price for LTC could be $160, with an average expected price of $125.
Will Litecoin reach $100?
Litecoin price already touched the $100 mark last year; however, it is now consolidating. By the end of 2026, Litecoin might surge above $150.
Will LTC price reach $500?
According to our Litecoin price prediction, the LTC price might hit the $500 mark in 2030. However, this rally depends on the future buying interest in the altcoin market.
Does LTC have a good long-term future?
Despite the recent adjustments and potential peak formation, Litecoin exhibits a robust long-term price trajectory and outlook, indicating a high potential for future growth. If the network continues to witness robust activities and growth, the price might reach $1000 in no time.
Recent news/opinion on Litecoin
Litecoin underwent a 13-block reorganization on April 25 after a bug in its MWEB privacy layer enabled invalid transactions. Developers quickly released a mandatory patch and coordinated with mining pools to remove the fraudulent blocks.
Litecoin update:
• A zero-day bug caused a DoS attack that disrupted major mining pools. • Non-updated mining nodes allowed an invalid MWEB transaction allowing them to peg out coins to third party DEX’s • A 13-block reorg reversed those invalid transactions — they will not…
Litecoin’s price shows signs of bullish moves as it has been surging toward $60. However, as BTC’s price aims for a hold above the $80K mark in May, Litecoin’s price intends to end this month on a bullish note.
As a result, we might see the LTC price record a low of $50, with a maximum price of $70 and an average price of $60.
Month
Potential Low ($)
Potential Average ($)
Potential High ($)
Litecoin Price Prediction May 2026
$50
$60
$70
Litecoin price prediction 2026
The forecasted lowest price for Litecoin is $50. According to our analysis, the highest possible price for LTC could be $160, with an average expected price of $125.
Year
Potential Low ($)
Potential Average ($)
Potential High ($)
Litecoin Price Prediction 2026
50
125
160
Litecoin Price Predictions 2027-2032
Year
Minimum Price ($)
Average Price ($)
Maximum Price ($)
2027
126.67
172.3
200.87
2028
245.93
252.82
291.04
2029
317.79
381.9
423.14
2030
534.25
549.53
651.74
2031
747.98
775.45
899.15
2032
1,095.74
1,126.76
1,338.47
Litecoin price prediction 2027
Litecoin’s growing popularity is evident in its expanding social media presence, particularly on Reddit, with active users reaching 2021 levels before its all-time high.
Experts predict a significant rally by 2027, with prices ranging between $126.67 and $200.87 and an average of $172.30. Advancements from the Litecoin Foundation are expected to drive a strong rebound, boosting its market cap and valuation.
Litecoin (LTC) price prediction 2028
In 2028, the price of Litecoin is expected to reach a minimum value of $245.93. The maximum price could be as high as $291.04, with the average trading price throughout the year around $252.82.
Litecoin price prediction 2029
In 2029, the lowest forecasted price of Litecoin is $317.79. Based on our analysis, the maximum price could rise to $423.14, with an average price of $381.90 for the year.
Litecoin’s price forecast 2030
Our detailed analysis of past Litecoin price data indicates that in 2030, the minimum price of Litecoin could be approximately $534.25. The price could peak at $651.74, with an average trading value around $549.53.
Litecoin (LTC) price prediction 2031
For 2031, the minimum predicted price of Litecoin is $747.98. The price could reach a maximum of $899.15, with the average trading price expected to be about $775.45 throughout the year.
Litecoin price prediction 2032
Our detailed analysis of past Litecoin price data indicates that in 2032, the minimum price of Litecoin could be approximately $1,095.74. The price could peak at $1,338.47, with an average trading value around $1,126.76.
According to the Litecoin price prediction by Cryptopolitan, it is anticipated that various leading institutions will invest in and start accepting LTC as a form of payment. Additionally, the growing frequency of events likely to influence LTC’s price could enhance its public perception.
The forecasted lowest price for Litecoin is $50 in 2026. According to our analysis, the highest possible price for LTC could be $160, with an average expected price of $125.
Litecoin traded between $1 and $5 in its early years before surging to over $300 during the crypto bubble of late 2017 to early 2018.
In 2021, Litecoin hit an all-time high of $412.96 early in the year but dropped significantly, closing at $144.56 by the end of the year.
In 2022, Litecoin experienced significant losses, dropping below $45 mid-year. However, it managed to outperform the broader market despite a nearly 55% decline overall.
2023 saw high volatility for Litecoin, peaking at $114.50 in July but declining sharply due to market pressures, ending the year at $72.80 with a modest 7% rise despite underperforming the broader market.
In 2024, Litecoin started the year around $68.20, climbed to $102.40 in April, and then fell below $80. After further declines in May and June, it dropped to $49 in August before rebounding to $70. By November, Litecoin surged past $100 and attempted to hold above $140 in December.
In January 2025, the price of Litecoin surged to $140.
However, the LTC price crashed in February as it dropped toward the low of $80.
In March, the price of LTC consolidated below $90 after failing to break the $100 resistance. By the end of April, LTC price surged toward the $88 but struggled to maintain that level in early May.
By the end of June, LTC price declined below $85. In July, the price surged toward $123 but declined later.
In early August, the price of Litecoin aimed for a move above $125. However, it later declined and dropped below $110 in early September.
In early October, the price of Litecoin surged toward $125 twice but failed to meet buyers’ demand.
In November, the LTC price dropped below the $80 level. By the end of the month, the price of LTC consolidated below $85.
LTC ended 2025 on a bearish note by trading below $80. In January 2026, the price of LTC declined further as it crashed toward $44 in February.
In early April, the price of LTC surged toward $53. By the end of April, LTC surged toward $57.
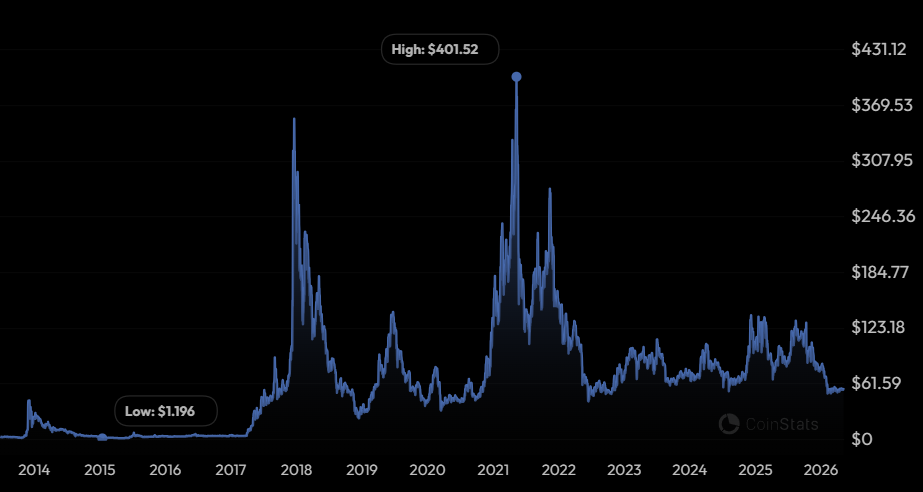
Rocket Pool price prediction for 2026 could reach a maximum value of $19.01
In 2029, the coin could be worth between $7.11 and $9.02, with an average price of $7.38
In 2032, RPL will range between $21.67 and $25.87
Unlike traditional staking services, Rocket Pool allows users to pool their Ethereum (ETH) to run validator nodes on the Ethereum network. Thus, participants can participate in the staking process without requiring the full 32 ETH to run a validator node.
Furthermore, Rocket Pool introduces the concept of “rETH” tokens, which are issued to users who stake ETH in the Rocket Pool network. These rETH tokens represent users’ stake in the pool and can be traded or transferred independently of the underlying ETH, providing liquidity and flexibility to participants.
Overall, Rocket Pool aims to democratize Ethereum staking and contribute to the decentralization of the Ethereum network by providing a secure, efficient, and accessible platform for staking participation. As DeFi continues to gain traction, Rocket Pool stands out as a pioneering project at the forefront of innovation in the cryptocurrency ecosystem.
What can traders and investors expect in the coming months and years? Can Rocket Pool’s price reach $50?
Overview
Cryptocurrency
Rocket Pool
Token
RPL
Price
$1.76
Market Cap
$39.26M
Trading Volume(24-hour)
$3.44M
Circulating Supply
22.03 Million RPL
All-time High Date
$154.73 on Nov 16, 2021
All-time Low Date
$0.09118 on May 17, 2019
24-hour High
$1.78
24-hour Low
$1.69
Rocket Pool technical analysis
Metric
Value
Price Prediction
$ 1.89 (6.28%)
Price Volatility
7.60% (High)
50-day SMA
$ 2.00
14-Day RSI
53.23 (Neutral)
Sentiment
Bearish
Fear & Greed Index
8 (Extreme Fear)
Green Days
9/30 (30%)
200-Day SMA
$ 3.69
Rocket Pool price analysis
TL;DR Breakdown:
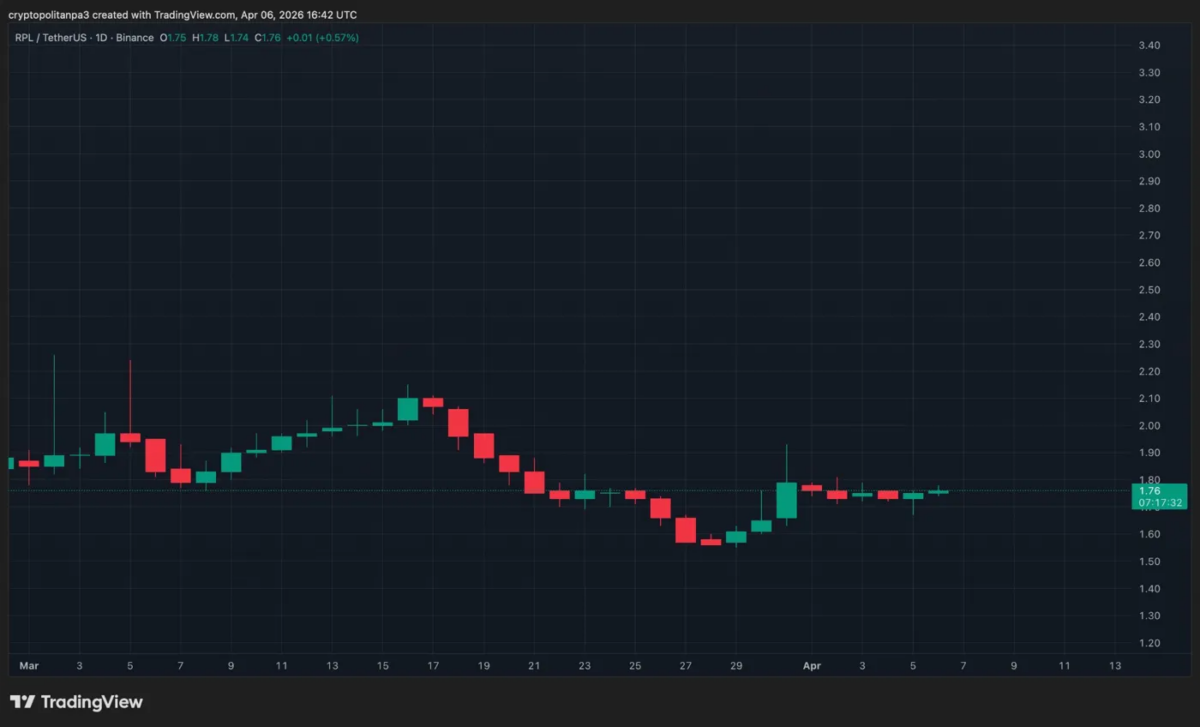
RPL collapsed 30% from its March 3 peak of $2.30 to a low of $1.62 on March 28, with both the 1D and 4H charts showing relentless lower highs and aggressive selling throughout the month.
Price has been consolidating in a tight $1.74–1.80 range for over a week — choppy, low-conviction candles signal indecision rather than genuine recovery momentum.
Bulls need a clean break above $1.85–1.90 to target $2.00, while a breakdown below $1.72 risks a swift return to the $1.62 March low and potentially $1.50.
Rocket Pool trades at $1.76, up 0.57%, but the daily chart reveals a clear bearish downtrend throughout March 2026. Price peaked near $2.15 on March 17 before collapsing 26% to a low of $1.62 on March 28 — a sharp, sustained decline with little buying response. A modest recovery has since brought price back to $1.74–1.78, where it has been consolidating for over a week. Key resistance sits at $1.80–$1.90. A break above $1.90 could target $2.00–$2.15. Failure to hold $1.70 risks a retest of $1.62. Structure remains cautiously bearish.
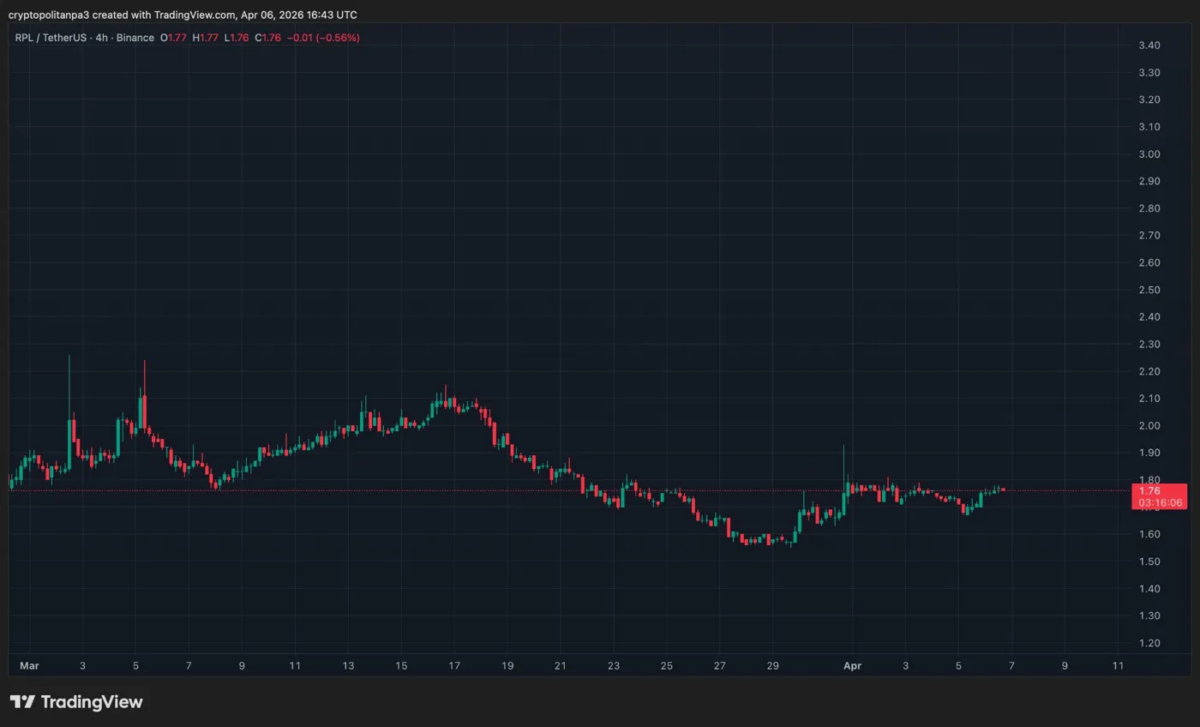
Rocket Pool trades at $1.76, down 0.56%, with the 4H chart showing a sharp peak-to-trough decline from $2.30 on March 3 to a low of $1.62 on March 28 — a 30% collapse in under four weeks. The recovery from those lows has been gradual and choppy, with price now consolidating tightly in a narrow $1.74–1.80 band for over a week. Candles are small and indecisive — classic low-conviction ranging. Resistance at $1.85–1.90 must be broken for any meaningful upside. A slip below $1.72 risks revisiting $1.62. Momentum remains neutrally bearish with no clear directional signal yet.
RPL technical indicators: Levels and action
Daily simple moving average (SMA)
Period
Value ($)
Action
SMA 3
2.21
SELL
SMA 5
2.26
SELL
SMA 10
2.18
SELL
SMA 21
1.86
BUY
SMA 50
2.00
SELL
SMA 100
2.17
SELL
SMA 200
3.69
SELL
Daily exponential moving average (EMA)
Period
Value ($)
Action
EMA 3
1.99
BUY
EMA 5
1.99
BUY
EMA 10
2.01
SELL
EMA 21
2.04
SELL
EMA 50
2.28
SELL
EMA 100
2.96
SELL
EMA 200
4.13
SELL
What can you expect from RPL price analysis next?
RPL is at a crossroads at $1.76, trapped in a tight $1.74–1.80 consolidation range after a brutal 30% March decline. Two scenarios are likely — a breakout above $1.85–1.90 could spark a recovery toward $2.00–$2.15, especially with the Saturn upgrade and new Commit-Boost support via Smart Node v1.19.3 providing fundamental tailwinds. However, the broader structure remains bearish — a breakdown below $1.72 risks a retest of the $1.62 March low and potentially $1.50. Without a significant catalyst or broader market recovery, RPL is more likely to remain range-bound than mount a meaningful recovery.
Is Rocket Pool a good investment?
Rocket Pool (RPL) presents a compelling investment opportunity due to its innovative decentralized Ethereum staking model, offering potentially high returns through staking rewards. However, investors should consider market volatility and competition within the DeFi space. Conduct thorough research and assess personal risk tolerance before investing in RPL.
Why is Rocket Pool up today?
RPL’s modest 4.3% gain today (Apr 6) is driven by a combination of protocol-specific and technical factors. The Saturn One upgrade launched in February 2026 introduced a fee switch making RPL a yield-generating asset, and lower node entry barriers (4 ETH instead of 8 ETH) drove a 35% surge in active nodes during Q1 2026 — fundamentally strengthening demand. The latest Smart Node v1.19.3 update adding Commit-Boost support is also generating fresh interest from node operators. Today’s bounce reflects dip-buying from oversold levels after the recent 15% weekly decline, with trading volume surging 30.40% signaling renewed market activity.
Will Rocket Pool reach $50?
Rocket Pool (RPL) reaching $50 appears possible but is uncertain. Predictions suggest a range of $14.90 to $18.42 for 2031, assuming favorable market conditions and improved investor sentiment. However, significant upward momentum is required to achieve this target soon.
Will Rocket Pool reach $150?
Reaching $150 for Rocket Pool (RPL) seems highly ambitious and unlikely in the near term. Our Rocket Pool forecast suggests that RPL may peak at around $18.42 by 2031.
Is Rocket Pool a safe investment?
Rocket Pool is generally considered a secure investment due to its decentralized structure, robust security audits, and a significant total value locked (over $4.4 billion), which reflects user confidence. However, like all cryptocurrencies, it carries inherent risks due to market volatility and potential technical vulnerabilities
Does RPL have a good long-term future?
RPL’s chart shows an immediate outlook that appears bearish. However, assessing its long-term future requires considering broader market trends.
Recent news/ opinion on Rocket Pool
Rocket Pool’s Smart Node v1.19.3 now supports Commit-Boost, enabling node operators to access MEV-Boost-compatible features including opt-in preconfirmation commitment systems.
Smart Node now supports @Commit_Boost as of v1.19.3.
Commit-boost is open-source software that is fully compatible with MEV-Boost protocol, but comes with new features and allows node operators to opt in to commitment systems eg preconfimations. pic.twitter.com/DgpS3M9ypI
The highest Rocket Pool price in April 2026 is expected to be around $6.49. Moreover, RPL’s minimum price in April 2026 is $1.40, with an average price of $3.77.
Period
Minimum price
Average price
Maximum price
April 2026
$1.40
$3.77
$6.49
Rocket Pool Price Forecast 2026
In 2026, RPL’s average forecast price is expected to be approximately $16.21. Its minimum and maximum prices can be expected at $13.76 and $19.01, respectively.
Period
Minimum price
Average price
Maximum price
RPL price prediction 2026
$13.76
$16.21
$19.01
Rocket Pool Price Predictions 2027 – 2032
Year
Minimum price
Average price
Maximum price
2027
$3.57
$3.67
$4.07
2028
$5.25
$5.44
$6.31
2029
$7.11
$7.38
$9.02
2030
$10.33
$10.62
$12.45
2031
$14.90
$15.43
$18.42
2032
$21.65
$22.42
$25.87
Rocket Pool Price Prediction 2027
Based on market trends and network performance, Rocket Pool (RPL) could trade between $3.57 and $4.65 in 2027, averaging $3.67.
Rocket Pool (RPL) price prediction 2028
As per the forecast price and technical analysis, in 2028, the price of Rocket Pool (RPL) is predicted to reach a minimum of $5.25, a maximum of $6.31, and an average trading price of $5.44. This expected rise is fueled by continued Ethereum staking growth, expanding liquid staking adoption, and Rocket Pool’s decentralized infrastructure attracting both institutional and retail validators, strengthening long-term network utility and token demand.
Rocket Pool Price Prediction 2029
The price of Rocket Pool (RPL) is predicted to reach a minimum value of $7.11 in 2029, with a maximum of $9.02 and an average trading price of $7.38. This projection is supported by the increasing dominance of decentralized staking, higher Ethereum participation rates, and Rocket Pool’s growing reputation for providing secure, permissionless validator services, driving sustained demand and ecosystem expansion.
Rocket Pool Price Prediction 2030
Rocket Pool price is forecast to reach a lowest possible level of $10.33 in 2030. As per analysts, the RPL price could reach a maximum possible level of $12.45 with an average forecast price of $10.62. This growth outlook is driven by rising Ethereum staking participation, increased preference for decentralized validator solutions, and Rocket Pool’s expanding role in liquid staking markets, which enhance network utility and long-term investor confidence.
Rocket Pool (RPL) price prediction 2031
As per the forecast and technical analysis, in 2031, the price of Rocket Pool (RPL) is expected to reach a minimum of $14.90, a maximum of $18.42, and an average of $15.43.
Rocket Pool Price Prediction 2032
The price of Rocket Pool (RPL) is predicted to reach a minimum value of $21.63 in 2032, with a maximum of $25.87 and an average trading price of $22.42. This optimistic projection stems from Rocket Pool’s evolution into a leading decentralized staking protocol, benefiting from widespread Ethereum adoption, advanced staking infrastructure, and growing institutional trust in non-custodial yield solutions, all of which reinforce steady value appreciation and network resilience.
Rocket pool price prediction 2026-2032
Rocket Pool market price prediction: Analysts’ RPL price forecast
Firm Name
2026
2027
DigitalCoinPrice
$0.0827
$0.17
Coincodex
$1.11
$ 1.89
Cryptopolitan’s Rocket Pool price prediction
According to Cryptopolitan’s forecast, Rocket Pool (RPL) is expected to have a maximum price of $2.28 in 2026. Looking ahead, we predict that RPL’s maximum market price for 2032 might reach $20.70.
Rocket Pool’s historic price sentiment
RPL price history by Coingecko
The year 2020 marked a transformative period for Rocket Pool, with its price starting at $0.4877 in January and soaring to $3.70 by August, reflecting substantial growth.
Despite early challenges in 2020, with prices as low as $0.3813 in March, Rocket Pool demonstrated resilience and ended the year on a positive note, closing at $4.27 in December.
Notably, Rocket Pool experienced a surge in trading volume during the latter half of 2020, indicating increasing investor interest and confidence in the company’s prospects.
2021 showcased volatility in Rocket Pool’s price, with highs of $51.27 in November amidst a peak in trading volume. However, it faced significant lows earlier in the year, dipping to $4.27 in January.
The year 2022 reflected a mixed sentiment, with Rocket Pool experiencing peaks and valleys. It started the year at $27.57, showing promise, but ended with a decline to $10.50 by June.
In 2023, the stock witnessed a bullish trend, reaching its peak in March with a high of $64.29. However, it experienced a sharp decline thereafter, closing the year at $27.57, indicating a substantial downturn.
In 2024, RPL peaked at $38 in March before dropping to $18 by May, then fluctuated between $13 and $28 through July. By November 2024, it fell to $8.8, climbed to $17.6 in December, and closed the year at $11.7.
In 2025, RPL ranged around $12 in January, spiked to $62 in February, and then in May, it’s trading between $3.9–$4.4.
RPL ended May at $4.9. In June, RPL is trading between $4.0 and $6.2
RPL ended June at $5.30. In the beginning of July RPL is trading between $4.84-$5.10
PL dropped from approximately $7.73 on July 31 to about $6.61 on August 1, a decline of roughly –14.5% in two days.
August 2 to August 4/5: The token rebounded from $6.30 on August 2 to $6.48 on August 3, then climbed to around $6.92 by August 4, reflecting a recovery exceeding +10%
At the start of August, RPL traded between approximately $6.87 and $8.08, reaching highs above $9.00 on August 9 before losing traction and ending the month around $7.08.
In early September, RPL pulled back, closing near $6.68 on September 1, then declined to around $6.63, before dropping further to approximately $6.40 by September 6.
Overall, RPL shifted from a mid-August peak above $9.00 to trading near $6.40 by September 6, reflecting a steady downward move over the month.
Since September 6, RPL has shown resistance around the $5.80 Fibonacci zone, with repeated rejections as traders pocket gains on rally attempts.
Aound late September 2025, RPL was trading at approximately $5.16 after earlier levels in the $5.30–$5.60 range.
In early October, on October 12–13, RPL dropped to about $3.44–$3.82, reflecting a sharp decline in value.
Mid-October saw a brief recovery with a high around $4.04 on October 13, before continuing downward.
Late October (around October 30) shows RPL trading near $3.37, indicating continued consolidation at lower levels.
By early November 3, RPL remains in the $3.30–$3.40 region, pointing to a stabilization phase after the prior declines.
In early November (around Nov 7–10) RPL traded near $30–$32, coinciding with a broader market rebound.
Through mid-to-late November the price drifted downward to around $24–$26, reflecting general market cooling and altcoin weakness.
By early December (Dec 5–9), RPL stabilized near $22–$23, showing consolidation after the drop and holding modest support levels.
Early to Mid-December 2025: From around $2.29 on Dec 12, RPL mostly traded between roughly $2.00 and $2.30, dipping into the $1.80–$1.90 area as the market fluctuated.
Late December to Mid-January 2026: Into early January, RPL climbed above $2.10–$2.20, peaking near $2.28 on Jan 6 before consolidating around $2.10–$2.20 by Jan 18, 2026.
Around January 16 2026 Rocket Pool was trading near the $2.10 to $2.20 range after rebounding from earlier lows, with price moving sideways as traders weighed whether the recovery could extend.
By February 2 2026 RPL had slipped toward roughly $1.90 to $2.00, showing renewed selling pressure and fading bullish momentum as profit taking and weak sentiment pulled prices lower.
RPL opened February 2 around $1.51, consolidating near those depressed levels through mid-February as broader crypto selling pressure kept the token range-bound near its multi-year lows — trading 97.2% below its all-time high of $61.90.
Through March, RPL attempted a modest recovery, gradually climbing from lows of around $1.50 toward $1.65–1.76, aided by the Saturn upgrade anticipation and node operator demand — gaining approximately 6.49% in the final week of March alone.
By April 6, RPL was trading at $1.77, up 1.19% on the day — representing a modest overall recovery of roughly 17% from February lows, though the token remains deeply depressed with a market cap of only $39.3M.
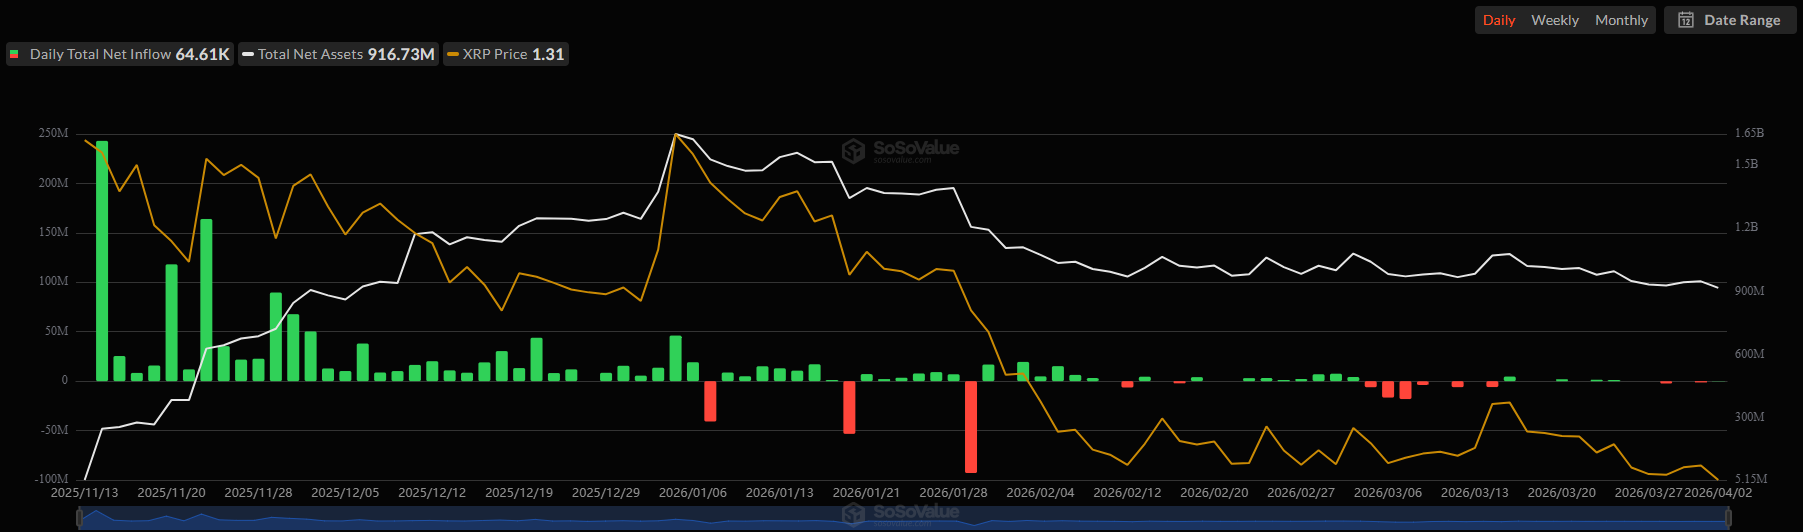
The spot exchange-traded funds tracking the performance of Ripple’s cross-border token continue to dig new lows, as they just ended their first month in the red in March.
The landscape is even more worrying when we examine the details, while XRP is currently losing the battle for the fourth spot against BNB.
XRP ETFs Fall Short
After years of building anticipation, the first spot XRP ETF (Canary Capital’s XRPC) had a highly successful debut day, breaking the launch-day trading volume for 2025. Four more such products followed suit, and they attracted over $1 billion in about a month. Moreover, they didn’t have a single red day in terms of net flows for almost two months before that streak broke on January 7 – something that even the BTC and ETH ETFs couldn’t do.
In November and December, they gained $666.61 million and $500 million, respectively. The before-launch hype seemed justified. However, the following two months were more modest, perhaps driven by quickly escalating global tension. January recorded just $15.59 million in net inflows, while February saw $58.09 million.
The landscape worsened in March as the war-induced tension skyrocketed, oil prices soared, and uncertainty and doubt crept into all financial markets. Investors pulled out $31.16 million from the spot XRP ETFs, making it the first red month since their launch in November last year.
What’s even more concerning is the fact that there were multiple days with no reportable inflows at all. 8 out of the 22 trading days have $0.00 against them on SoSoValue, clearly showing disappearing demand.
Ripple (XRP) ETF Flows. Source: SoSoValue
XRP in Danger
Amid this ongoing investor exodus from the ETFs, the underlying asset has expectedly underperformed, slipping by over 3% weekly. Moreover, XRP now stands inches below the coveted $1.30 support, which, if lost decisively, could lead to more profound corrections.
Popular analyst CW recently warned that a potential drop to $1.26 could trigger mass high-leverage long liquidations.
Fellow analyst CRYPTOWZRD noted that XRP had closed the previous daily candle indecisively and is “teasing the $1.32 intraday resistance.” If it remains below it, the analyst predicted more “weakness and short opportunities.”
The third quarter of 2025 is already stirring the markets, with analysts pointing to new opportunities that are quietly outperforming expectations. One project that keeps coming up in serious investor conversations is Mutuum Finance (MUTM)—a decentralized finance platform that’s gathering real traction thanks to its token’s current $0.03 price and what many consider a very clear setup for long-term growth.
While many are still looking for the next breakout on familiar names, the smarter money is shifting. Ethereum (ETH) investors, for example, have started diversifying into Mutuum Finance—not because ETH has failed them, but because they see similar early-stage signals and strong fundamentals that ETH once showed before becoming a giant.
Why Mutuum Finance (MUTM) Is Entering Investor Watchlists
Mutuum Finance (MUTM) isn’t another copy-paste project trying to jump on a trend. It’s a dedicated liquidity protocol that allows users to lend, borrow, or act as liquidators directly through non-custodial smart contracts. The platform offers two models—Peer-to-Contract (P2C) and Peer-to-Peer (P2P)—which allows it to serve both mainstream digital assets and more volatile tokens, like meme coins, in a controlled and scalable way.
Lenders deposit their digital assets into protocol-managed pools, earning interest that adjusts automatically based on pool utilization. Borrowers, on the other hand, lock collateral to take overcollateralized loans. There’s no waiting for matches—the liquidity pool handles the flow.
With no fixed loan deadlines, flexible interest rate options, and a strong on-chain mechanism to protect lender funds via liquidation thresholds, Mutuum Finance offers a lending and borrowing experience that feels optimized for the current state of decentralized finance.
The Presale Is in Phase 5, and Nearly Out
MUTM is currently in Phase 5 of its presale, priced at just $0.03. The token has already gone through several price increases from its initial $0.01 launch, and the current stage is already over 80% sold. Once Phase 5 closes, the price jumps to $0.035, with a launch price of $0.06 confirmed by the team.
This setup creates a clear near-term return for investors: a 100% ROI by launch for those entering now. But that’s just the beginning. Those who got in during Phase 1 will see a 6x return when the token lists. According to several analysts watching this closely, MUTM has the setup to hit $1 or more by Q1 2026, based on utility rollout, community growth, and exchange traction.
Why ETH Investors Are Moving into MUTM
Ethereum has been a core portfolio asset for years, and it remains a foundational layer in crypto. But early ETH holders know the value of getting in before the rest of the market catches on. That’s why many of them are now entering Mutuum Finance as a new long-term bet.
The platform is built with a roadmap that includes Layer 2 integrations, which will drastically lower gas fees and increase throughput—both critical for user retention. nvestors are also drawn to the fact that Mutuum Finance is prioritizing ecosystem development before pushing the token to market—flipping the usual launch-first approach. That’s the kind of logic early ETH buyers used when investing years ago.
Utility-Driven Features Give MUTM a Strong Long-Term Case
What sets Mutuum Finance apart is its focus on practical DeFi functionality, not just speculative trading. It’s currently finalizing the development of an overcollateralized stablecoin, which will be minted from user collateral and maintain a soft peg to the U.S. Dollar. This stablecoin won’t require separate liquidity pools, and all interest from these loans will flow directly into the protocol’s treasury—strengthening it over time.
In addition, users receive mtTokens at a 1:1 ratio when they deposit assets. Each token tracks your deposit and steadily gains value as interest builds up. They can be traded, transferred, or used elsewhere in the ecosystem, all while continuing to increase in value.
MUTM holders also benefit from a buy-and-distribute mechanism, where protocol earnings are used to purchase MUTM from the open market and send them as rewards to users who lock mtTokens in the safety module. This creates constant buy pressure and incentivizes long-term participation.
Security and Audit Add to Investor Confidence
Another strong signal for investors is Mutuum Finance’s audit completion with CertiK, one of the most trusted security firms in crypto. A successful audit not only adds a layer of technical validation, but it also increases the likelihood of listings on reputable exchanges when the token officially launches.
Add to this the upcoming beta version of the platform, expected to go live around the token launch window, and you have the full picture: utility, momentum, security, and growth—all aligned.
This May Be the Best Cryptocurrency to Buy in Q3
With so many low-cap cryptocurrencies competing for attention, few offer what Mutuum Finance (MUTM) brings to the table: a growing base of over 13,700 holders, a clear product roadmap, active presale momentum, and a token price still under $0.05.
As the presale continues toward Phase 6, the window to enter at $0.03 is closing. With solid fundamentals and a clear pathway to utility, MUTM is gaining serious traction among investors looking for the next big cryptocurrency for the long haul.
For more information about Mutuum Finance (MUTM) visit the links below:
The window is closing fast, and early movers are already circling Mutuum Finance (MUTM) and Pepe Coin (PEPE). Mutuum Finance (MUTM) has been dubbed the best crypto to buy in 2025. Stage 5 presale of MUTM is priced at $0.03. The phase have been sold over 65%. Mutuum Finance has so far been able to raise more than $12.1 million and more than 13100 investors are currently on board.
While PEPE and other names maintain their positions, the real power play this season is stacking the right tokens before the crowd catches up. Mutuum Finance could hit $1.6 post launch with the 2500% predictions.
PEPE Mid‑Summer Status Update
Pepe (PEPE), the Ethereum‑based meme token inspired by the notorious internet frog, is currently trading around $0.0000128, marking a sharp +28 % gain over the past week and bumping 14 % in the last 24 hours. With a circulating supply of approximately 420.7 trillion tokens and a market cap hovering near $5.4 billion, PEPE remains firmly ranked among the top meme tokens, just behind Dogecoin and Shiba Inu.
While it lacks intrinsic utility, it’s designed as a pure meme play with token‑burn mechanics to support scarcity, it has consistently outperformed broader crypto benchmarks lately. Though it’s not stealing headlines like Mutuum Finance, it offers seasoned memecoin enthusiasts a way to ride the wave this summer before the next narrative shift, with that shift looking increasingly focused on MUTM.
Mutuum Finance Presale Sees Sudden Growth
More than 13100 investors have joined the Mutuum Finance (MUTM) presale that has raised above $12.1 million. There is a lot of hype concerning the project and it is so evident that it is indeed a very positive evidence of the project being on the right track. MUTM tokens stand at $0.03 in phase 5 and will increase by 16.67% in phase 6. This stage has already passed over 65% of its sales as investors are keen to buy at the lowest possible price.
The demand is growing exponentially and the fact that Mutuum Finance is a DeFi disruptor is even more precious considering the fact that it will be one of the best crypto investments of 2025.
CertiK-Secured Bug Bounty Program Awards $50,000 Rewards
Security always comes first for Mutuum Finance. In collaboration with CertiK, the platform has now launched its Bug Bounty Program officially with a combined reward pool amounting to $50,000 USDT. The program has four severity levels, critical, major, minor, and low, to ensure that any potential vulnerability would be found and rewarded appropriately. This is in support of the team’s commitment to building a secure, transparent, and high-quality DeFi protocol.
As the days of summer get hot, investors are securing early entries in projects with humongous upside potential and Mutuum Finance (MUTM) is the front runner. Having gathered more than $12.1 million, followed by an investor base of 13,100+, the project has already sold out 65% of Stage 5. With only $0.03, one will find an extraordinary entry point into MUTM which is projected to soar 2500% reaching a projected price point of $1.60 after the launch. Mutuum Finance will raise the bar in the crypto sphere with a sound DeFi lending concept, a $100K community giveaway, and a bug bounty worth $50K. Become a MUTM holder now and make sure you enter before the prices in Phase 6 increase.
For more information about Mutuum Finance (MUTM) visit the links below
As Dogecoin makes the latest news as bulls defend the $0.15 support level, attention is shifting toward Mutuum Finance (MUTM), which is sweeping across the crypto market. The 5th presale stage of Mutuum Finance is over 60% sold out already. The project has raised more than $11.8 million and acquired 12,700 investors.
Mutuum Finance has an estimated ROI of 17,820% according to early predictions. This means that it may reach a price of up to $10.7 after its launch. With investors going on a search of the best crypto to invest in now, Mutuum Finance is gaining serious grounds as one of the standout cryptos to invest in.
Dogecoin Holds Strong at $0.17 as Bulls Keep Momentum Alive
Dogecoin (DOGE) has already recovered, losing momentum and price action around the support point of $0.15 and now is trading around $0.17. Although the market volatility has hit DOGE recently, the cryptocurrency has not been mired down by it and the current movement is bullish which could lead to an upcoming short-term rally.
Nevertheless, should the price fall below the $0.15 mark then the support can be sought at the price around the $0.13 mark. Mutuum Finance is a newer utility-oriented project that some investors are considering as they seek the next breakout project in that regard, as Dogecoin takes advantage of the community energy.
Mutuum Finance Presale Phase 5 Now Over 60% Filled
Mutuum Finance presale Phase 5 is underway and gaining strong momentum. Already over 12,700 investors have come aboard the project and raised $11.8 million, which is testimony to its growing hype. With Phase 5 having crossed the 60% mark, price increases are imminent. Buying now guarantees investors the lowest possible price for maximum ROI when the token goes live.
Mutuum Finance Launches 50,000 Bug Bounty
Mutuum Finance in its focus on security and transparency has even initiated its official Bug Bounty Program in collaboration with CertiK with a reward value of 50,000 USDT. The reward is given in four categories, critical, major, minor and low where there is coverage and reward for all types of vulnerabilities. This is another aspect that reflects the proactive approach of Mutuum Finance towards establishment of trust in the form of strong infrastructure and beneficial security.
The Mutuum Finance $100,000 Giveaway
The project has already been audited by CertiK and is leading towards the realization of the huge adoption and those who buy right now will benefit most in the future. On top of that, the platform is hosting an amazing $100,000 giveaway, where 10 lucky people will receive $10 000 each.
Dogecoin is maintaining its position above the 0.15 mark and building toward breakout past $0.20. Having exceeded 12,700+ investors with the raise at more than $11.8 million, and Phase 5 now already over 60% sold out, the numbers speak of themselves.
With a CertiK security audit, a massive $50k bug bounty, and a strong dual lending paradigm Mutuum Finance is not only promising, it is delivering.
Early investors will be looking forward to an estimated 17,820% ROI with the price reaching $10.70. With a dynamic $100,000 giveaway now is the moment to join in. Buy MUTM tokens now before the next lift-off and before the end of Phase 5.
For more information about Mutuum Finance (MUTM) visit the links below


 ETFs Went From Bad to Worse: First Red Month and No Inflow Days")


 Goes Parabolic With 17,820% ROI Potential")