Reddit will be added to the S&P 500 before the start of trading on August 18. J.P. Morgan estimates the change will force index funds to buy 16.7 million of its shares.
The stock soared more than 11% Friday after S&P Dow Jones Indices confirmed the move.
S&P additions trail the benchmark by 2% after three months
Since its debut in March 2024, Reddit (RDDT) has traded an average of 5.98 million shares per day. Passive funds have to buy 16.7 million shares, or close to three full sessions of normal activity crammed into the rebalance.
Shares were near $175.69, and more than $201 million of the stock had already changed hands by 9:32 a.m. ET Friday. A later intraday quote had Reddit up 14.55% at $181.12.
Analyst Melissa Roberts at Stephens said new additions to the S&P 500 have historically outperformed the index from the announcement to the actual inclusion, with the biggest move coming the day after the news.
Once a stock is in, those gains tend to dissipate, she said, and additions have trailed the benchmark by about 2% in the three months following.
Reddit is taking over the seat of AvalonBay Communities (AVB). The apartment landlord is exiting the index after an all-stock merger it agreed to in May with Equity Residential (EQR).
That tie-up carries an enterprise value of ~$69 billion and is expected to close in the second half of 2026.
S&P Dow Jones Indices said the merged business, to be called Vivmark Residential, will retain AvalonBay’s spot in the S&P 500 once the deal closes.
Reddit posted $253 million in profit and still fell 31% this year
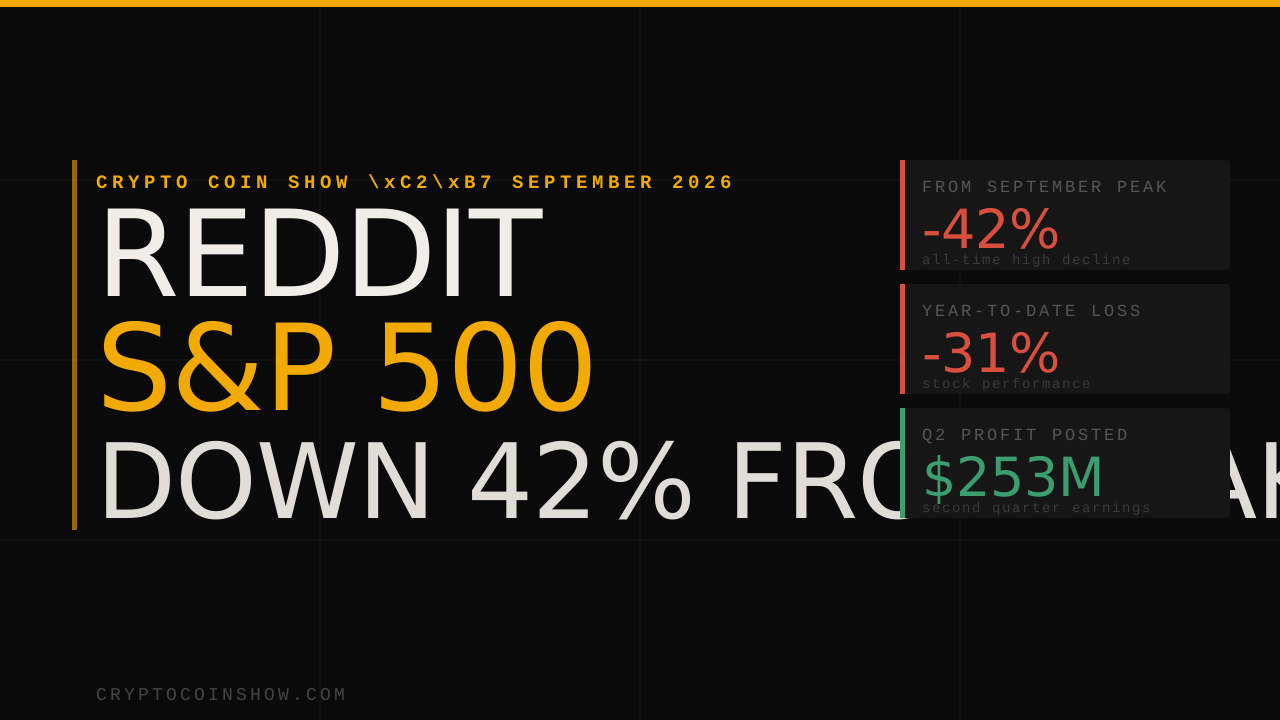
Reddit joins the benchmark after a tough year. The stock is down more than 31% in 2026 as of Thursday’s close and is more than 42% off the all-time high it hit in September 2025.
The company reported second-quarter net income of $253 million on revenue of $805 million, up 61% year over year and its eighth consecutive quarter of growth over 60%, Cryptopolitan reported.
The social media platform raised its revenue outlook, but late in the period, choppy search-engine referrals hit US user growth.
“Visibility into referral traffic remains low,” CEO Steven Huffman told analysts, adding that Google’s AI overviews have not yet replaced the traditional search links Reddit leans on.
Reddit joins an index that is increasingly dominated by only a few big names in technology.
Stocks linked to AI now represent ~45% of the market value of the S&P 500, making the benchmark more vulnerable to fluctuations of a handful of firms, Cryptopolitan previously reported.
Wall Street keeps setting records, yet a growing chorus of institutional voices now names artificial intelligence (AI) itself as the biggest threat facing global markets.
The S&P 500 sits at the center of that argument, and its concentration explains why.
S&P 500 Index (SPX) – All-Time Performance. Source: TradingView
Why Fund Managers Now Fear AI Most
A tail risk is a low-probability event with severe consequences, the kind fund managers watch even when markets look calm. AI just claimed the top spot on that list.
Bank of America’s July Global Fund Manager Survey found 45% of respondents naming an AI bubble as the biggest tail risk, up from 28% the previous month.
Wall Street’s New Top Fear: The AI Bubble Displaces Inflation in BofA’s Fund Manager Survey. Source: BofA via Hedge Fund Tips
That figure displaced second-wave inflation from its first-place position. The same survey identified long positions in global semiconductors as the world’s most crowded trade.
Analyst Mac10 sharpened the warning on August 8. He argued that forward earnings growth is accelerating at a record pace only because companies are pouring unprecedented cash into artificial intelligence.
S&P 500 forward earnings estimates are growing at the fastest rate in history, as record balance sheet capital gets thrown down the shit hole of AI, where it flows throw the P&L as a ONE TIME event.
His concern centers on accounting mechanics. That spending often appears as a one-time boost on profit statements rather than sustainable operating performance.
Institutional bodies echo those doubts. The Bank for International Settlements warned earlier this year that Big Tech’s spending spree risks becoming a prolonged investment bust. The numbers behind that alert are substantial. The five largest hyperscalers are expected to deploy more than $1 trillion across 2025 and 2026.
Household exposure raises the stakes further. Ordinary investors now hold more stocks relative to their wealth than in past cycles, so any sharp drop would hit harder than the dot-com crash.
What the S&P 500 Actually Reveals
The structural problem explains why the index matters. J.P. Morgan Global Research estimates that the top 20 stocks now account for roughly 50.8% of total market capitalization.
That concentration has no modern precedent. Half a century has passed since the index depended so heavily on so few companies. The practical implication is uncomfortable. Buying the market increasingly means buying the AI trade, regardless of how the remaining 480 companies perform.
Cumulative Weight of S&P 500 Companies. Source: Slickcharts
Capital commitments keep expanding regardless. Goldman Sachs estimates annualized AI-related spending could exceed $800 billion by the end of 2026.
Morgan Stanley projects even larger flows. Its research points toward nearly $3 trillion of AI infrastructure investment by 2028, with over 80% still ahead.
Summer has already delivered a stress test. The Nasdaq fell almost 10% from its June peak by late July before staging a near-9% rebound in early August to a new all-time high, according to TradingView data.
Momentum names showed particular fragility. Sandisk and Western Digital, up roughly 396% and 145% year-to-date, both displayed sell-the-news vulnerability during earnings season.
The bull case rests on delivered results, however. Goldman Sachs found 64% of reporting S&P 500 companies beat consensus earnings by at least a standard deviation.
BlackRock rejects the bubble framing outright. Today’s leaders generate real profits, maintain strong balance sheets, and largely fund investments from their own cash flow.
Extraordinary earnings are buying time for the AI trade. Whether returns eventually justify trillions in capital expenditure remains the question holding up the entire index.
The Situational Awareness Collapse: A Warning Shot for the AI Trade
If markets needed a case study of AI concentration risk, July delivered one. Situational Awareness, the hedge fund founded by former OpenAI researcher Leopold Aschenbrenner, grew to as much as $45 billion before steep losses on AI infrastructure stocks like SK Hynix forced it to sell its entire public portfolio to Ken Griffin’s Citadel.
The timing was brutal: on July 24, Aschenbrenner had sent investors a letter reporting a 439% net return for the first half of 2026 — even suggesting it was a good time to add funds.
One hedge fund turned a 225% winner into a 40% loss in a single month, and it may have marked the low.
A long/short momentum trade inside US tech returned 225% in the year to June, then shed nearly 40% in July as Situational Awareness, Leopold Aschenbrenner’s AI fund, imploded… pic.twitter.com/0EljZeuCbb
— Kurt S. Altrichter, CRPS® (@kurtsaltrichter) August 7, 2026
Six days later, Citadel absorbed a stake once estimated at $16 billion in one of the largest rushed equity transactions in Wall Street history. A cascade of margin calls shrank the fund’s assets from $45 billion to roughly $10 billion in a matter of weeks.
Yet the story did not end there. Just days after the near-collapse, Aschenbrenner returned to the market with a $400 million investment in a privately held company — bringing his combined commitment to that unnamed target to $500 million, alongside the fund’s retained private stakes.
The episode does not prove the AI trade is over, but it exposes how concentration, leverage, and thin liquidity can destroy a portfolio before a long-term thesis has time to play out — the same fragility now embedded, at index scale, in the S&P 500 itself.
Then cheap AI tax tools arrived. Goldman Sachs analyst Gabriela Borges cut her price target in June to $276, down from $519.
Intuit moved fast. It cut 17% of staff, roughly 3,000 jobs. It also lowered its TurboTax forecast.
The company is now worth about $88 billion, Forbes reported. A year earlier it was worth more than $219 billion.
Accenture (ACN) tells a similar story, down 45.21%. Clients are spending on AI instead of consultants.
New client orders slipped to $19.3 billion from $19.7 billion. Accenture cut its sales growth forecast to between 3% and 4%. The stock fell almost 18% in one day.
Cognizant (CTSH), Gartner (IT) and The Trade Desk (TTD) each lost 44% to 55%. All three sell work that AI can copy.
But the Two Biggest Losers Had Nothing to do with AI
Here is the twist. The two worst stocks fell for old-fashioned reasons.
AI Fear Wiped 40% Off 10 S&P 500 Stocks While the Index Rose 8%
CoStar Group (CSGP) is down 58.86%, the weakest in the index. Its problem is spending, not AI.
CoStar owns Homes.com, a property listings site. In January it said the site will not cover its own costs until 2029. Profit is not expected until 2030.
The core business is fine. Revenue jumped 23% to $897 million last quarter. Profit was just $3 million.
Investors lost patience. In February, hedge fund D.E. Shaw told CoStar to quit or shrink Homes.com. It said the move could unlock more than $10 billion. CoStar called the campaign “activism malpractice.”
Shareholders backed the board in June. Nasdaq had already dropped the stock from its Nasdaq-100 index in May.
Boston Scientific (BSX) is down 53.59%. It simply grew slower than promised.
In February it expected sales to grow 10% to 11%. By April it cut that to between 6.5% and 8%.
A rival explains why. Medtronic said its heart device sales rose 124% in the United States. It took “an additional 8 points of U.S. share.”
Then bad news piled up. Boston Scientific recalled its Accolade pacemakers. Regulators tied the fault to four deaths and 2,557 serious injuries. It also agreed to buy Penumbra for $14.5 billion.
Where the Money Went Instead
Chip and memory makers took it. Sandisk (SNDK) is up 505.17% this year. Dell Technologies (DELL) rose 247.55%. Micron Technology (MU) gained 222.68%.
Small investors piled in too, feeding the AI capex boom through chip funds. A narrow group of winners now drives the whole index, as data on AI stocks driving gains shows.
Everything else got punished for any slip. Expensive stocks fell hardest when forecasts came down, a danger flagged in recent earnings bubble warnings.
CoStar and Boston Scientific both report results this week. Those numbers will show whether investors were right or just impatient.
Tech companies are running hot, with Wall Street investors sustaining multi-trillion dollar valuations despite subdued earnings. Companies heavily invested in AI are particularly challenged on that front, thanks to heavy data center spending that isn’t yet — and may ever — result in sizable profits.
The gap between those companies’ valuations and their ability to actually make money continues to grow at a breakneck pace, terrifying analysts. The S&P is up a whopping nine percent so far this year, wrapping up its best quarter since 2020 at the end of last month, as Fortune reports.
But what comes up must come down. In a Tuesday note, Bank of America warned that “speculation is hitting extreme levels as high multiple stocks have gapped up demonstrably, an event that has historically preceded a valuation ‘snapback.’”
In other words, Wall Street could be in for a nasty reality check.
Meanwhile, experts warn that the US economy could be in an even worse shape than right before the Great Depression of the late 1920s. As the Telegraph‘s economics columnist Russ Mould pointed out, US stocks are currently priced on average 41 times their average earnings over the last decade, an indicator called the Shiller CAPE ratio. To put that number into perspective, the ratio was just 32.5 on Black Tuesday, the day of the worst financial disaster in modern history almost 100 years ago.
The fretting comes after some major turbulence. A major sell-off rocked the S&P 500 towards the end of June, wiping out hundreds of billions of dollars in market value. Even Musk’s SpaceX, which had gone public mere weeks earlier and is now top-heavy with AI spending itself, was caught up in the downturn, plummeting back down to its starting price of $150.
International markets have also seen massive swings, particularly in Asia, which could indicate troubling days ahead.
“This volatility is, in our view, evidence of excessive froth and calls into the question the sustainability of this rally,” Capital Economics analysts told Fortune.
Expect turbulence. For the time being, many investors are as optimistic as ever. Just this week, SpaceX received extremely bullish ratings from Morgan Stanley and Goldman Sachs, with price targets of $300 — twice the space company’s current share price — and $205, respectively.
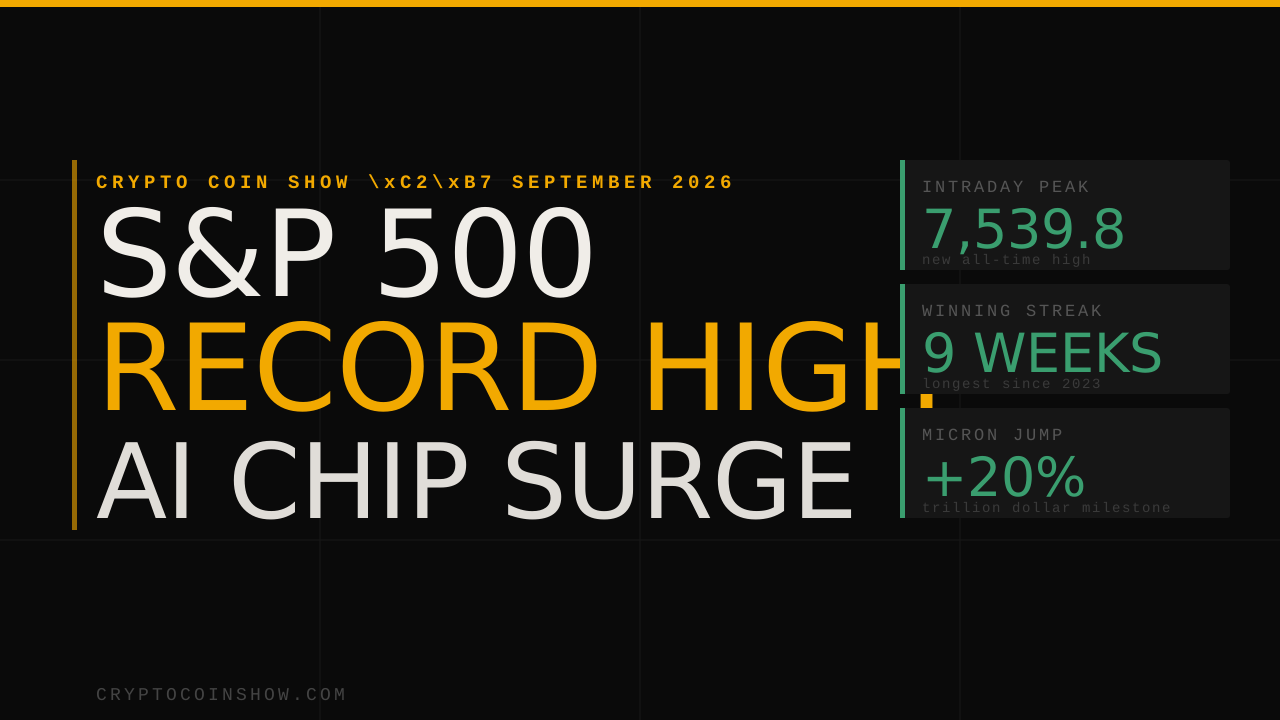
The S&P 500 hit another record on Tuesday, reaching 7,539.8 during the session and putting the index on pace for a nine-week winning run, its first since 2023. Tech did most of the heavy lifting because, of course, Wall Street went right back to worshiping chips after the long weekend.
The Nasdaq Composite also reached a new intraday record, while the Dow Jones Industrial Average went the other way. The S&P 500 was up 0.5%, the Nasdaq added 0.9%, and the Dow fell 216 points, or 0.4%. U.S. markets were shut on Monday for Memorial Day.
The Iran story stayed on traders’ screens. President Donald Trump said Monday that talks with Iran to end the war were “proceeding nicely.” Donald also said the U.S. could attack if the talks fall apart. Early Tuesday, the U.S. said it carried out “self-defense” strikes in southern Iran.
U.S. Central Command spokesman Tim Hawkins said the targets included missile launch sites and Iranian boats that were trying to place mines. Tim said the U.S. used “restraint during the ongoing ceasefire” between both countries.
The S&P 500 rose 0.9% last week, giving it the longest weekly winning streak since late 2023. The Dow added 2.1%, its third weekly gain in four weeks. The Nasdaq gained 0.5%, giving it seven winning weeks out of the last eight.
Tech stocks push the S&P 500 higher as memory chip names rip through the market
Micron Technology (MU) jumped 20% and crossed $1 trillion in market value after analysts turned more bullish on the stock.
UBS said Micron could rise more than 100% from here because of its long-term deals. The stock had a rough start last week when memory chip names sold off, but it still ended that week with a large gain.
“We believe the market will start to put a more ‘normal’ multiple on the stock and MU will continue to re-rate higher as more details emerge about the structural changes AI has driven to the entire memory complex,” said UBS.
Other memory stocks followed the same trade. Seagate Technology (STX) rose 5%, while Western Digital (WDC) climbed 8%. The Roundhill Memory ETF (DRAM) gained 15% and reached a new record.
Nvidia (NVDA) was also in the mix after Rothschild & Co Redburn raised its price target to $300 from $280. That target points to almost 40% upside from Friday’s close. Analyst Timm Schulze-Melander called Nvidia’s quarter “near-immaculate” in a Tuesday note.
“Datacentre revenues accelerated from an ARR of $250bn and 75% YoY growth (4Q) to an ARR of $300bn and 92% growth YoY (1Q),” Timm wrote. “Sales to hyperscale customers grew an impressive 115% YoY as capex spend shifts towards silicon from land and buildings in 2025.”
Timm said rivals would need to grow faster than Nvidia for a long time if they want to prove they are taking share. He also said Nvidia has earned investor trust through its earnings record. The chipmaker trades at just over 21 times forward earnings.
Meanwhile, Intel (who had missed the first big run of the AI rally) saw its stock rallying more than sixfold and is trading close to record highs last week. As the market reopened today, the U.S. chipmaker is trying to pull off a major comeback after getting a large investment from the U.S. government last summer. Qualcomm, Advanced Micro Devices, and Marvell Technology have also all made new all-time highs too.
After the U.S. strikes, West Texas Intermediate crude futures for July had pulled back from the day’s lows and traded 3% lower at $93 per barrel. Brent crude traded 3% higher at $99 per barrel.
Cheaper oil helped stocks last week. U.S. crude had its worst week since April 17.
Oil is still far above where it stood earlier this year, and price pressure has not gone away. That has cooled bets on easier Federal Reserve policy. Traders now see about a 13% chance of a July rate hike, up from 0.9% one month ago, based on the CME FedWatch tool.
Don’t just read crypto news. Understand it. Subscribe to our newsletter. It’s free.
Rising short positions across American stocks are starting to shape a different conversation around Bitcoin’s role in global markets.
According to CryptoQuant contributor XWIN Japan, a market increasingly built on hedging, concentrated AI trades, and heavy leverage could push more institutional capital toward BTC if liquidity conditions improve later in the year.
Wall Street Hedging and Bitcoin’s Changing Behavior
XWIN Japan argued in a market update published earlier today that the rise in US equity short interest does not necessarily point to outright bearish sentiment. Instead, hedge funds appear to be stacking defensive positions while keeping long exposure intact.
Per the crypto research institution, hedge fund gross leverage has climbed to around 293%, alongside record S&P 500 short exposure and elevated Days-to-Cover metrics.
Much of that pressure appears tied to heavy concentration in a handful of AI-related megacap stocks, while weaker sectors and smaller companies have been attracting shorter bets.
That backdrop matters for Bitcoin because it has historically traded closely with equities during market panics. For example, during the COVID-19 selloff in 2020, BTC fell alongside stocks rather than acting as a safe haven.
But according to XWIN, that relationship started to shift in 2025. While the S&P 500 has traded in a relatively tight range, BTC has shown larger swings tied to ETF demand, leverage activity, and crypto-native liquidity flows.
It concluded that going forward, Bitcoin may become a hybrid asset, still exposed to macro liquidity conditions, but more capable of moving on its own terms.
“If future conditions include Fed easing, weaker dollar conditions, and renewed ETF inflows,” XWIN wrote, “Bitcoin could become a secondary liquidity destination rather than simply a correlated tech-like asset.”
The OG crypto asset had fallen over the weekend to around $74,000 but rebounded above $77,000 as reports suggested developments toward a potential ceasefire agreement between the USA and Iran.
But as of the time of writing, data on CoinGecko showed it had dropped back below $77,000 by a few hundred dollars, leaving it down almost 30% over the past year.
On-Chain Activity Cools While Traders Watch Key Levels
Meanwhile, the current consolidation phase has seen Bitcoin’s network activity drop off sharply, with crypto analyst Ali Martinez revealing that active addresses fell nearly 40% in two weeks, from 821,000 to 494,000.
According to him, weaker activity during sideways price action often indicates short-term traders leaving the market, while longer-term holders retain supply.
He added that derivatives traders are increasingly positioned for a breakout, with funding rates recently touching 0.4%, their highest level in more than two months. On-chain data also showed large holders redistributing more than 18,000 BTC during the consolidation period.
Martinez identified resistance around $78,000 and support near $76,000, with a move above resistance, in his opinion, possibly opening the door toward $85,000, while losing support may send Bitcoin toward the mid-$60,000 range.
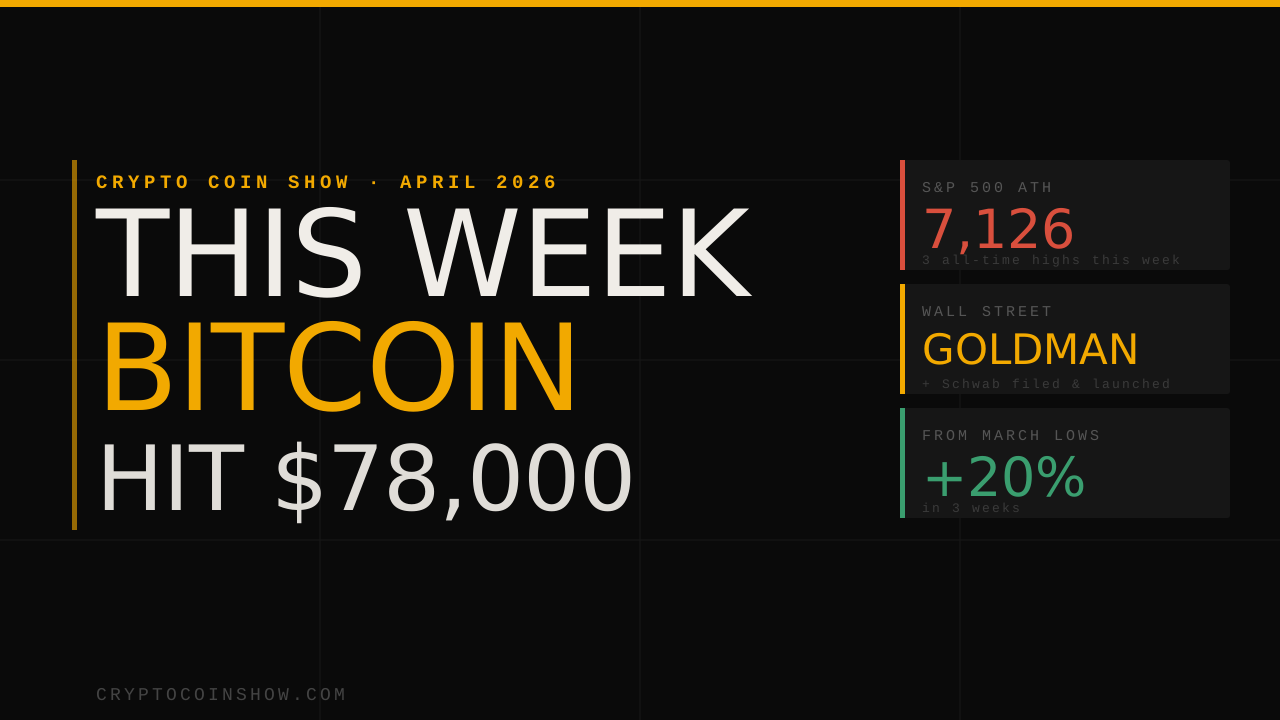
The S&P 500 and Bitcoin printed new local highs on the same week. Most people will see that and call it a good week. I want you to understand why it’s more than that.
For two years the story was simple: Bitcoin trades like a risk asset. When equities bleed, crypto follows. A lot of portfolios learned that the hard way in 2022 when BTC dropped 65% alongside a 20% equity selloff. This week was the opposite. Synchronized strength — both markets up, same window, no lag.
The buyers who showed up in March during Extreme Fear are sitting on 20% in three weeks. ETF inflows haven’t dried up. Strategy has added over 500,000 BTC to its balance sheet since 2020 and is still buying. Japan has passed financial asset recognition legislation. The US Treasury now briefs crypto firms the same way they brief Goldman Sachs. These aren’t narratives. They’re structural facts building on top of each other.
$78,000 is not the top. It’s the floor of the next range. $80K is the number the whole market is watching, and Bitcoin 2026 in Las Vegas starts in ten days. Pay attention.
$78KBTC new local high
7,126S&P 500 all-time high
+20%BTC from March lows
10Days to Bitcoin 2026 LV
This Week’s Featured Video
HiGlobeFeatured Interview
Zero fees. Instant dollars. 6 countries. 1.4 billion people.
The global south moves trillions of dollars a year in remittances. Most of it still costs 5 to 6% and takes days to arrive. HiGlobe is built to fix that — operating across 6 countries with zero-fee, instant dollar transfers that reach recipients in under 60 seconds. India is the latest and largest market to come online, adding 1.4 billion people to a platform that already serves over 3 million users. This isn’t a crypto experiment. It’s a financial utility that works right now, in places where the cost of sending money has been a tax on working people for decades.
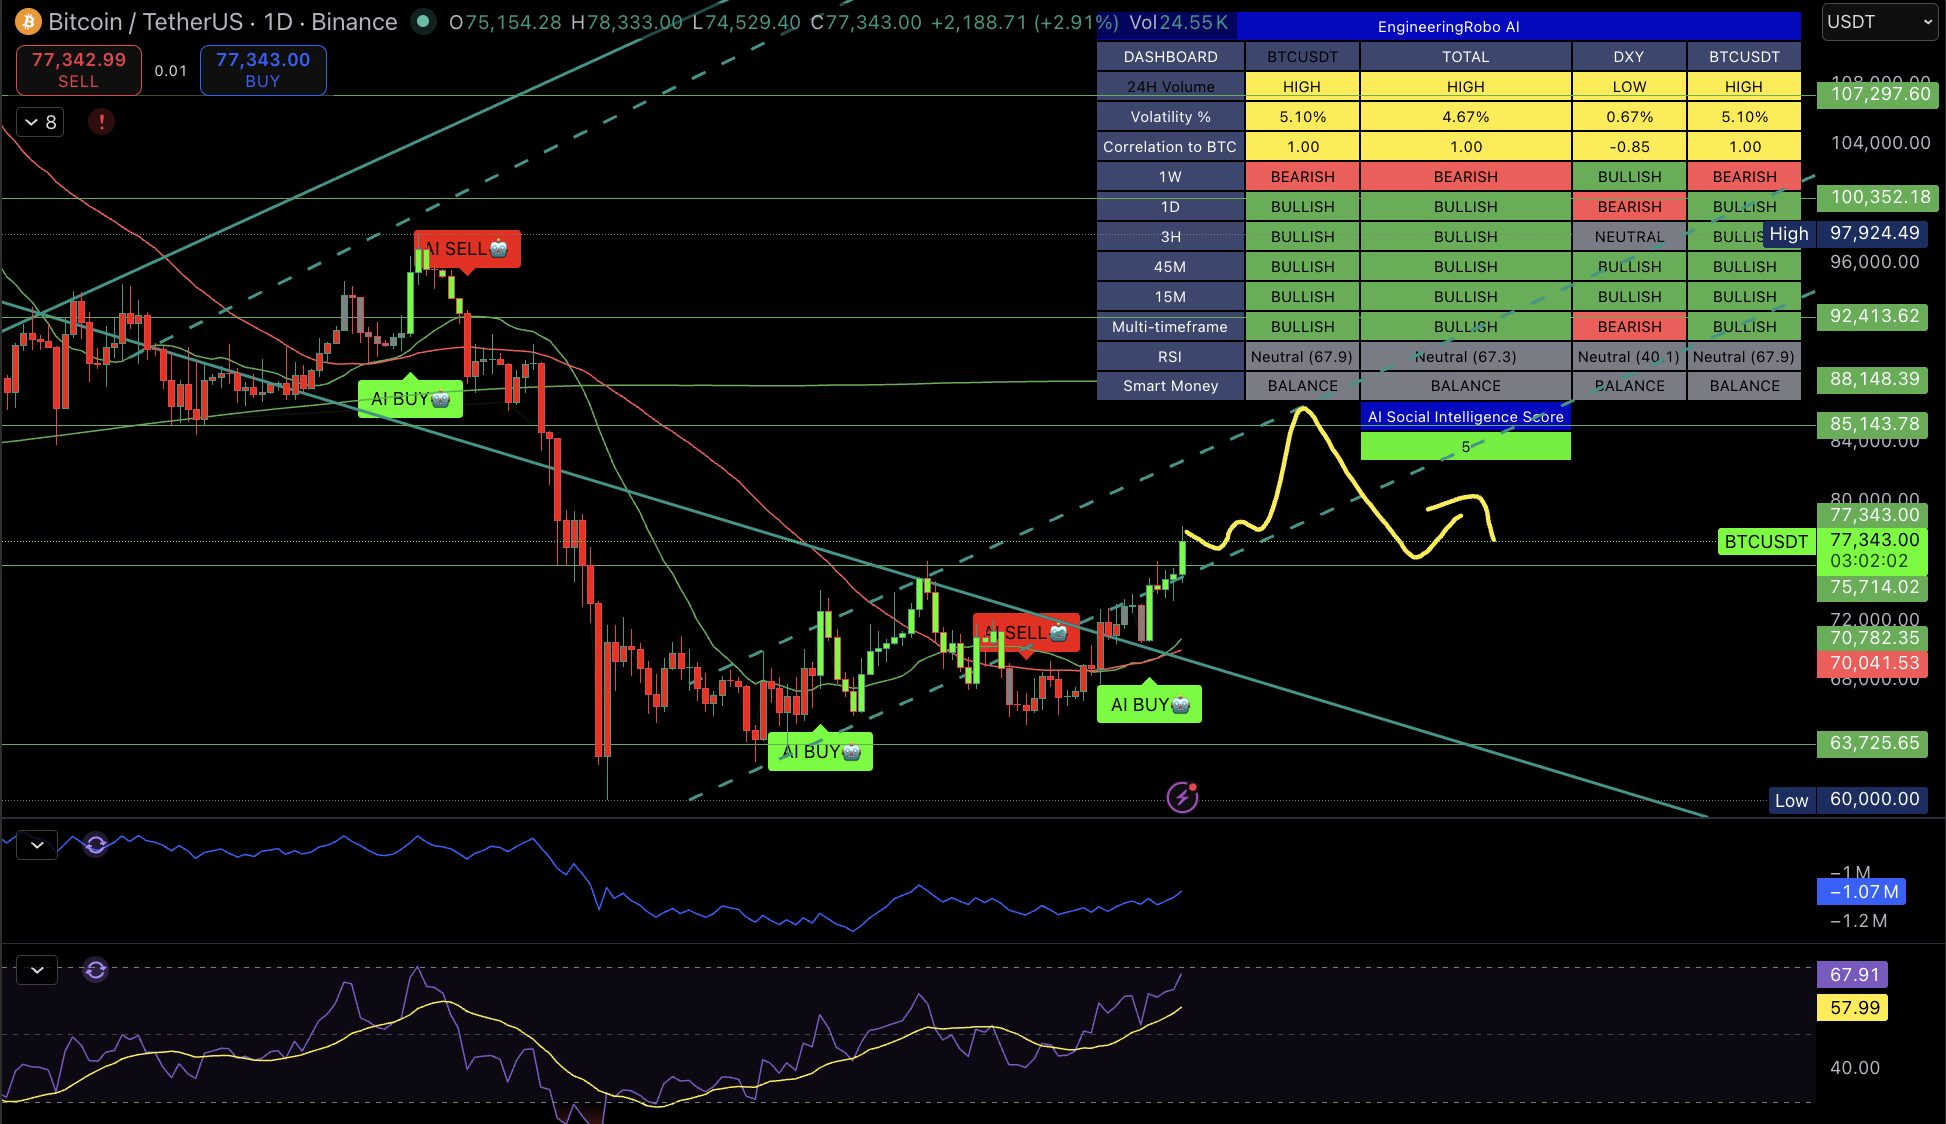
Bitcoin has broken $78,000 and is holding above it. Today’s high touched $78,333 before pulling back slightly, with price now consolidating above $77,000.
The daily is bullish across every shorter timeframe. RSI sits at 67.9, elevated but not yet overextended. On the weekly chart, MACD has flipped bullish for the first time since September 2025. That is the higher timeframe signal that matters most this week. One caveat: the weekly candle is still reading bearish on the dashboard. All shorter timeframes are bullish. That split tells you the daily trend is recovering while the weekly has not yet confirmed. A strong weekly close fixes that.
My bias: BULLISH, accelerating. Bitcoin is testing a descending trendline for the second time this year. A confirmed daily close above $78,500 with above-average volume breaks that trendline and opens the path to $80,000 and $82,000 before Bitcoin 2026 Las Vegas. If we see a rejection back below $76,000, I will reassess. The structure does not suggest that is the likely outcome.
What I’m watching: That daily close above $78,500. Volume is the confirmation signal. Without it, the move is a wick until proven otherwise. Let the market do the work. Don’t fight the structure.
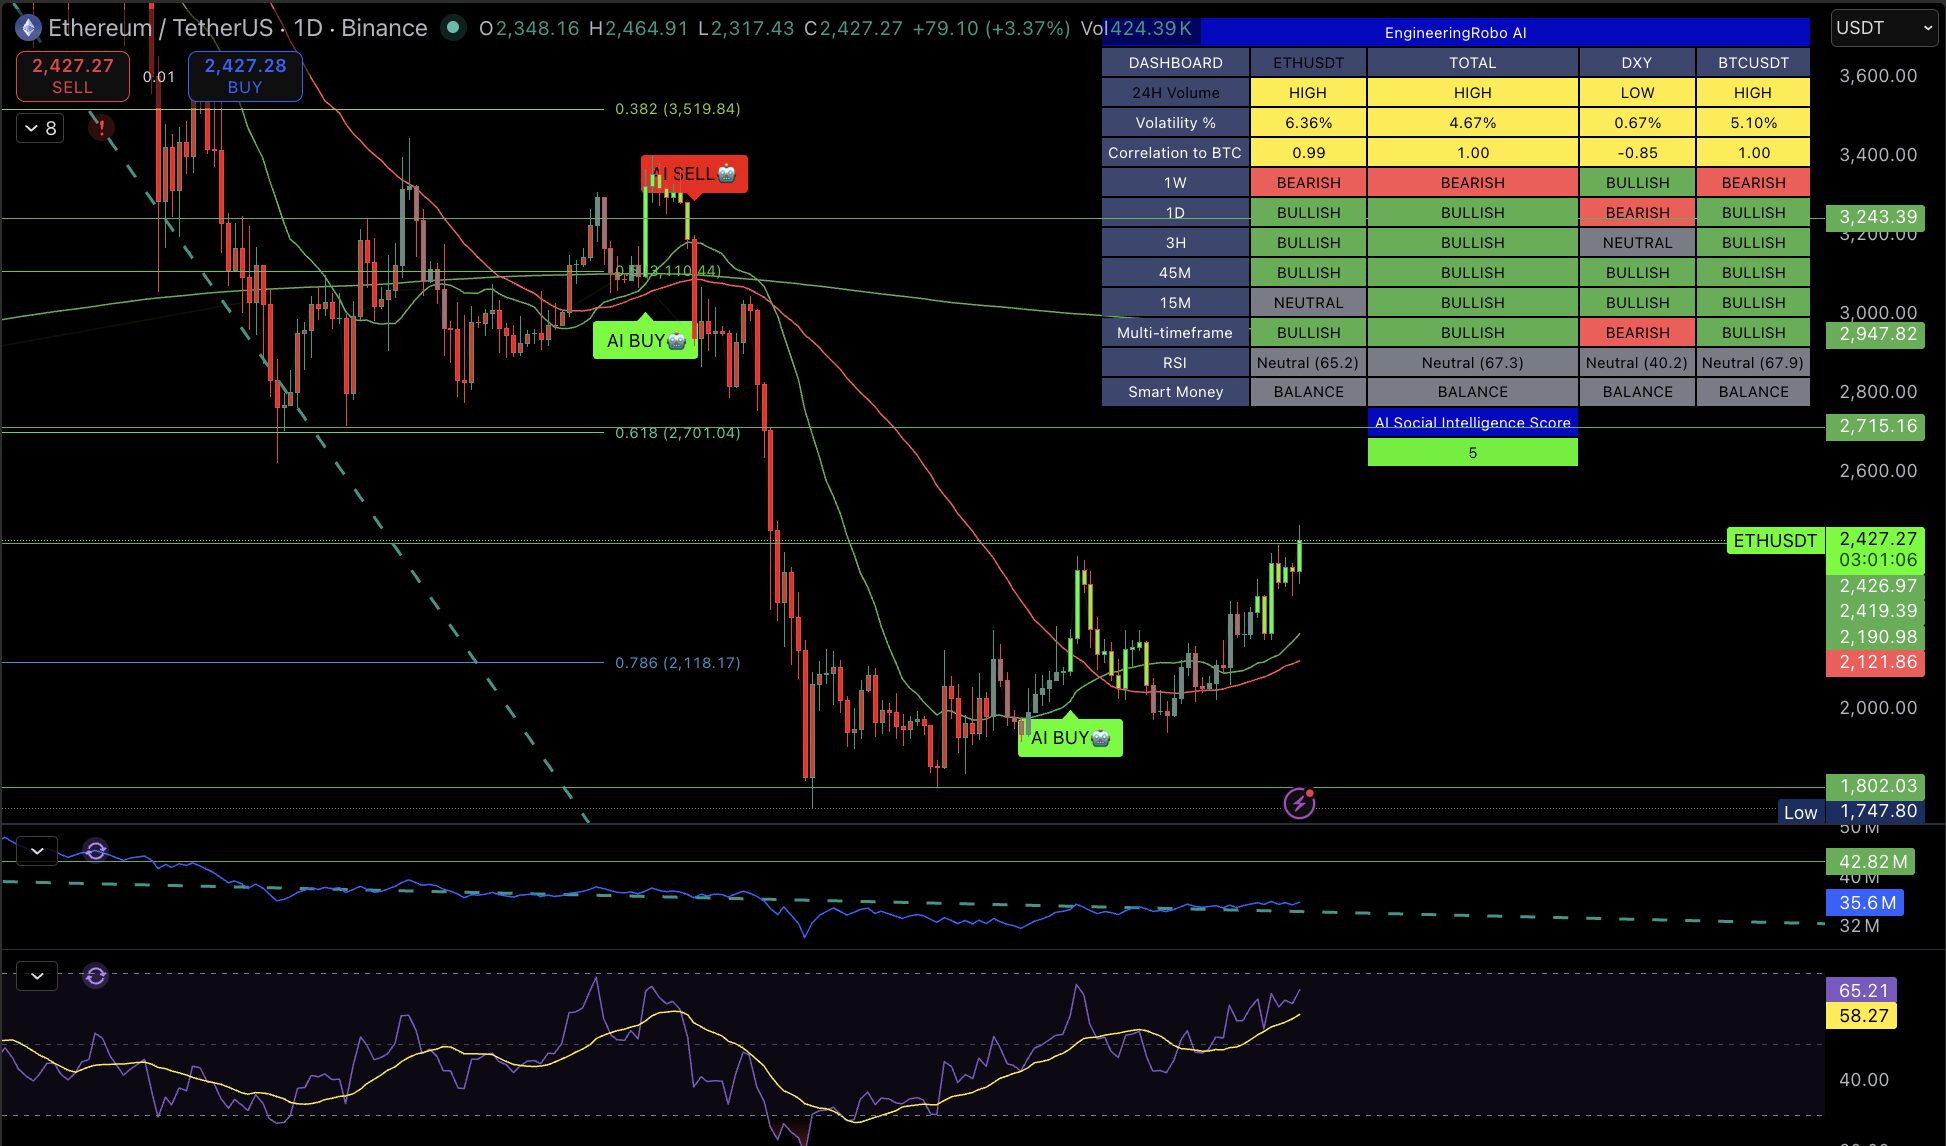
ETH is trading at $2,427, up 3.37% on the day. Bitcoin is leading this move and ETH is following, which is the healthy version of this setup.
RSI sits at 65.2, neutral with room to expand. Smart Money is balanced. No distribution signals on the 4H. Like Bitcoin, the weekly is still reading bearish while all shorter timeframes are bullish. The key Fibonacci level to watch is the 0.618 retracement at $2,701. That is the next meaningful resistance. A clean daily close above it opens the path toward the 0.382 at $3,519.
My bias: BULLISH, patient setup. ETH needs that close above $2,701 to become the louder story this week. Until then, Bitcoin is the focus and ETH is the opportunity building quietly underneath.
What I’m watching: ETH beginning to outperform BTC on a percentage basis. That is the signal altcoin season is approaching. Historically when Bitcoin leads, alts follow with higher beta. If BMNR continues accumulation toward their stated 5% ETH supply target, the structural demand side of this market has a very different floor than most people are pricing in.
The Original DePIN Protocol, Now with Its Own Layer One. 10M+ nodes. A decade of proof-of-work. XYO’s Layer One is built for high-volume data, AI infrastructure, and real-world asset tokenization, with dual tokens $XYO and $XL1.
The biggest stories this week, filtered for signal. CCS coverage linked where relevant.
⭐⭐⭐
Bitcoin broke $78,000 as the S&P 500 closed at a new all-time high of 7,126 on the same day. Three consecutive all-time highs on the S&P this week (7,022 → 7,050 → 7,126) alongside Bitcoin’s move is the synchronized strength story of the year. This is what institutional co-movement looks like.
⭐⭐⭐
Charles Schwab announces spot Bitcoin and Ethereum trading for retail clients, launching in the coming weeks. Schwab manages $12 trillion in client assets. This is the largest traditional brokerage to offer direct crypto trading and puts BTC and ETH on the same screen as stocks for millions of everyday investors.
⭐⭐⭐
Goldman Sachs files for a Bitcoin Premium Income ETF. The $3.5 trillion bank is moving beyond its existing Bitcoin ETF exposure into yield-generating BTC products. Institutional product development is accelerating.
Kraken confidentially files for a US IPO. The second-largest US crypto exchange going public is a legitimacy milestone for the industry and a signal of how much the regulatory environment has shifted in 12 months.
SEC officially ends the Pattern Day Trader rule, eliminating the $25,000 minimum for day trading. A decades-old barrier to retail participation in active markets is gone. This expands the addressable market for crypto and equities trading platforms simultaneously.
Morgan Stanley says tokenization is the next major step for its $2 trillion business. When the world’s largest wealth manager says this publicly, it’s not a trend piece. It’s a product roadmap announcement.
X’s cashtag trading pilot for stocks and crypto generated an estimated $1 billion in volume in its first week. The social-to-trade pipeline is real and moving faster than most people expected.
Iran reopens the Strait of Hormuz. Bitcoin crossed $77K within hours of the announcement as oil prices crashed 13%, traders rotating out of commodity hedges.
Tesla adds $100 billion in market cap in a single day. Up 7%, reflecting broader risk-on sentiment across the week.
SEC issues guidance that certain crypto interfaces supporting self-custodial wallet transactions may not require broker-dealer registration. A meaningful step toward clearer regulatory boundaries for DeFi and wallet infrastructure.
Bitcoin 2026 · April 27–29 · The Venetian Resort, Las Vegas · Ten days away.
Not because it’s speculative. Because it’s been institutionalized.
This isn’t the asset that bleeds when the S&P sneezes anymore. This week proved it. When both markets print new local highs in the same window, that’s capital allocation behaving normally around a mature asset class. The speculation phase built the infrastructure. The infrastructure attracted the institutions. The institutions are now here.
$80K is the next number. I’ll be on the floor at The Venetian in ten days. If you’re going to be there, hit reply. I’d like to know.
Ashton Addison · CEO, Crypto Coin Show
Get CCS Insider every week
Markets, interviews, and signal — free in your inbox.
The US stock market fell on Friday as rate hike expectations crossed the 50% threshold for the first time, bond yields hit new highs, and the Iran war showed no signs of de-escalation. The S&P 500 dropped 0.92%, heading for its fifth straight weekly decline.
Three forces drove the selling on Friday, all connected to the same root cause. Oil (Brent Crude) above $100 is feeding into inflation, forcing the Fed’s hand and crushing bonds and equities simultaneously.
1. Rate Hike Odds Cross 51% as Fed Cuts Vanish Until December 2027
The CME FedWatch Tool now shows no expected rate cuts until December 2027 and a 51% probability of a rate hike by March 2027. Surging oil prices are feeding into inflation expectations, forcing the Fed into a corner where easing becomes impossible. Higher rates compress earnings multiples and make risk assets less attractive.
BREAKING: The US Federal Reserve is now no longer expected to cut interest rates until December 2027.
There is now a 51% chance of an interest rate HIKE by March 2027.
The 10-year Treasury yield climbed to 4.48%, its highest since the conflict began.
We believe this weekend is a crucial pivot point in the Iran War:
As the bond market continues to get crushed, the 10Y Note Yield just hit a new high of 4.48%. For the first time since the Iran War began, the bond market is nearing or already in “crisis” territory.
When yields rise this sharply, it pressures growth stock valuations and competes with equities for capital. The US Dollar Index (DXY) is gaining strength, squeezing multinational earnings as foreign revenue translates into fewer dollars back home.
With over 40% of S&P 500 revenue coming from overseas, the stronger dollar is pressuring the broader index.
Meanwhile, capital has rotated into gold above $4,400 and silver, reflecting a flight into hard stores of value.
3. Iran Rejects Direct Talks, Brent Holds Above $104
Iranian Foreign Minister Abbas Araghchi said exchanges through mediators do not constitute “negotiations with the United States.” Brent crude held above $104, keeping the geopolitical risk premium intact.
Oil above $100 functions as a tax on consumers and businesses, raising input costs and squeezing discretionary spending.
What Is Happening to Major US Indexes?
At press time, all three major indexes are in the red.
S&P 500: down 59.53 points (−0.92%) at 6,417 (stronger dollar hitting several players)
Dow Jones Industrial Average: down 467.58 points (−1.02%) at 45,492
Nasdaq Composite: down 279.90 points (−1.31%) at 21,128
Market breadth is overwhelmingly negative, with 3,746 stocks declining versus 1,593 advancing.
The S&P 500 continues its decline after breaking down from a bear flag pattern. The breakdown started on March 18 and has already delivered a 3.8% correction. The measured move target sits at 6,347.
If the index fails to reclaim 6,435, the factors above could push it toward 6,347 and even 6,213.
Which Sectors Are Holding Up?
Energy led with a 1.51% gain as Brent stayed above $104. Exxon Mobil (XOM) gained 3.17% at press time, and Chevron (CVX) rose 1.98% as elevated oil prices directly increased producer revenue.
Basic Materials added 1.17% on rotation into commodities. With gold above $4,400 and silver strengthening, mining stocks attracted capital as an inflation and geopolitical hedge.
Utilities gained 1.08% as defensive positioning continued. Risk aversion is overriding the traditional rate sensitivity of the sector, making yield-paying defensives attractive as a parking spot for nervous capital.
Which Sectors Are Falling?
Consumer Cyclical led losses at -1.83%. Oil above $100 acts as a direct tax on spending power. Amazon (AMZN) fell 3.38%, and Tesla (TSLA) dropped 1.83%.
Communication Services lost 1.41% as Meta (META) fell 3.65%. Ad-dependent businesses suffer early in slowdowns because advertising budgets are among the first expenses companies cut. Financials declined 1.30 as the speed of the yield surge, combined with recession fears, creates credit risk concerns that outweigh the margin benefit.
Technology lost 1.07% as the Nasdaq entered correction territory and higher bond yields crushed growth stock valuations.
Major Stock News Investors Are Watching
Unity Software (U) surged 10% after preliminary Q1 revenue of $505 million to $508 million crushed guidance. The company also plans to sell its China division for over $1 billion, streamlining around its AI-powered Vector advertising platform.
Unity Software sharply higher premarket after raising its Q1 revenue guidance above consensus. The company sunsetting its ironSource Ads Network. $U 19.42, +2.29, +13.4% pic.twitter.com/sbVLYl9ka3
CrowdStrike (CRWD) fell 7% after FY27 guidance landed below expectations while AI-powered rivals intensified competitive pressure in cybersecurity.
$CRWD -7%, $PANW -7.2%, $NET -3.75%, $ZS -7.6%, $OKTA -6.7% … [Cybersecurity stocks including CrowdStrike, Palo Alto Networks, Cloudflare, Zscaler, and Okta are falling after Anthropic accidentally leaked details of its new powerful AI model with strong cyber capabilities.]… pic.twitter.com/IZH2vWuL0l
Iran’s counter-proposal to President Trump’s 15-point peace plan is expected today. If the proposal shows willingness to negotiate, oil could retreat and pull equities higher by Monday’s open.
TRUMP AND TOP WHITE HOUSE OFFICIALS HAVE BEEN TOLD THAT IRAN’S COUNTER-PROPOSAL WOULD LIKELY ARRIVE FRIDAY VIA INTERLOCUTORS -SOURCE
If it amounts to another rejection, yields could push above 4.50% next week, and the S&P 500’s 6,347 target comes firmly into play. The weekend could be the most consequential 48 hours for markets since the conflict began.
Roxom Launches Bitcoin-Denominated Futures on Global Market Benchmarks
October 20, 2025
Roxom, a next-generation capital markets exchange, announced the launch of Bitcoin-denominated perpetual futures, allowing traders worldwide to access 24/7 benchmark assets such as the S&P 500 and Gold, directly in Bitcoin.
For decades, global markets have been priced in fiat currencies. Roxom’s new Bitcoin benchmarks introduce a neutral and transparent reference standard, marking a historic shift toward a financial system where Bitcoin becomes the unit of account and strengthening its financial role.
“For decades, markets have been priced in currencies shaped by monetary policy and politics. By introducing Bitcoin-denominated benchmarks, we’re creating a new reference standard that is transparent, global and that changes our perspective on traditional markets. This launch is the foundation for a new financial era.” — Borja Martel Seward, Co-founder & CEO of Roxom
From this day forward, investors will be able to access new trading pairs like S&P500/BTC or GOLD/BTC, combinations that have never existed before.
Roxom’s launch marks the next phase of a broader industry shift: the institutionalization of Bitcoin as a reference unit for global markets, rather than solely a store of value. It represents the first step forward in building a full-scale Bitcoin financial architecture, where trust and performance are measured in the world’s hardest money.
“Pricing the world in Bitcoin is the next natural step for the entire industry. In the same way that emerging market countries like Argentina have done so with the USD, the world will soon follow the same path with Bitcoin.” — Borja Martel Seward
The biggest crypto exchange platform, Coinbase, was at a pivotal crossroads during Monday’s trading session just after Bitcoin sailed to record price heights over the weekend.
According to data from sources, Coinbase’s stock ended up 1.8% at $394.01 per share on the day. At the same time, shares hit a peak of $398.50.
At today’s closing price, Coinbase has a market cap of nearly $100.36 billion, the highest market cap the crypto exchange has recorded in history.
Bitwise CIO anticipates Coinbase becoming a trillion-dollar company at some point
Coinbase shares have popped 50% in the past month alone in conjunction with the highly successful initial public offering (IPO) of Circle Internet Group and favorable regulatory changes in the United States.
The crypto exchange also encountered a significant achievement on May 19 after adding it to the S&P 500 index. This milestone distinguishes Coinbase as the first cryptocurrency-focused company to gain entry into this benchmark, highlighting its growing legitimacy within the financial sector.
This month, Coinbase experienced a steady increase in revenue that did not come from transactions in the last year, totaling $772 million in the first three months, according to analysis from sources. Last week, the company brought on a user named AlexOnchain to help increase its social media presence.
Bitwise CIO Matt Hougan had previously forecasted Coinbase’s significant milestone. Based on his anticipation, the firm could eventually become a trillion-dollar company.
On May 13, in an X Post, Hougan advised investors to choose a company currently worth less than $100 billion but has the best chance of reaching a value of over $1 trillion. He gave Coinbase as an example, which is valued at $61 billion.
Coinbase’s stock rebounds amid growing adoption of cryptocurrencies
On June 26, Coinbase’s shares had also experienced a surge, closing at a record high in a rally that increased the embrace of cryptocurrencies on Wall Street and Washington.
This came after the stock of the crypto exchange operator jumped 5.5% to $375.07. That surpasses the previous peak of $357.39 in November 2021, only a few months after the company became public with a direct listing.
Notably, Coinbase shares have soared more than 1,000% from a record low in late 2022, when the failure of FTX had cast further doubt on the digital asset’s future.
The stock’s rebound came as cryptocurrency prices recovered, and the industry itself secured powerful new allies, including President Trump, a strong crypto supporter who has embraced crypto stances in the US.
Another important milestone that contributed to the crypto exchange’s share surge was after the US Senate approved legislation for stablecoins pegged to the dollar, which are considered a promising payment method.
Benchmark analyst Mark Palmer highlighted the significance of stablecoins in the company’s operations. According to him, revenues generated from stablecoins will probably enable the company to reduce its dependence on trading revenue, which is under pressure from competition.
Following trade analysis, Coinbase’s main source of revenue has emerged from stablecoins. Therefore, with these new regulations, the crypto exchange will achieve financial stability and continuous success.
Republican House leaders are preparing to pass a stablecoin regulatory bill this week, aiming to send Congress’s first major piece of digital asset legislation to the president’s desk. The vote marks the beginning of what supporters are calling “Crypto Week” — a series of decisions that could reshape the crypto landscape in the US.
The proposed legislation, backed by industry leaders, is expected to bolster the adoption of dollar-based stablecoins. If passed, it would represent a significant win for crypto proponents, who collectively invested hundreds of millions of dollars during the last election cycle to help install lawmakers favorable to digital asset innovation, according to Federal Election Commission data.
“The golden age of digital assets is here,” said Rep. Bryan Steil (R-WI), a key industry ally and chair of the House crypto subcommittee.
President Donald Trump, now prioritizing digital asset regulation in his second term, has vowed to make the United States the “crypto capital” of the world.
His family’s involvement in crypto ventures — which has reportedly earned them hundreds of millions of dollars — has drawn criticism from Democrats, some of whom have pushed, unsuccessfully, to include prohibitions targeting Trump-affiliated crypto businesses in the legislation.
The House is also set to vote this week on two additional industry-supported bills: one to establish comprehensive market structure rules for cryptocurrencies, and another to block the Federal Reserve from launching a digital currency.
Your crypto news deserves attention – KEY Difference Wire puts you on 250+ top sites