Bitcoin’s short-term market structure is giving traders two very different stories at once: demand is appearing on dips, but resistance near the mid-$60,000s is still capping the recovery.
TL;DR
UnitedSignals says BTCUSD could rise as demand begins to exceed supply on the chart.
DomicChaina takes a more cautious view, saying the rebound still looks like a resistance retest below the $64,000–$65,000 area.
That Martini Guy argues Bitcoin reclaiming $63,500 makes it harder to stay aggressively bearish.
The split leaves traders watching whether BTC can turn buyer demand into a confirmed break above resistance.
Buyers Are Showing Up, But The Ceiling Remains
TradingView analyst UnitedSignals described Bitcoin as a “market of buyers,” arguing that BTCUSD could rise as demand begins to exceed supply on the chart. The idea is simple: if buyers are absorbing supply at current levels, Bitcoin may have room to push higher.
The analysis came with a disclosure that the author is part of Trade Nation’s influencer program and receives a monthly fee for using its TradingView charts. That does not invalidate the chart view, but it is useful context when weighing the source.
Other analysts are less ready to call a reversal. DomicChaina noted that BTCUSDT was recovering around $63,500 but still trading below an EMA cluster near $64,050–$64,970. In that view, the bounce has strength, but it has not yet reclaimed the control zone needed to confirm a stronger trend shift.
$63,500 Support Versus $65,000 Resistance
The key battlefield is narrow but important. On X, That Martini Guy pointed to Bitcoin reclaiming the $63,500 support zone after putting in a higher low around $62,400. He argued that the market had every excuse to break lower, yet so far it has not.
That gives bulls a clear level to defend. If BTC holds $63,500, the recovery case remains alive. But DomicChaina’s resistance map suggests the next challenge sits around $64,000–$65,000, where sellers may return if momentum fades.
This is why the current setup is tricky. A market can show buyer demand and still fail at resistance. The difference between accumulation and a dead-cat bounce often comes down to whether price can reclaim the next supply zone, not simply whether it bounces from the lows.
Confirmation Matters More Than Prediction
The split among analysts reflects the state of Bitcoin itself. Bulls can point to higher lows, reclaimed support, and demand on dips. Bears can point to overhead resistance, weak trend confirmation, and the risk that the rebound is only a retest.
For traders, the cleaner approach may be to let the chart decide. A sustained move through $65,000 would strengthen the buyer-demand argument and bring the $67,000 area back into focus. A rejection from that zone would keep Bitcoin trapped in a fragile recovery structure.
Until then, Bitcoin is not giving the market a clean answer. It is giving traders a range, a support level, and a ceiling that still needs to break.
This article was written by the News Desk and edited by Samuel Rae.
This article is based on technical analysis shared on TradingView by UnitedSignals, available at at the source
In times when investors are pulling funds out of the spot exchange-traded funds tracking ETH and especially BTC, their behavior toward XRP, HYPE, and SOL has been entirely contrasting.
The ETFs following the three altcoins’ performances continue to see more net inflows even as the market stagnates and uncertainty builds.
XRP, SOL, HYPE ETFs Keep Gaining Capital
CryptoPotato has repeatedly reported on the Ripple ETFs’ impressive performance over the past several weeks, in which most assets, including XRP, recorded fresh losses and dipped to multi-year lows. However, investors using the Wall Street-trading financial vehicles have remained active, with net inflows dominating for months. In fact, there have been only two weeks in the red since mid-March.
The last one, which had only four trading days, also ended in the green. The ETFs attracted $2.82 million on Monday, $5.30 million on Tuesday, and $2.55 million on Thursday. Since Wednesday was a $0.00 day, according to SoSoValue data, that means that the week ended with net inflows of $10.66 million. The cumulative net inflows have tapped a new all-time high of $1.45 billion.
The Solana ETFs also attracted over $7 million in net inflows in the past week, following a red one with $2.58 million in net outflows. HYPE and its ETFs continue to be the current market superstar. The funds saw their third-best week to date, with almost $28 million entering. Moreover, the HYPE ETFs have been on a six-week streak of net inflows since their inception in mid-May.
Their performance has been particularly promising since they have attracted nearly $185 million in net inflows in six weeks. The same six weeks have been highly emotional and full of FUD for the entire crypto market, especially June’s start when most assets tumbled to multi-year lows.
Net Inflows Spot HYPE ETFs. Source: SoSoValue
BTC, ETH ETFs Deep in Red
And while the aforementioned altcoins continue to enjoy fresh ETF capital, the same cannot be said for the funds tracking the two largest cryptocurrencies by market cap. As reported earlier, the spot BTC ETFs bled more than $226 million in the past week, and are down by roughly $5 billion in the same six weeks in which the HYPE and XRP ETFs have been only in the green.
The spot Ethereum ETFs are in no better shape. In fact, they are on the same six-week negative streak, pushing the total inflows down by nearly $1 billion. So the question now is whether investors are simply seasonally rotating from larger-cap digital assets into smaller altcoins, or have they completely abandoned BTC and ETH for the new kids on the block.
Binance founder Changpeng Zhao (CZ) floated freezing Satoshi’s Bitcoin and other dormant, quantum-vulnerable coins if they stay unmoved after a future network upgrade. He raised it as a question for the community, not a personal plan.
The Binance executive shared the idea on the Galaxy Brains podcast with Galaxy Research head Alex Thorn. He has since pushed back on reports that he would personally freeze Satoshi Nakamoto’s address for a year.
Is Freezing Satoshi’s Bitcoin a Good Idea?
The debate grew louder in March, when Google Quantum AI published research on breaking the cryptography that secures digital signatures.
Its team estimated an attack could need fewer than 500,000 qubits and run in minutes, well below earlier projections.
The risk sits in exposed keys. A quantum computer could derive private keys from public keys, then drain the wallets they protect.
More than a third of all Bitcoin had revealed a public key on-chain by March. That leaves them in addresses vulnerable to quantum theft.
Satoshi Nakamoto mined an estimated 1.1 million BTC in 2009 and 2010. That estimate rests on the Patoshi pattern traced by researcher Sergio Demian Lerner.
Bitcoin Price Performance. Source: BeInCrypto
At Bitcoin’s current market price near $63,244, that hoard is worth roughly $70 billion.
What CZ Actually Said
Zhao did not call for a seizure, nor did he say Binance would act. He put the decision to the community, asking why it should not set a roughly 1-year timeline.
Coins left in vulnerable addresses after that point would be locked in by a fork.
CZ said the popular take that he would personally freeze Satoshi’s address was not quite right. He also flagged a snag, that telling Satoshi’s wallets apart from other early miners is hard.
Just my personal view.
(I cringe when listening to myself. 🤣 I wish I can learn to say things more succinctly in the future.) https://t.co/RxrjyFNCyb
His thinking aligns with BIP-361, a draft by Jameson Lopp and five other researchers. It would block sends to vulnerable addresses about three years after activation, then void legacy signatures two years later.
The authors frame a blunt choice. A quantum thief could grab the exposed coins, or miners could slowly recover them. The network could instead lock them so no one wins.
That proposal even cites Bitcoin’s creator on the issue of lost coins.
“Lost coins only make everyone else’s coins worth slightly more. Think of it as a donation to everyone,” Satoshi Nakamoto, as quoted in the proposal.
The dormant coins are contested on another front. An anonymous plaintiff and two Wyoming LLCs are fighting a New York abandoned-property lawsuit.
They want 39,069 idle addresses, including the Satoshi coins, declared theirs. A Galaxy report by Thorn doubts it will prevail.
Any forced lock still violates a core Bitcoin rule: no one can take another person’s coins. Many would read it as confiscation.
CZ said there is no perfect answer. He warned that doing nothing could prove the worst outcome of all.
Good news for the American worker came at the worst possible moment for Bitcoin. Initial jobless claims fell by 4,000 to 226,000 for the week ending June 13. Layoffs are in the historically low range they’ve held for most of the post-pandemic era, and the unemployment rate has remained at 4.3% for a third straight month.
These numbers would look unambiguously healthy in almost any other setting. But Bitcoin didn’t seem to agree and slid below $64,000, down almost 3% on the day, after touching an intraday high of $66,315 the previous afternoon.
BTC spent the spring positioned as an asset waiting for the Federal Reserve to loosen financial conditions, and every reading showing a resilient labor market pushes that moment further into the future.
When hiring holds and firing stays contained, the Fed keeps the room it needs to keep policy tight, and Bitcoin has spent two years trading as a liquidity-sensitive instrument that responds to the expected path of interest rates far more than to whether a given economic print sounds encouraging to the people inside it.
Each of those labor numbers feeds directly into the market’s running estimate of what the Fed will do next, which is how a weekly jobless claims report ended up affecting the crypto market.
Why is a good jobs report seen as a liquidity problem?
Bitcoin’s sensitivity to labor data comes from the expectations they produce, not the numbers themselves.
Strong labor data lowers the perceived odds of rate cuts, keeps real yields elevated, supports the dollar, and reduces the appetite for speculative and longer-duration risk, which includes Bitcoin. A number that shows a stable jobs market shows tighter liquidity ahead.
Each layer of the labor data tells the Fed something different, which is why traders parse it all. Initial claims indicate whether companies are firing people, and at 226,000, they suggest employers mostly aren’t.
Continuing claims show whether laid-off workers are getting rehired, and those rose by 24,000 to roughly 1.81 million, the highest in nearly three months, with the average unemployed person now spending 11.6 weeks out of work, the longest duration seen since late 2021.
Payrolls measure how many jobs the economy is actually adding, and May’s 172,000 kept the three-month pace near 188,000. The unemployment rate shows how much slack exists in the system, and wage growth tells the Fed whether inflationary pressures are likely to stick around.
The composite picture from this week is a labor market that’s softening at the edges while remaining strong enough to give the central bank no reason to rush to ease interest rates.
The Fed confirmed that a day before the claims report landed. At Kevin Warsh’s first meeting as chair on June 17, the FOMC held its benchmark rate at 3.50% to 3.75%, as markets had fully expected, and then delivered the hawkish surprise in its projections.
The median dot for the end of 2026 climbed to 3.8% from 3.4% in March, which flips the committee’s base case from a cut to a hike, with 9 of 18 participants now expecting at least one increase this year and 6 expecting two.
Warsh withheld his own dot, stripped the easing language out of the policy statement, and told reporters the committee would deliver price stability, while the Fed lifted its year-end PCE inflation forecast to 3.6% from 2.7% as May CPI ran at 4.2%, its hottest reading since 2023.
Traders repriced the path almost immediately. Futures now put the odds of a December rate hike near 85%; expectations for any 2026 cut have collapsed toward zero; the 2-year Treasury yield jumped more than 16 basis points to 4.22%; and the dollar index rose to its highest level in more than a year.
Bitcoin’s reaction differs from the equity reaction because the two assets are exposed to the same data through different channels. Stocks can absorb strong jobs because robust employment implies consumers still have income and companies still have demand to sell into, which supports earnings.
Bitcoin’s link to the macro picture runs almost entirely through liquidity, rates, dollar strength, and risk appetite, and strong labor data tightens every one of those channels at once.
This is the return of the regime where weak economic news can lift risk assets by raising the odds of Fed easing, and firm economic news can pressure them by delaying it. Crypto investors caught in that regime care more about the policy reaction than about the economy’s underlying health, which is why the marginal buyer can treat a soft data point as a reason to add risk and a firm one as a reason to trim risk.
A single claims print doesn’t set Bitcoin’s trend, and there’s a real bullish counterargument to that. BTC can climb through strong jobs data if ETF inflows overwhelm the macro pressure, if the dollar weakens for its own reasons, if inflation cools without the labor market breaking, or if investors lean on Bitcoin as a hedge against fiscal and political risk.
The best example of this we’ve seen so far is energy, where crude collapsed from about $86 to $76 after the US-Iran framework, a move that’s disinflationary enough to eventually soften the Fed’s stance, and CryptoSlate covered how oil losing its grip handed the next leg of the trade back to liquidity.
Incoming data releases will decide the trade. Warsh’s removal of forward guidance means every CPI, PCE, payrolls, and continuing-claims release between now and December becomes a live policy input, with Treasury yields, the dollar index, and ETF flows acting as the running scoreboard.
The jobs market moves Bitcoin because every labor print changes the market’s Fed script, and this week’s resilient employment told traders that monetary relief is farther away than they’d hoped. Strong hiring is good for the people getting hired, but it works against Bitcoin when crypto needs the Fed to believe the economy is soft enough to ease.
Robert Kiyosaki says he is watching gold, silver, Bitcoin (BTC), and Ethereum (ETH) for a technical reversal before buying, arguing that the macro backdrop, not falling prices, decides whether hard assets are worth holding.
Precious metals extended a steep retreat this week, and a fresh dispute over the Strait of Hormuz tested a days-old US-Iran ceasefire. BTC and ETH edged higher over 24 hours.
Bitcoin and Ethereum Prices After Reported Strait Closure. Source: Coingecko
Kiyosaki Watches Gold and Silver Context, Not Price
Kiyosaki built his case around the environment rather than the chart. The Rich Dad Poor Dad author said a falling market alone never tells him whether to buy or sell.
He pointed to whether political and banking leaders are fixing the economy or making it worse, and has called dips buying opportunities before.
“I have learned to understand the ‘context’ or the environment the asset is in….not the price… So I am watching prices of gold, silver, Bitcoin, and Ethereum on technical charts and will buy when prices reverse their decline,” Kiyosaki wrote in a post.
The metals he is eyeing set records before the pullback. Gold hit an all-time high near $5,595 an ounce in late January and silver topped $100 for the first time.
Both records capped a run nearly doubling gold and quadrupling silver in a year.
This week’s ceasefire then drained the safe-haven premium the February war and Hormuz threats had rebuilt.
Kiyosaki keeps backing silver and Bitcoin and claims the charts point to a rebound, with no price target or timeline.
Hormuz Dispute Keeps the Safe-Haven Bid Alive
The backdrop Kiyosaki described stayed unsettled. Iran’s Revolutionary Guard declared the Strait of Hormuz closed over alleged ceasefire violations and warned vessels away.
Vice President JD Vance countered that no evidence backed the claim. Vance said the waterway stayed open, and CENTCOM reported 55 ships moving more than 17 million barrels of oil through Hormuz on Saturday.
That is close to the 20 million a day, about a fifth of global oil demand, the EIA says the strait normally carries.
Bitcoin traded above $64,000, up about 1.4%, while ETH held near $1,740, with both gains following developments at the Strait of Hormuz.
Even so, BTC sits roughly 49% below its October record near $126,000 and ETH about 65% under its August peak, with BTC down about 17% and ETH 18% over the past month.
Earlier Hormuz tensions dragged Bitcoin lower, and a US strike on Iran under the truce sent Bitcoin, gold, and oil moving within hours.
With US-Iran talks set for Switzerland on Sunday, the next signal is whether the ceasefire holds. For Kiyosaki, the charts rather than the headlines will decide his next move.
Bitcoin’s blockchain is showing its strongest activity since late 2024, creating a rare split between rising network use and a weakening market price.
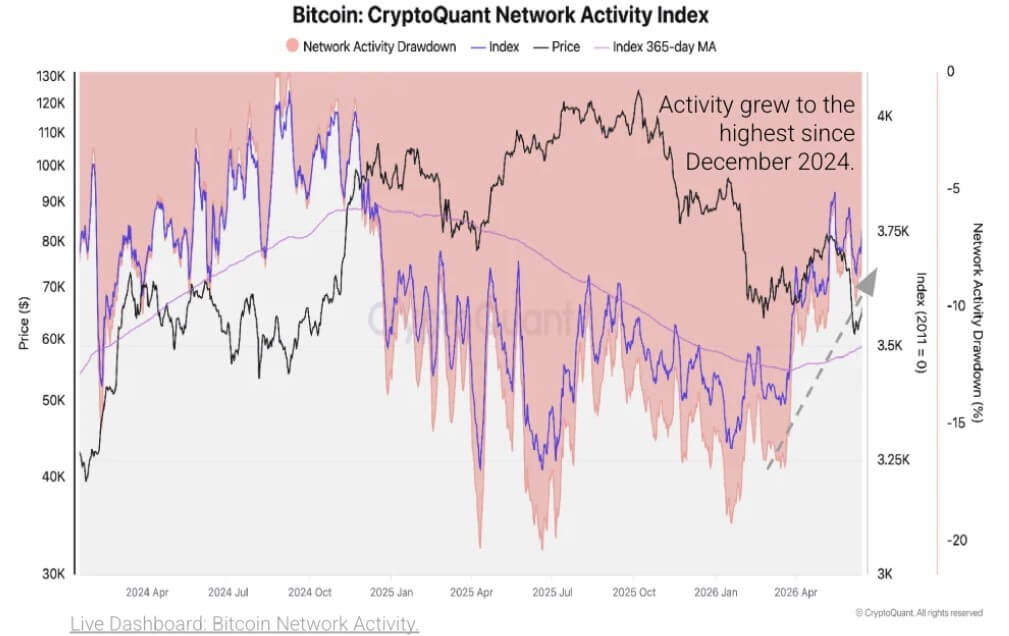
CryptoQuant said in a note shared with CryptoSlate that its Bitcoin Network Activity Index has moved above its long-term trend for the first time since mid-2024.
The index has climbed steadily since January and recently reached its highest level since late 2024, leaving it only about 7% below the record reached in September 2024.
Bitcoin Network Activity (Source: CryptoQuant)
The shift began in late March and has held for several weeks, suggesting that the rebound in activity is more than a one-day spike.
Meanwhile, the rise in network activity comes as the Bitcoin price remains under significant selling pressure.
The largest cryptocurrency has fallen about 30% this year to below $65,000, according to CryptoSlate data, extending a slide of more than 50% from its late-2025 record near $126,000 as months of selling pressure and weaker risk appetite weigh on the market.
Small transfers drive the rebound
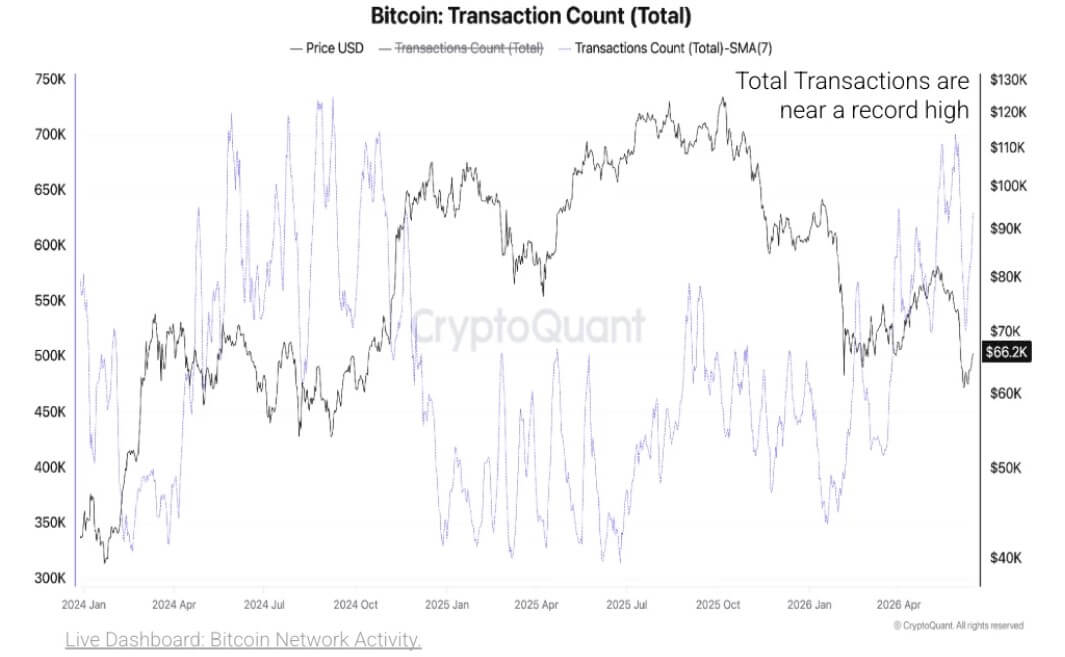
The network rebound is being driven mainly by transaction counts rather than large-value settlement.
CryptoQuant data shows total daily Bitcoin transactions rising above 800,000 at points in 2026, near the strongest readings of the 2023-2025 cycle and more than double the lows seen in 2025. Average transactions per block have also climbed, showing sustained block use from a transaction-count perspective.
The composition of that activity is the more important part of the story.
Transactions worth less than 0.01 BTC now account for about 80% of daily Bitcoin transaction counts, CryptoQuant said. That is up from roughly 44% in 2023.
Bitcoin Total Transactions (Source: CryptoQuant)
The smallest cohorts, including transactions below 0.001 BTC and below 0.01 BTC, have surged this year and are approaching the previous peak reached in 2024.
That means Bitcoin’s network is busier, but much of the growth is coming from very small transfers. In market terms, the blockchain is processing more messages, but not necessarily moving proportionally more economic value.
The pattern resembles prior bursts of protocol-driven activity on Bitcoin, when token experiments, inscriptions, and data services increased transaction counts without matching the value profile of traditional BTC transfers.
OP_RETURN use points to data-heavy demand
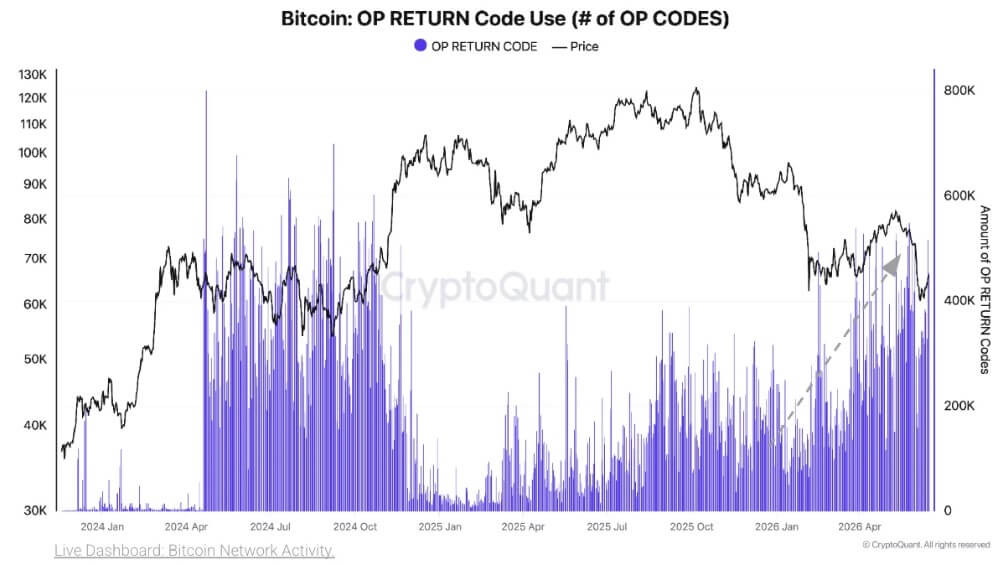
The rise in small transfers has coincided with a sharp increase in OP_RETURN usage.
OP_RETURN is used to attach data to Bitcoin transactions without creating spendable outputs. That has made it a common tool for data-layer activity on Bitcoin, including token-related transfers, timestamping, and inscription-adjacent use cases.
CryptoQuant said OP_RETURN outputs have climbed to near-record levels this year, with the increase linked to activity from Runes, Ordinals, BRC-20-style markets, and other data-writing services.
Bitcoin OP_RETURN Code Use (Source: CryptoQuant)
These systems can generate large numbers of low-value transactions because the economic payload is often the data attached to the transaction rather than the amount of BTC being transferred.
That helps explain why the network activity index is rising while the price remains weak. The new activity reflects demand for Bitcoin block space, but it is not the same thing as a broad recovery in investor appetite for BTC.
It also complicates the long-running debate over Bitcoin’s use case. Supporters may view the surge as evidence that Bitcoin is becoming a more active settlement layer for new types of on-chain activity.
However, critics may see it as congestion from transactions that do little to support Bitcoin’s monetary role.
For now, the data supports both readings to some degree. Bitcoin is being used more. But the use is concentrated in small transactions that differ from the financial transfers many investors associate with durable network demand.
Mempool congestion returns, but fees stay low
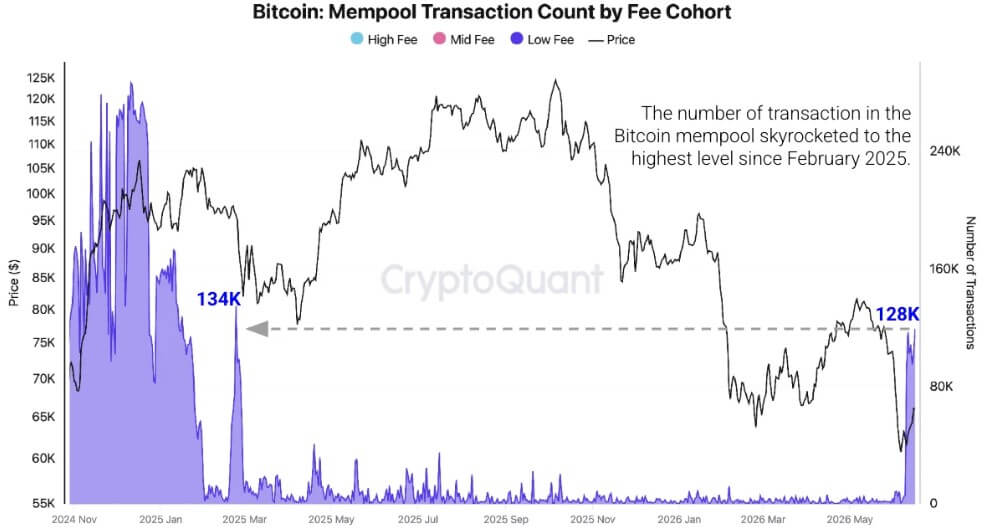
The jump in micro-transactions has started to affect the mempool, where unconfirmed Bitcoin transactions wait before being added to blocks.
CryptoQuant said the Bitcoin mempool transaction count has risen to about 128,000, the highest since late February 2025. The congestion is concentrated in low-fee transactions, consistent with the increase in OP_RETURN and micro-transaction activity.
The current backlog remains well below the extreme peaks seen in September 2023 and November 2024. Still, the increase shows that non-financial or low-value activity is taking up a larger share of Bitcoin transaction flow.
That could become more important if the trend continues. Higher competition for block space can push up fees, especially for users who need time-sensitive settlement.
In past cycles, congestion from inscriptions and token-related activity created brief periods of elevated fees and renewed debate over whether Bitcoin’s block space should be used primarily for monetary transfers or broader data applications.
So far, the latest activity burst has not produced a comparable fee boom.
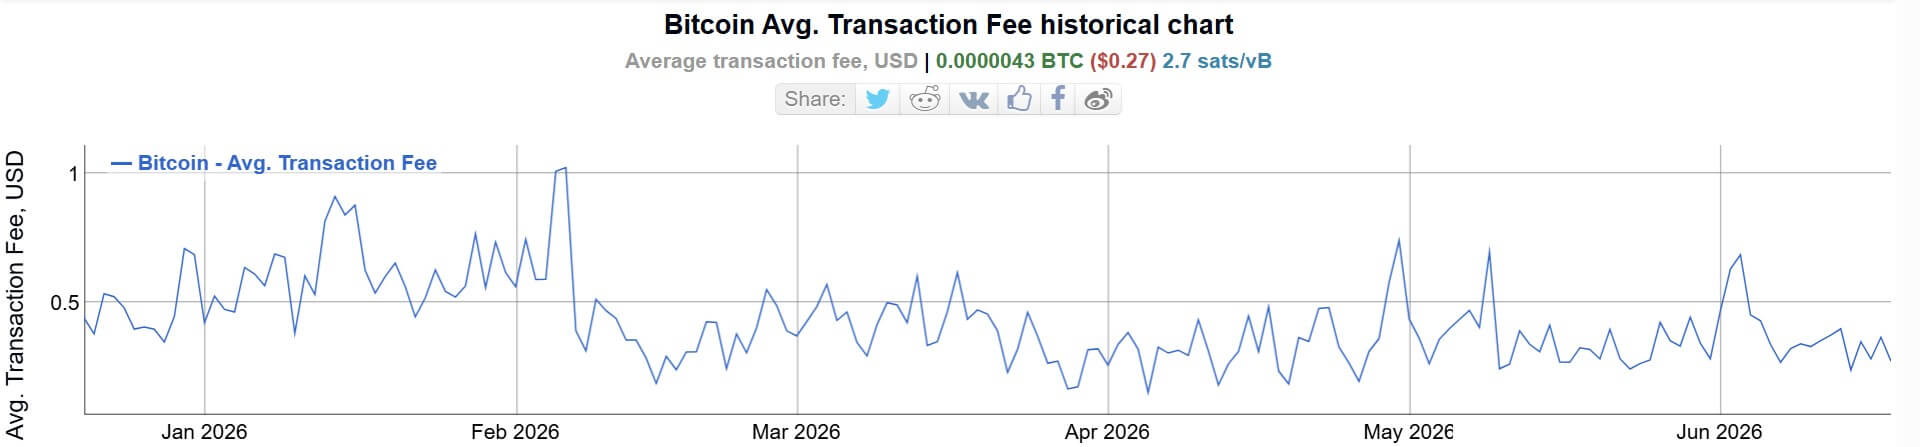
YCharts data, based on Blockchain.com figures, showed daily Bitcoin transaction fees at 3.458 BTC on June 18, down 50.25% from a year earlier.
Bitcoin Average Network Fees (Source: BitInfoCharts)
That gap is central to the current story. Transaction counts are rising, but the fee market has not followed with the same force.
Miner revenue remains the weak link
The muted fee response matters because Bitcoin miners have relied more heavily on transaction fees since the April 2024 halving cut the block subsidy to 3.125 BTC.
At roughly 144 blocks a day, the subsidy remains the main source of miner revenue. Fees contribute only a small share in BTC terms when network costs are low, limiting the direct financial benefit miners receive from higher transaction counts.
That makes the current activity surge less straightforward than prior periods when congestion produced large fee spikes. More transactions can signal stronger demand for block space, but if those transactions are low-value and low-fee, the impact on miner economics remains limited.
The result is a mixed signal for the Bitcoin market.
On one hand, the blockchain is seeing its strongest activity in nearly two years, driven by real demand for small transactions and data-linked use cases.
On the other hand, Bitcoin’s price remains under pressure, sellers still dominate the short-term market structure, and the fee market has not shown that users are willing to pay significantly more for settlement.
That leaves Bitcoin with a busy network but an unresolved market question: whether this new wave of activity can become durable economic demand, or whether it remains another burst of low-value traffic that fills blocks without changing the broader investment picture.
The Oman Ministry of Transport, Communications and Information Technology has launched a state-backed bitcoin mining pool OmanHash.om, that every licensed miner in the country must now use in their mining operations.
According to Oman’s newly set up regulatory framework, OmanHash.om is now the only mining pool for licensed operators in the Sultanate.
Mining pool operation and capacity
Digital energy and infrastructure company, Enegix Global, developed the technology platform and liquidity backend for the mining pool. Frontier Technologies LLC, an Omani blockchain firm based in Muscat, will manage all local operations.
OmanHash.om uses a Full Pay-Per-Share (FPPS) payout model, where miners receive payouts based on shares submitted regardless of whether a block is found by the pool, and with the pool operator collecting a fee.
The country has announced that the initial target for the new mining pool is approximately 10 exahashes per second (EH/s) of computing power. Oman controls almost 3% of the entire bitcoin network hashrate worldwide, which is equal to about 30 EH/s, according to Q2 2026 data from Hashrate Index.
The Omani Sultanate has invested heavily in bitcoin mining infrastructure since 2022. More than $700 million has gone into mining and data center projects in the Salalah Free Zone, including two major facilities that launched in 2022 and 2023.
The Kazakhstan precedent amid Oman’s investment
Enegix had previously built and currently operates btcpool.kz in Kazakhstan, launched in October 2023 after the country passed a digital assets law requiring licensed miners to operate through government-accredited pools and report revenue directly to tax authorities. Oman has now become the second country with this sovereign mining pool model.
“This is our second sovereign mandate, and it validates the model we have been building since Kazakhstan,” said Olzhas Amirov, chief business development officer of Enegix Global, according to TheEnergyMag. “Clear licensing frameworks help miners operate legally, avoid excessive taxation, and establish transparent communication with authorities.”
With OmanHash.om added, Enegix says its combined pool operations across 21pool.io, btcpool.kz, and OmanHash.om reach approximately 25 EH/s. Yersaiyn Nurtoleuov, Enegix’s chief product officer, said: “Our target is 30 EH/s, and we are actively building the infrastructure and partnerships to get there.”
“This week’s FOMC meeting exemplified the best of the Fed traditions: vigorous debate, open-mindedness, commitment to mission, responsibility and accountability for performance… Getting monetary policy right — or as near to it as we can do. That is our North Star.”
The committee held the target range for the federal funds rate at 3.50%–3.75%.
Economic activity is “expanding at a solid pace,” with strong productivity, capital investment, and stable labor market, but inflation has run well above 2% for over five years.
On commitment to price stability:
“I’m pleased to report that members of the FOMC are unambiguous and unanimous that this committee will deliver price stability.”
On the new, shorter policy statement:
“It is a bit shorter, a bit simpler, and dispenses with some older language. It just gives you the facts, as best we can judge it.”
“Absent, also, is so-called forward guidance, which we agreed was not well suited to the current policy conjuncture.”
On the dot plot/SEP:
“It has been the practice of this committee for participants to submit these projections and I have encouraged my colleagues to continue to do so. I, however, have refrained from offering projections of my own.”
Median projections showed a slightly higher rate path, with nine officials seeing at least one hike in 2026.
On the five task forces (communications, balance sheet, data sources, productivity/jobs/AI, inflation frameworks):
“These subjects are timely, consequential, and in my view, worthy of a fresh look… They will have a straightforward charge: ask hard questions, examine current practice, consider alternatives.”
“Each task force will have an objective shared by everyone… A Federal Reserve that is clear-eyed about its mission, fit for purpose, and focused on the future.”
Key Q&A Quotes
On the 2% inflation target:
“That is the Federal Reserve’s long-held objective of 2%. The ‘two’ is the left of the decimal point. For now, ‘zero’ is to the right.”
“I see no reason until we have reestablished our commitment and ability to deliver on the 2% inflation objective to revisit that.”
On internal decision-making (“family fight”):
“We can agree to some of the recommendations, disagree with others, have a good family fight about it. But what comes from them will — I hope and believe — make the discussion we have internally better, stronger, more of a dialectic, so that we can finally deliver on that price stability objective.”
On inflation being a choice / commitment:
“The commitment to deliver is strong, unanimous, and unambiguous, and that’s I think an important message we’ve missed for five years, and we’re going to fix that.”
Warsh emphasized data-dependency, reduced forward guidance, and letting markets react to data rather than Fed signals.
He avoided locking in future rate paths and focused on long-term institutional improvements.
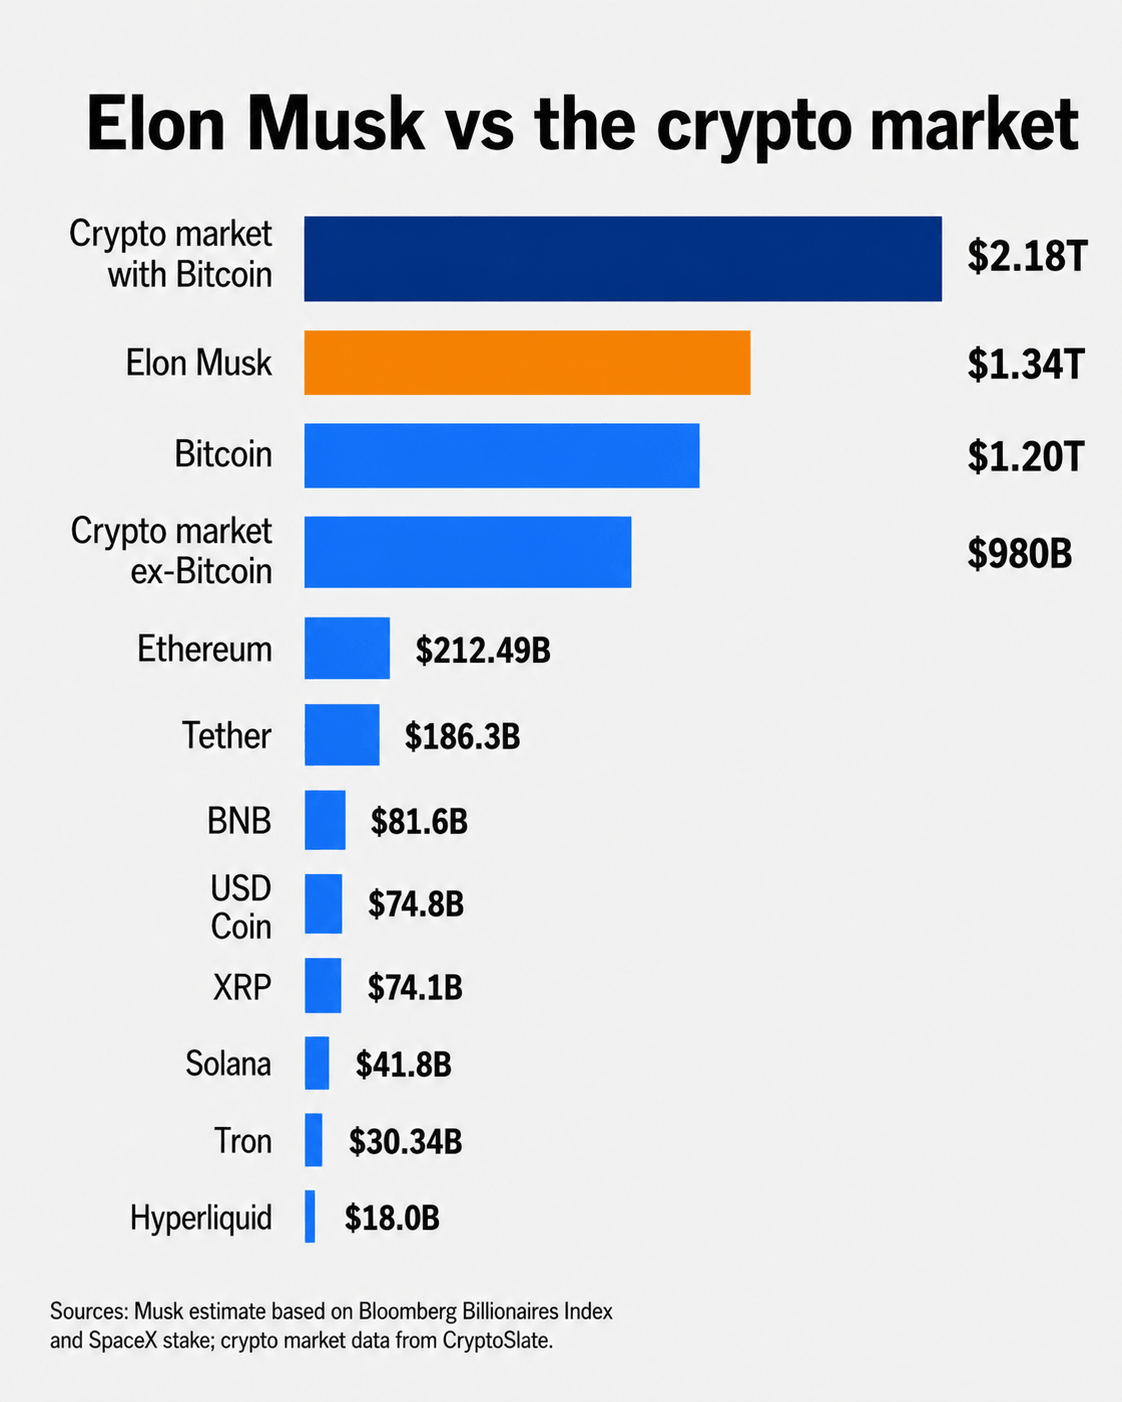
Elon Musk’s personal fortune has surpassed the market value of Bitcoin, a milestone that shows how quickly SpaceX’s public-market debut has reshaped both wealth rankings and the broader conversation around speculative risk.
According to Bloomberg’s Billionaire Index, Musk’s net worth rose to about $1.32 trillion as SpaceX shares traded above $200, extending a rally that began with the company’s record initial public offering last week.
At that level, his estimated personal wealth exceeds Bitcoin’s roughly $1.29 trillion market capitalization, based on CryptoSlate’s pricing for the digital asset.
Elon Musk Net Worth vs Crypto Market
While this comparison is imprecise by design, it offers a striking snapshot of how SpaceX’s rapid rise has moved into the center of global markets and catapulted Musk’s wealth into uncharted territory.
Over the past year, the total cryptocurrency market has fallen from a peak of about $4.21 trillion to roughly $2.23 trillion, according to CryptoSlate data. During this period, Bitcoin has dropped by more than 50% from its late-2025 record high near $126,000, amid months of selling pressure and weaker risk appetite.
The reversal follows a powerful rally that began during Donald Trump’s 2024 presidential campaign and continued through his return to the White House.
At the time, BTC crossed $100,000 for the first time as investors responded to industry-friendly appointments, regulatory proposals, and expectations that Washington would take a softer approach toward digital assets.
However, those gains have since faded this year as crypto exchange volumes have declined, leveraged positions have been flushed out, and capital has moved back toward large technology stocks, private-market proxies, and newly listed growth companies.
That backdrop makes Musk’s wealth milestone less about Bitcoin losing its role as crypto’s benchmark and more about the speed at which SpaceX has become a competing outlet for speculative capital.
Meanwhile, this comparison is even sharper outside Bitcoin. With the crypto market worth about $2.23 trillion and Bitcoin accounting for roughly $1.29 trillion, Musk’s estimated fortune is now larger than the combined value of the rest of the digital-asset market.
The company priced its IPO at $135 a share and has since rallied by more than 50%, pushing its market value to about $2.7 trillion. The move has placed SpaceX among the world’s most valuable public companies, ahead of Amazon and near Microsoft’s market capitalization.
The rally has been fueled by a rare combination of scarcity, brand power, and momentum. CryptoSlate previously reported that only a limited portion of SpaceX’s equity entered public trading, leaving investors to compete for a small float in one of the most anticipated listings in years. That imbalance has helped turn demand into price pressure.
At the same time, retail investors have been central to the stock’s rapid rise.
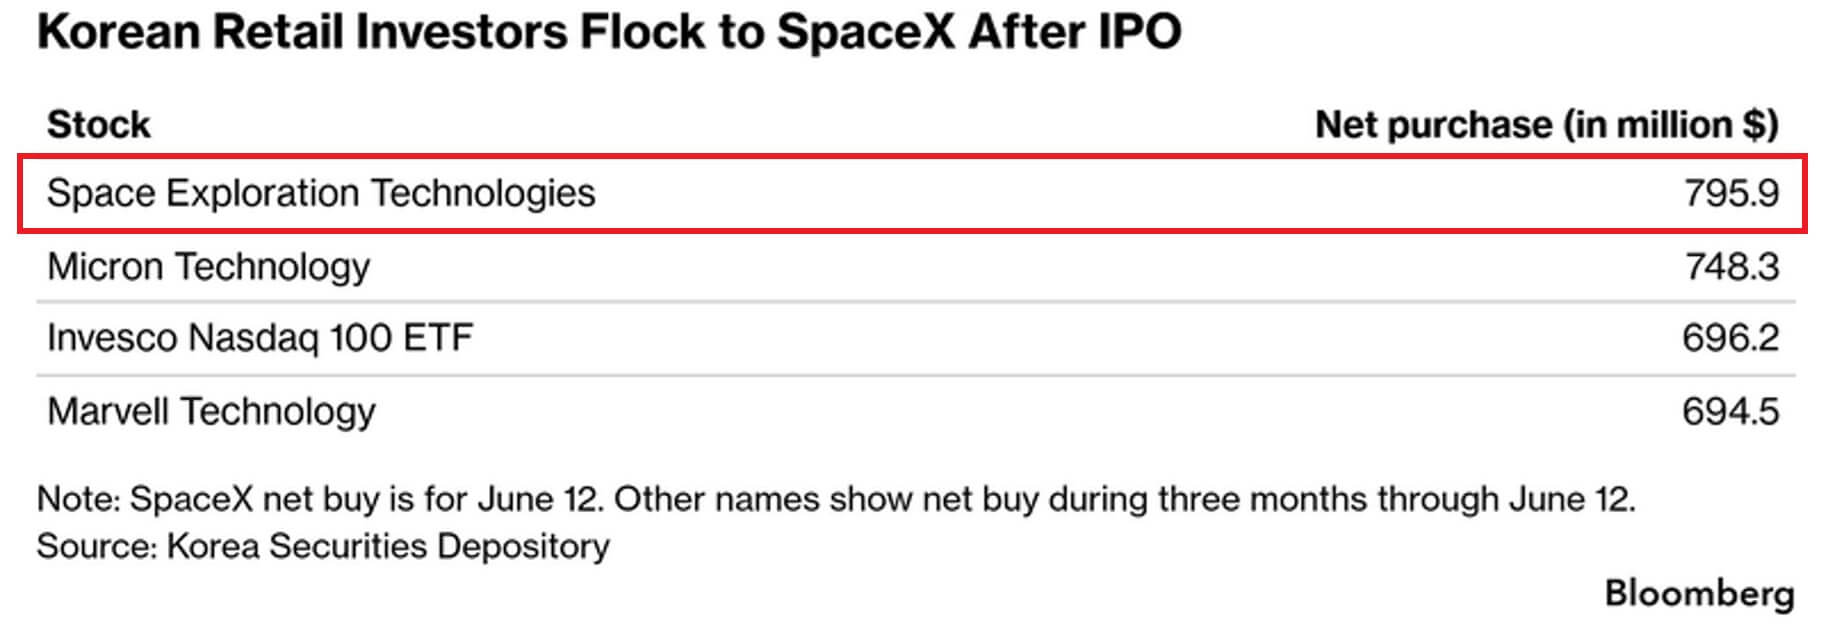
South Korean individual investors bought about $795.9 million of SpaceX shares on June 12, the stock’s first day of trading, according to market-flow data cited by Global Market Investor. That made SPCX the most purchased US stock among South Korea’s retail traders in a single session.
The buying exceeded three-month net purchases in several major US technology names. Over the prior three months, South Korean retail investors bought $748.3 million in Micron Technology, $696.2 million in the Nasdaq 100 ETF, and $694.5 million in Marvell Technology, according to the same data.
SpaceX IPO Draws Retail Investors
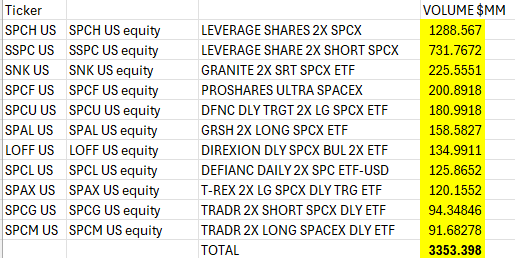
Meanwhile, the rush for SPCX is also evident in leveraged exchange-traded funds tied to the firm, which have seen heavy trading in their first days on the market.
Eric Balchunas, senior ETF analyst at Bloomberg Intelligence, said total volume across 2x SpaceX ETFs topped $3 billion, up from about $1 billion the previous day.
One product, trading under the ticker SPCH, recorded about $1.3 billion in day-two volume. Balchunas said that was the highest second-day trading volume ever recorded by an ETF, above the roughly $500 million logged by BlackRock’s spot Bitcoin ETF (IBIT) on its second trading day.
SpaceX Leveraged ETFs (Source: Eric Balchunas)
This demand is notable because many of the products track the same underlying stock and offer similar leverage. That suggests investors are not simply looking for long-term exposure to SpaceX. Many are using the funds to express short-term directional bets.
Ultimately, these numbers show that SpaceX is being treated less like a conventional aerospace listing and more like a global momentum trade.
Investors who missed the IPO allocation have been buying the stock in the open market, while others have turned to exchange-traded funds, options, and crypto-linked derivatives to gain exposure to the same product.
SpaceX valuation questions grow louder
The pace of the rally has intensified questions about whether SpaceX’s valuation is outpacing its business fundamentals.
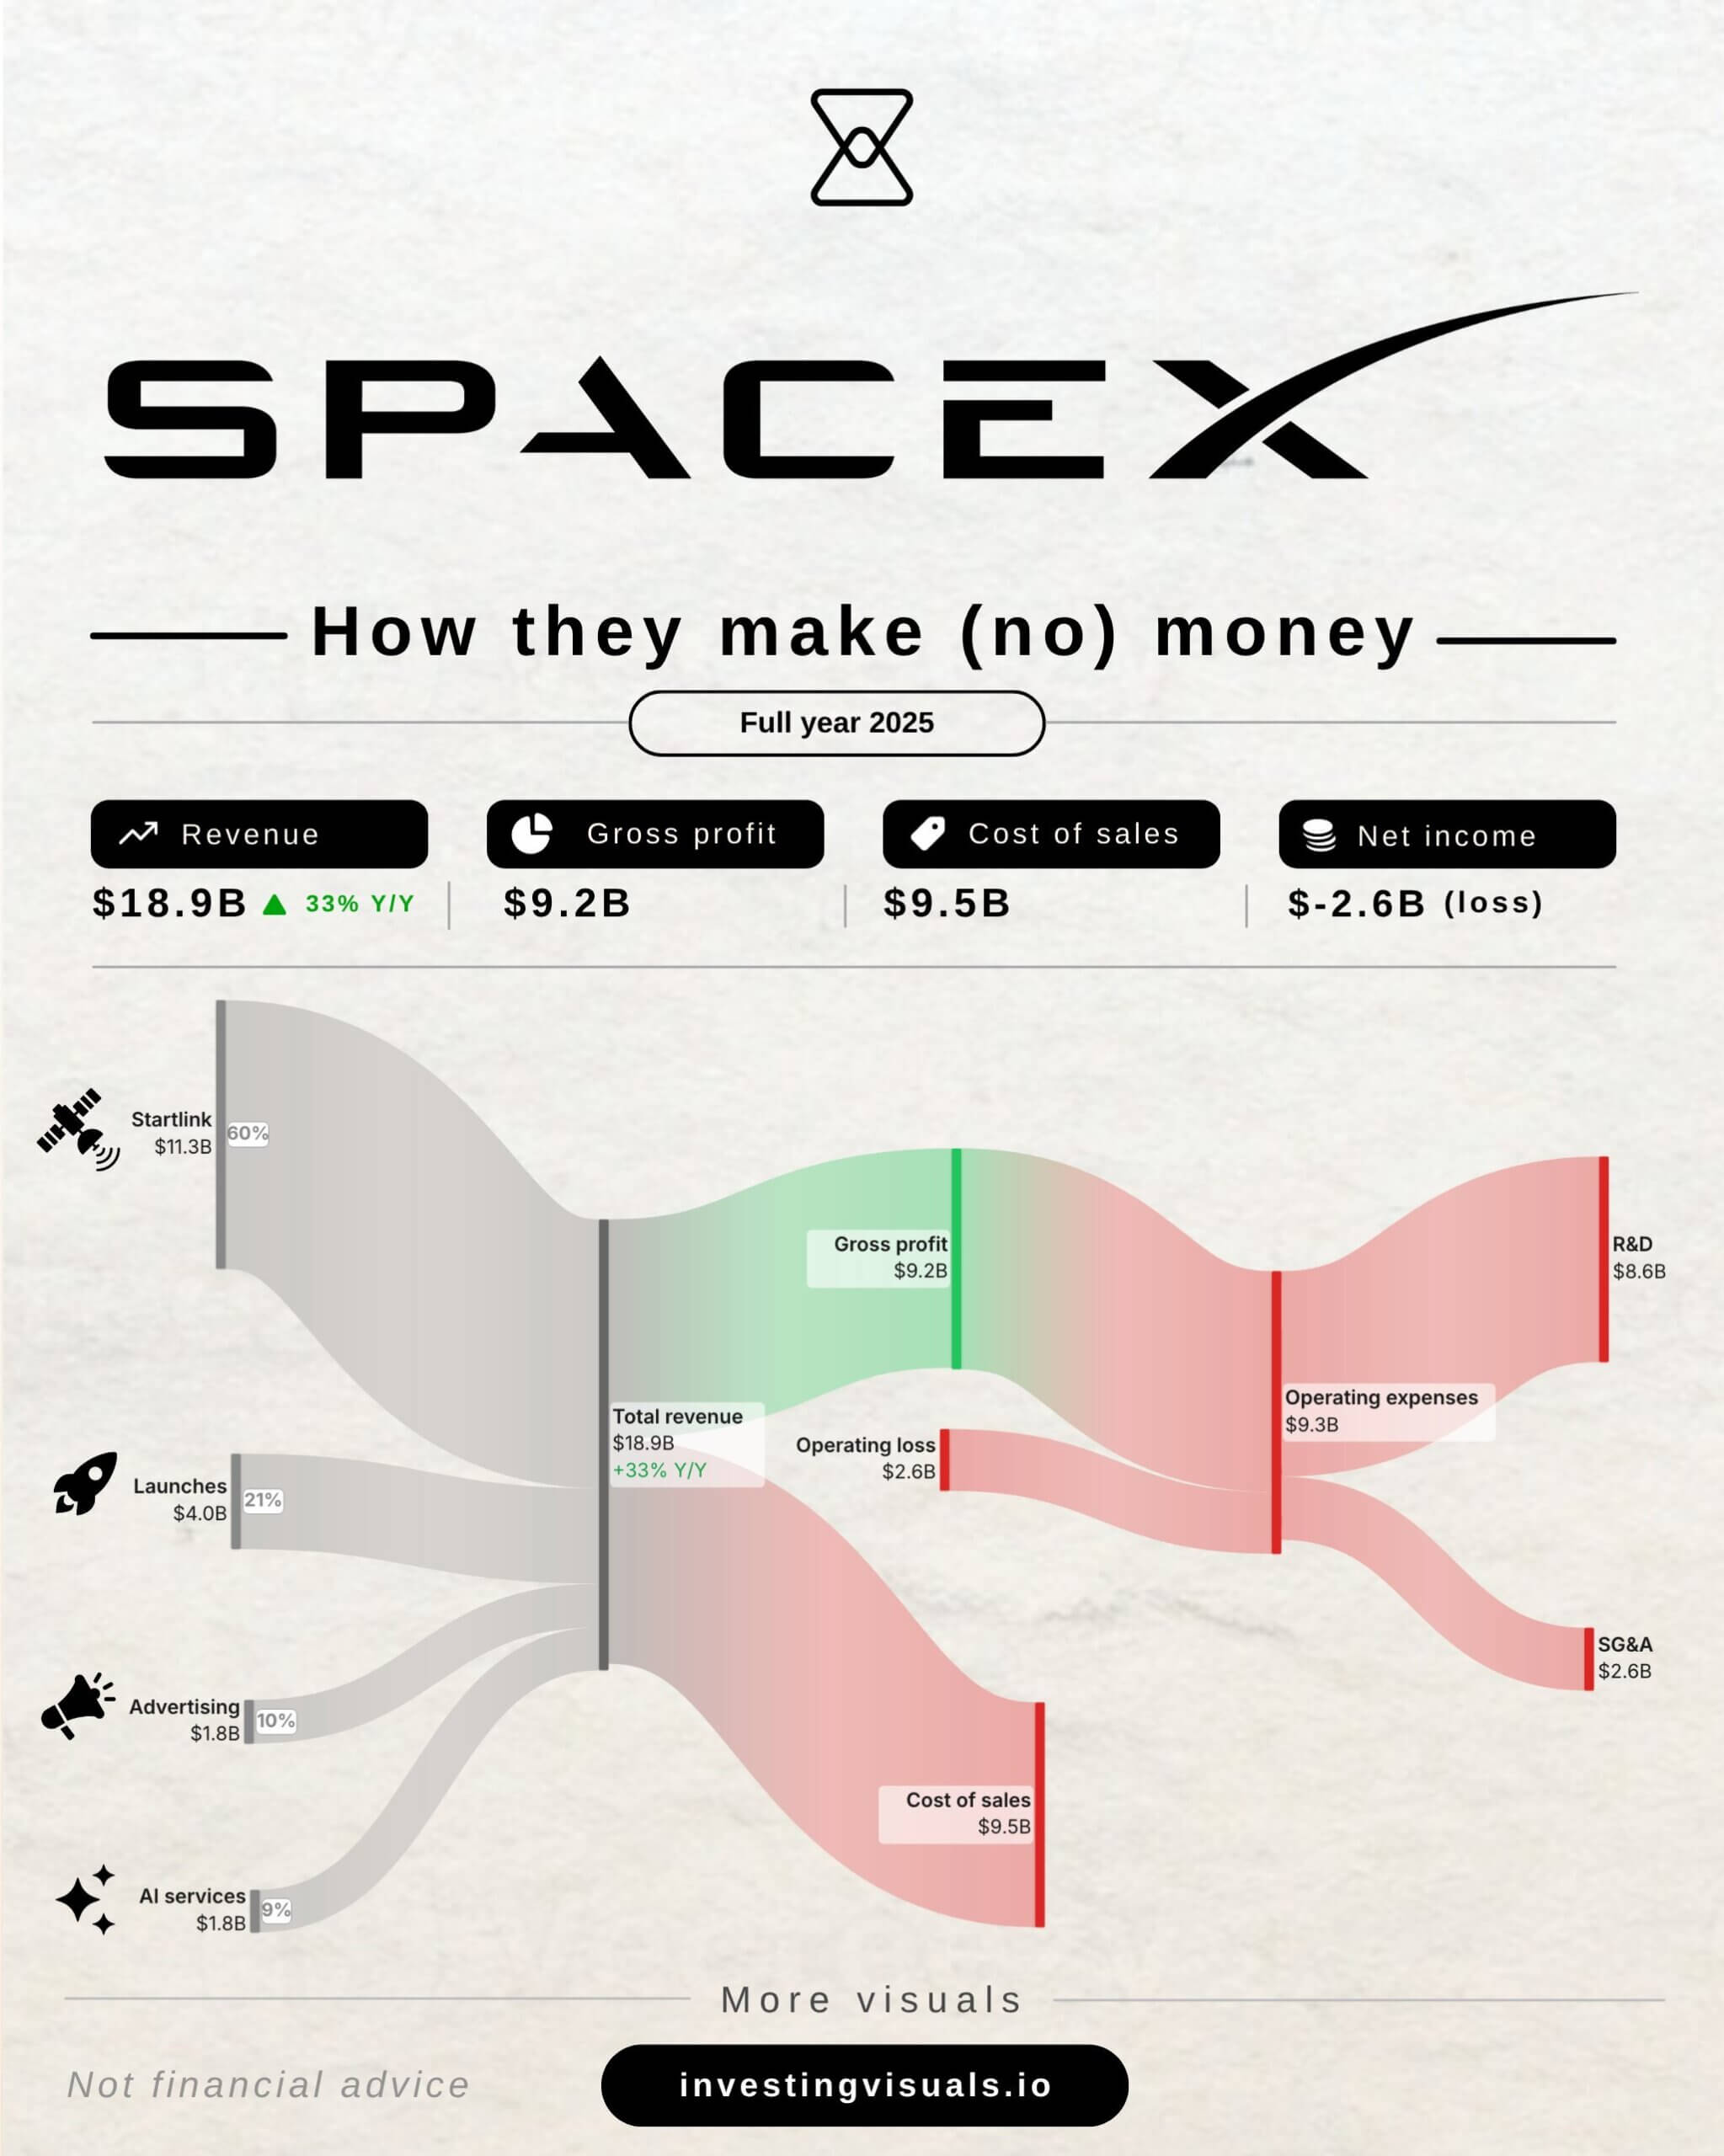
Musk has said SpaceX could reach $1 trillion in annual revenue by 2030, a target that has helped investors price the company as more than just a rocket-and-satellite business. The market is also assigning value to Starlink, artificial intelligence, launch infrastructure, and Musk’s wider technology ecosystem.
Current financials show a company still spending heavily to build that future. SpaceX reported a net loss of $4.94 billion in 2025 on revenue of $18.67 billion. The company recorded another $4.27 billion loss in the first quarter of 2026, reflecting capital spending on Starlink, launch capacity, computing infrastructure, and artificial intelligence initiatives.
SpaceX Financial (Source: Rand Group)
Those losses have not stopped the rally. But they have widened the gap between what SpaceX is today and what investors are paying for it to become.
That is where the Bitcoin comparison becomes useful. Bitcoin’s market value has always depended on what buyers are willing to pay for scarcity, network strength, and future monetary relevance. SpaceX is now being priced with a similar forward-looking logic, only through the structure of a public company attached to Musk.
For now, public markets are rewarding that story more aggressively than crypto.
While Musk’s fortune may not stay above Bitcoin’s market value forever because SpaceX shares could fall, Bitcoin could rebound, or both could move sharply in opposite directions.
However, the milestone captures the current state of risk appetite: the biggest speculative trade in markets is no longer necessarily a token. It is a rocket company.
The first FOMC meeting with the new Federal Reserve Chair, Kevin Warsh, at the helm of the central bank didn’t provide any surprises, as the entity expectedly left the interest rates unchanged.
With the benchmark remaining between 3.5% and 3.75%, bitcoin’s price reacted with minor initial volatility, but there are some warning signs about an upcoming correction.
Recall that nearly two months ago, the Fed under then-Chair Jerome Powell left the rates unchanged for the third consecutive time. However, there were signs from Powell that rate hikes might follow suit.
Despite today’s non-event, as it was described by David Wessel, director of Brookings’ Hutchins Center on Fiscal and Monetary Policy, he also said that Kevin Warsh now finally has the power to change things at the Fed after years of “ranting about” it.
Bank of America’s fund manager survey showed that 55% anticipated Warsh would be hawkish at the press conference, but Stephen Juneau, the bank’s US economist, held the opposite view.
“The investor consensus seems to be that Warsh will lean hawkish in his press conference. We think he’ll be dovish.”
Bitcoin’s price was slightly volatile in the hours leading up to the event, going below $65,000 earlier today before it shot up to $66,400. However, it dipped by over a grand in the first minutes after the news of the unchanged rates went live.