What’s Going On With Ethereum And Why Is Price Moving This Way?
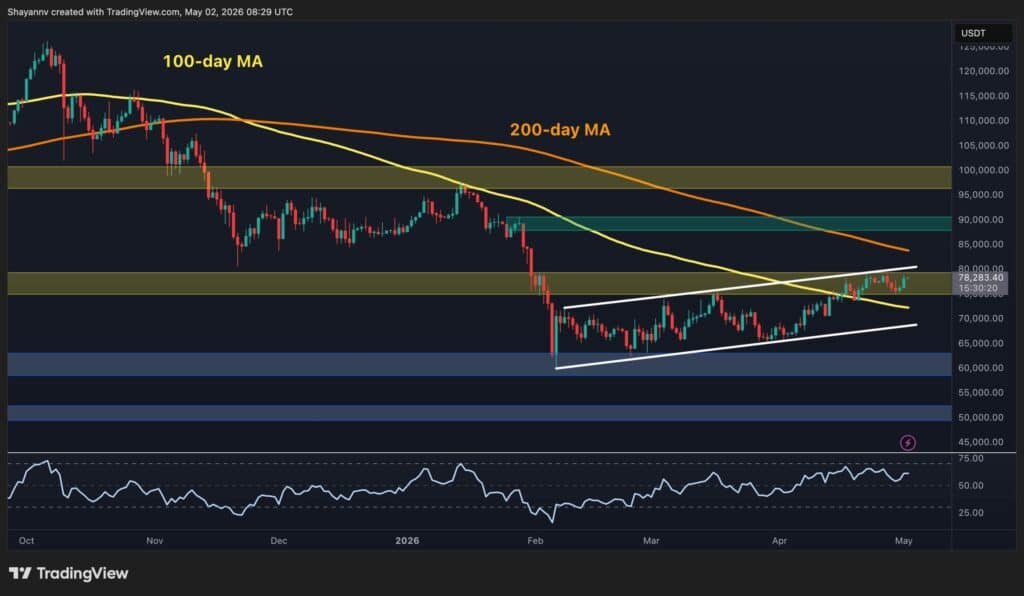
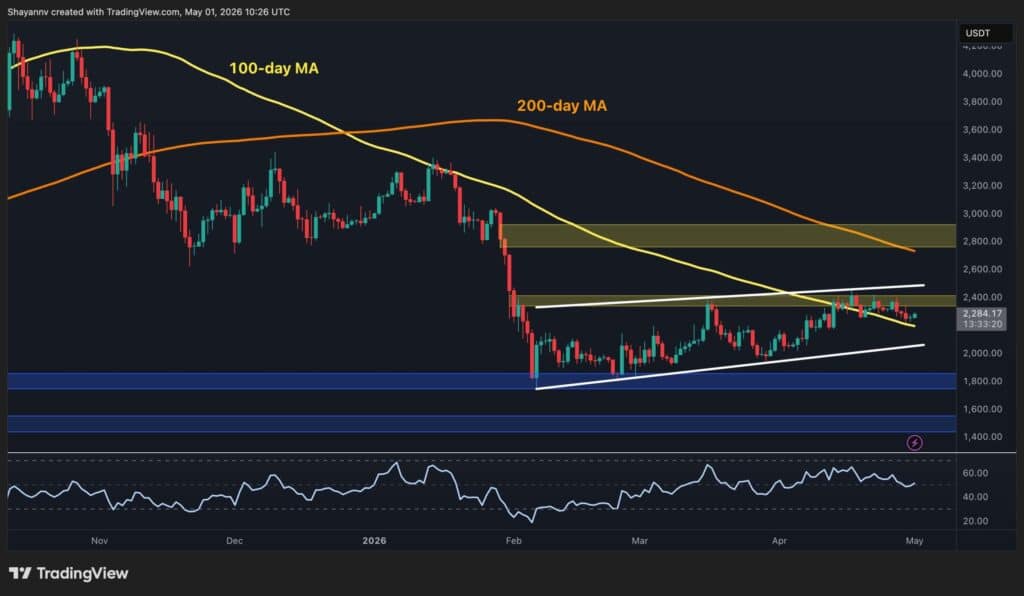
Ethereum’s repeated failure to decisively break above $2,450 signals weakness across the broader crypto market and suggests institutional traders should prepare for further downside until that barrier is convincingly reclaimed. The level’s rejection mirrors equivalent resistance on Bitcoin near $81,000, indicating a synchronized vulnerability affecting both major assets simultaneously.
- Ethereum has repeatedly tested but failed to reclaim the $2,450 resistance level, which serves as confirmation point for bullish continuation.
- The $2,450 barrier on Ethereum correlates to approximately $81,000 on Bitcoin, creating a synchronized breakout signal across major crypto assets.
- Technical rejection at this level has triggered distribution phase weakness, leaving the market vulnerable to further pullbacks without decisive reclaim.
- $2,450 Ethereum resistance level marking critical reclaim zone for bullish momentum confirmation
- $81,000 Bitcoin equivalent resistance zone correlating directly with Ethereum’s structural barrier
- Distribution Current market phase suggesting accumulation of selling pressure below key resistance
Ethereum has stalled in recent weeks despite multiple upward pushes, with price action revealing a technical framework that explains the repeated failure to sustain momentum. The core issue centers on a resistance level near $2,450 that the market has approached but consistently rejected, preventing the kind of decisive breakout that would signal genuine bullish continuation.
According to technical analysis mapping this structure, Ethereum’s inability to reclaim this zone has triggered a distribution phase characterized by sufficient selling pressure to trap bullish traders and prevent higher-timeframe confirmation. The stall is not random: it reflects a specific structural weakness that has institutional implications across the broader crypto market.
Ethereum’s $2,450 Barrier Functions as Market’s Critical Confirmation Point
The $2,450 level emerged in early May as a decisive technical marker rather than a simple round-number resistance. Analysis outlined at that time identified this zone as a reclaim area with straightforward validation requirements: a move above it, even briefly, would constitute genuine confirmation that Ethereum had broken free from its range-bound trading.
The framework did not require complicated wick structures or extended time above the level. A decisive push through $2,450 would have been sufficient to signal directional strength to the broader market.
The reasoning reflects a core principle institutional traders use when evaluating breakout scenarios. Major resistance levels often attract test attempts that fail without generating the required confirmation, especially when underlying buying pressure proves insufficient to sustain the move.
The $2,450 level was positioned as precisely such a barrier: a point where price discovery would either confirm the uptrend or reveal weakness requiring caution. Without a clear reclaim, the framework maintained that upside momentum could still reverse, trapping late buyers and reinforcing the range-bound structure.
What made this level particularly significant was its correlation to Bitcoin’s structure. The $2,450 zone on Ethereum mapped to approximately $81,000 on Bitcoin, creating a synchronized technical signal across the two major assets. If Ethereum confirmed strength at its barrier, market participants would gain confidence that broader crypto momentum had turned decisively higher.
Conversely, rejection at this level would suggest systemic weakness affecting both assets simultaneously, with downside implications for the entire complex.
Market Rejection at $2,450 Triggered Expected Bearish Unwind
The market tested the resistance zone but failed to produce the decisive move above $2,450 required for confirmation. Although price action approached the level, it never generated the convincing wick or sustained push that would have validated the bullish scenario. Instead, rejection followed, and Ethereum began drifting lower as the distribution phase intensified.
This outcome unfolded precisely as the technical framework had outlined. The failure to reclaim $2,450 was not a minor pullback or temporary consolidation, but rather a rejection with directional significance. Once the market moved away from resistance without confirmation, the path of least resistance shifted toward lower levels.
Subsequent price action reinforced this weakness, with Ethereum showing insufficient volume to mount another convincing test of the barrier.
The correlation to Bitcoin proved immediately relevant. Because Ethereum failed to confirm strength, the broader market structure appeared compromised. This weakness was used to frame a short trade idea on Bitcoin around $82,300, based on the expectation that both assets would move lower together given their synchronized technical setup.
The rejection suggested that the entire complex remained vulnerable to selling pressure, particularly from traders exiting bullish positions after the failed breakout attempt.
Distribution Phase Indicates Institutional Selling Pressure Remains Unresolved
Ethereum’s current technical posture shows the market in a distribution phase below resistance, characterized by inadequate volume for a genuine breakout. Distribution phases typically reflect accumulation of selling pressure by informed participants, often during periods when retail interest appears peaked but conviction remains low.
This positioning suggests that Ethereum could face further pullbacks as long as the market remains unable to generate sufficient buying power to reclaim $2,450 decisively.
The volume structure is key to understanding why repeated tests of resistance have failed. A genuine breakout above $2,450 would require not merely price touching that level, but sustained buying interest demonstrated through volume confirmation.
The current picture shows price reaching the zone but lacking the volume signature that would indicate institutional accumulation or conviction among large holders. Instead, the evidence points toward distribution, where selling pressure from longer-term holders meeting fresh buying interest creates the appearance of resistance without a true breakout.
From an institutional perspective, this technical framework carries real trading implications. Until Ethereum decisively reclaims $2,450 with volume confirmation, the market structure remains vulnerable to sharp reversals. Traders who entered bullish positions expecting a breakout face increasing pressure to exit, particularly if the asset begins moving lower with conviction.
The repeated rejection creates a trap dynamic: bulls who bought near resistance expecting confirmation are now underwater, and their eventual liquidation or forced exit would accelerate downside momentum.
Institutional crypto investors should monitor whether Ethereum generates a convincing retest and reclaim of $2,450 in the coming trading sessions, paying particular attention to volume confirmation during any attempt.
If the market approaches this level again without producing sustained buying pressure and decisive wick above it, the failure would likely trigger accelerated downside toward lower support zones, with correlated weakness expected on Bitcoin near $81,000 based on the synchronized technical setup between the two assets.
Ethereum Weakness Signals Broader Institutional Deleveraging Cycle
The repeated rejection at $2,450 coincides with a measurable contraction in crypto derivatives positions, suggesting institutional traders are reducing leverage rather than accumulating exposure at current price levels.
Open interest in Ethereum perpetual futures has declined approximately 12 percent over the past three weeks, compared to a 3 percent average decline during the same period in the prior quarter, indicating accelerated position unwinding among professional traders.
This deleveraging pattern typically precedes either a capitulation-style washout or a prolonged consolidation phase, depending on whether macro liquidity conditions tighten further. Historical precedent from March 2023 and June 2022 showed similar open interest contractions before extended sideways trading, during which spot accumulation by long-term holders eventually stabilized the asset class.
The absence of panic-driven selling volume at current price levels suggests this current cycle more closely resembles the 2023 pattern, in which institutional repositioning took weeks rather than days to resolve.
The next confirmation point emerges if open interest stabilizes above the 18-month average around $8.2 billion in Ethereum perpetual markets; failure to hold that floor through the end of this quarter would signal continued deleveraging pressure and potentially force Ethereum toward the $2,100 support level that has not been tested since September.