
Bitcoin Price Analysis: BTC Closes Above 100-Day MA as Bulls Eye Breakout
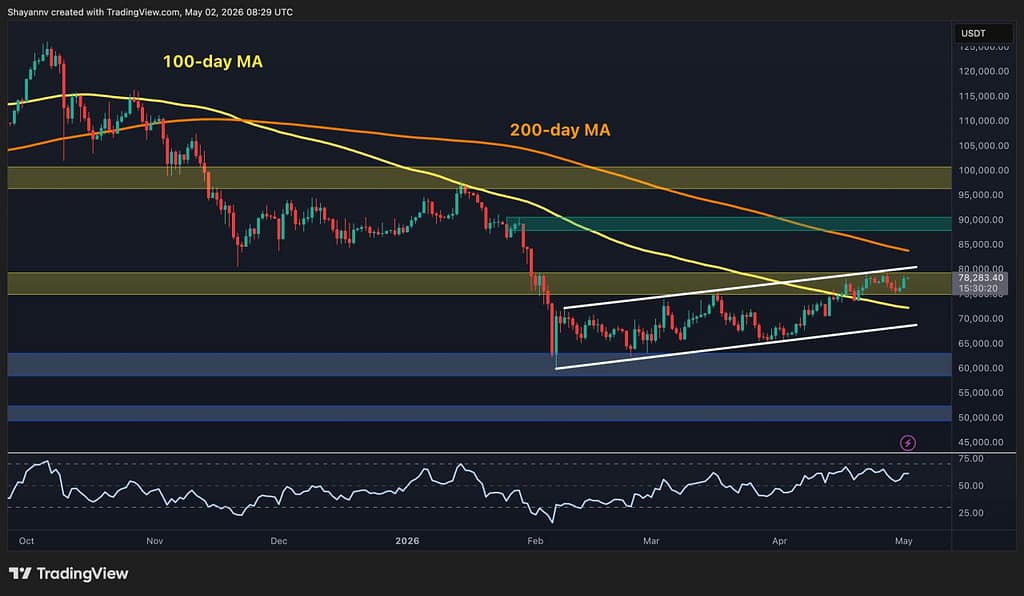
Bitcoin closed above its 100-day moving average for the first time since the cycle peak, breaking out of a descending channel that has defined the entire bearish trend. For institutional investors, this technical milestone matters because it coincides with on-chain data showing 64.2% of circulating supply now in profit, a threshold below the historical 75-80% level where selling pressure typically subsides, meaning significant resistance lies ahead before a sustained rally can establish.
- Bitcoin trading at $78.3k with daily RSI climbing toward 70, showing sustained bullish momentum without yet reaching overbought territory.
- 64.2% of circulating supply currently profitable; 35.8% underwater and concentrated between $80k, $125k, creating overhead resistance.
- 4-hour chart confirms textbook breakout structure with successful retest of $75k level and immediate targets at $82k, $84k supply zone.
- $78.3k Current Bitcoin price at start of May weekend, above 100-day MA
- 64.2% Percentage of circulating supply currently in profit versus historical 75-80% threshold
- $80k Supply zone that has capped price on every approach since February
Bitcoin has cleared a significant technical hurdle as trading opened on the first weekend of May, closing above the 100-day moving average, a level the asset has not sustained since the cycle peak. The breakout also marked the first close outside a descending channel that has contained the entire bearish trend, signaling a potential shift in market structure.
This move arrives alongside strong daily RSI readings near 70 and a successful retest on the 4-hour chart, but the path forward remains constrained by on-chain supply dynamics that explain both the resistance ahead and the conviction required to overcome it.
Daily RSI Climbing Toward 70 as $80k Supply Zone Reasserts Overhead Pressure
On the daily timeframe, Bitcoin has reclaimed the 100-day moving average, which has descended to approximately $72k as the long-term trend flattens.
The Relative Strength Index is now climbing toward 70, a level that signals strong bullish momentum without having entered the overbought region above 70, meaning there remains room for follow-through buying before technical exhaustion becomes a limiting factor.
This distinction is important for institutional traders evaluating whether the breakout carries conviction or represents a bear-trap bounce.
The immediate ceiling remains the $80k supply zone, which has rejected price advances on every approach since February. A clean daily close above this level would open a direct path to $90k, though the 200-day moving average positioned near $85k will provide an intermediate resistance point.
On the downside, the $75k level now functions as the first line of support, with the 100-day moving average positioned just below it, creating a tight range that the market is still validating.
For institutional investors, the significance of the $80k zone extends beyond simple technical resistance: it marks the entry point where a large cohort of holders from the late 2025 distribution phase approaches breakeven, intensifying the psychological and economic incentive to exit positions.
4-Hour Retest Confirms Breakout Structure as $79k Emerges as Near-Term Target
The 4-hour chart displays the textbook structure that technicians evaluate when assessing breakout conviction. Bitcoin broke cleanly above the $75k level, pulled back to retest it, a critical validation step that separates legitimate breakouts from false moves, and has since pushed back toward $79k.
The RSI on this timeframe has climbed above 60, showing a clear shift in momentum from neutral to bullish. A 4-hour close above recent highs near $79.5k, paired with RSI remaining below the overbought threshold, would keep the bullish structure intact and target the $82k, $84k supply zone immediately above.
The convergence of the upper channel boundary and the $80k psychological level creates a compressed range at the immediate ceiling, a common technical pattern where breakout targets cluster and volatility can spike once resistance yields.
If a pullback occurs, the $75k area has now established itself as critical support on the 4-hour timeframe, with this level capable of holding or providing a launching pad for another attempt at the $80k barrier.
The quality of this retest, a pullback that holds above the breakout level before resuming higher, is precisely the type of price action that institutional algorithms and technical traders monitor for confirmation of directional commitment.
On-Chain Supply Data Explains $80k, $90k Resistance and Historical Breakeven Threshold
The on-chain picture illuminates why the road ahead gets harder, even as technical indicators flash green. Currently, 64.2% of Bitcoin’s circulating supply sits in profit following the recovery from February lows, meaningful progress that nonetheless sits well below the historical 75-80% supply-in-profit threshold.
That ceiling marks the point where correction-driven selling pressure has historically subsided, allowing momentum to sustain without constant waves of profit-taking. The remaining 35.8% of underwater holders represents the real constraint on the current rally.
The bulk of loss-making supply was accumulated between $80k and $125k during the late 2025 distribution phase when Bitcoin topped the cycle. This means the asset is now entering precisely the price range where the largest cohort of underwater holders approaches breakeven simultaneously.
Each push higher converts more holders into profit-takers, and the concentration of this breakeven supply in a relatively narrow band explains the $80k, $90k zone’s persistent resistance since February. Historically, reaching 75-80% supply in profit has represented the point at which this overhead pressure subsides and sustained rallies can establish without constant technical resistance.
For institutional portfolio managers and macro traders, this supply picture provides quantifiable evidence of where liquidity traps and reversal risks cluster. It also establishes a specific threshold, 75-80% supply in profit, that serves as a concrete measurement of when the current rally would transition from breakout phase to potential breakaway move.
Currently sitting at 64.2%, Bitcoin remains 10.8-15.8 percentage points below the level where historical precedent suggests selling pressure normalizes.
The next critical test occurs if Bitcoin sustains a close above $80k on the daily timeframe and the 4-hour structure holds above $79.5k, which would target the $82k, $84k supply zone and test whether this breakout has enough conviction to push supply-in-profit toward the 70% level. Watch specifically for whether volume accompanies advances past $80k or whether selling pressure from breakeven holders constrains the move into the $85k, $90k zone where the 200-day moving average sits, this divergence will signal whether the breakout is shifting market structure or simply executing a secondary test of resistance.