Bitcoin’s bear market is entering its final phase and could bottom out around the 2026 FIFA World Cup, which runs from June 11 to July 19, according to a June 12 report from BIT Research.
Its main thesis is that a mix of technical patterns, weak market sentiment, and easing inflation pressure could set the stage for the next big BTC recovery after months of decline.
World Cup Window Could Be a Potential Market Bottom
According to BIT, Bitcoin has been following an A-B-C structure since the bear market started in October 2025. Wave A saw the cryptocurrency drop into the $60,000 to $69,000 range. It was then carried up toward the $80,000 to $90,000 zone by Wave B and topped out near $83,000 in the middle of May before it faded.
Now, according to the crypto research firm, the market has entered the final Wave C correction, and its target zone for a possible bottom is between $50,000 and $55,000, with the FIFA World Cup period the most likely timeframe for that low to form.
On the sentiment side, the report noted that the Greed & Fear Index has gone back to what it called historically depressed levels, something it says matches up closely with where things stood at the 2022 bottom.
In addition, the BIT analysts pointed out that the stochastic indicator has also dropped into deeply oversold territory and that Bitcoin is currently trading at least two standard deviations below its weekly moving average.
They also marked the $61,576 level as one that could potentially offer support and highlighted Bitcoin’s Realized Price, currently at around $54,591, as a key reference for where the asset becomes undervalued.
“History suggests that while prices may briefly dip below this level, they rarely remain there for long,” the report noted.
However, the macro piece of the puzzle is inflation, and BIT directly compared the current environment with that of 2022, when cooling inflation helped to mark the cycle low. According to the firm, something similar could be needed this time around too.
Where Bitcoin Is Right Now
The world’s largest cryptocurrency by market cap has had a rough few weeks. After getting rejected near $73,000 at the start of June, it fell through $70,000, then $65,000, and eventually broke below the long-held $60,000 support.
That drop bottomed out just above $59,000 last Friday, marking Bitcoin’s lowest point in nearly 2 years, before it recovered to around $63,000. At the time of writing, the asset had dipped back below $63,000, and was down over 22% across 30 days and almost 42% off its price from one year ago.
Much of that volatility has been down to geopolitics, with the ongoing conflict between the United States and Iran forcing the cryptocurrency to seesaw with every piece of news about an attack, a retaliation, or the announcement of a potential peace deal.
For now, BIT’s researchers believe the market may still need one to three months before a confirmed reversal appears. But they maintain that the first whistle at Mexico’s Estadio Azteca to start the 2026 World Cup may have also kicked off the current cycle’s final chapter.
XRP has entered one of its most uncomfortable technical zones in months. The cryptocurrency has now broken below a support base that had held since February, but the selloff has not yet turned into a collapse below $1.
Instead, the daily chart shows the XRP price landing on a much older descending channel support that has guided it lower since August 2025. That leaves the cryptocurrency in a difficult position that shows the breakdown is real, but so is the possibility that the latest liquidation has simply carried XRP into a deeper support line that still gives bulls a chance.
XRP Breaks February Support, But Finds A Lower Channel Floor
Technical analysis of the daily XRP chart shows a clear loss of the straight support range that had held the market together since February. For months, XRP moved mostly sideways between $1.25 and $1.55, with buyers repeatedly stepping in each time the price returned to the lower boundary.
That structure finally gave way in early June, and XRP fell within the range with a daily candle that pushed the price into $1.10. This move was accompanied by various on-chain signals dropping to bear levels and the XRP profit/loss ratio falling to its lowest levels since 2024.
However, an interesting part of the price action is where the selloff stopped. XRP seems to have found support on the lower line of a broader descending channel that has been active since August 2025. This larger channel has contained nearly every major XRP move for months, and the latest liquidation wick landed almost exactly where buyers needed it to land to keep that bigger structure alive.
Bulls Still Have A Chance
According to crypto analyst Guy on the Earth, XRP finding support at this descending channel could be something or it could be nothing. In order for this move to mean something, the first level that matters is $1.10. A loss of $1.10 would weaken the channel-support argument. Therefore, the XRP price needs to hold above $1.10. So far, bulls are doing well to that effect, with XRP currently trading at $1.12 and an intraday high of $1.17.
The next upside level to watch is $1.27. That price level is important because it was close to the lower boundary of the February to May range before the breakdown. Former support often becomes resistance once price loses it, and a return to $1.27 would therefore be the first real test of whether XRP is only bouncing from oversold conditions or beginning to repair the damage from the breakdown.
Crypto analyst Guy on the Earth believes XRP could soon put traders in a difficult position with a quick move toward $1.96, suggesting that the next major rally may arrive with explosive force after months of persistent downside.
Bitcoin’s latest upward move has sparked debate among market participants, and some believe the rally may have little to do with the purchase announcement that received the most attention. While the acquisition is generally viewed as constructive for the broader market, it is not necessarily the type of development that would justify a significant upward move in Bitcoin price.
Why The Latest Purchase May Not Be Driving Bitcoin Rally
The Bitcoin’s recent move higher is being misinterpreted as a direct reaction to purchase news, when in reality the drivers appear to be more technical in nature. Crypto analyst Aylo has explained on X that the BTC bounce is likely the result of an oversold market finding relief after sweeping key February lows.
Another factor supporting the move higher is the easing of concerns surrounding Strategy and its Bitcoin holdings. The company’s recent sale of a relatively small 32 BTC sparked fears that it could become a larger seller in the future.
Aylo suggests that while the current low may hold in the near term, it remains plausible that BTC could form a slightly lower low in June before a rally, particularly if the broader equity markets experience further weakness. Any deeper stock market shakeout could temporarily drag the price lower before a more sustained recovery begins. This level will be temporary before Bitcoin sees a low later in the year.
Furthermore, the fear that Michael Saylor and Strategy may be forced to liquidate a significant portion of their BTC holdings is likely overstated. The company may need to sell limited amounts to meet specific obligations, but the narrative that a major liquidation event from their supply will be driven more by bearish sentiment.
What The Recent Breakdown Could Mean For The Market
Bitcoin’s recent price action appears to be following a market structure that has played out before during previous corrective phases. A crypto trader known as Max Trades pointed out that roughly a month ago, BTC was entering a distribution phase of this pattern, and the outlook has since played out with notable accuracy.
In this bear market, BTC first formed an accumulation range, where price consolidated before breaking higher and sweeping out the liquidity above the previous highs. However, instead of continuing its upward trajectory, the asset price has transitioned into distribution. Since then, BTC has experienced a significant decline, falling more than 20% from its previous highs.
According to Max Trades, what makes the current setup particularly noteworthy is the comparison to a previous distribution phase that ultimately resulted in substantially deeper downside after the initial breakdown. If the current structure continues to mirror that historical pattern, it could imply that the recent decline is not yet complete.
The average Sonic price prediction for 2026 is $0.03259.
Holders can anticipate a maximum price of $0.1574 in 2029.
By 2032, Sonic (S) might touch $0.2967
Sonic is a high-performance EVM Layer 1 blockchain built for DeFi applications, offering up to 400,000 TPS and sub-second finality. The network introduced its Fee Monetization (FeeM) program, allowing developers to earn up to 90% of the fees generated by their applications. Sonic also features a native Ethereum bridge called the Sonic Gateway, which includes a Fast-Lane transaction feature and a fail-safe security mechanism. For investors and traders following Sonic price prediction trends, these features are important because they support ecosystem growth, developer activity, and the chain’s long-term demand.
Sonic emerged from Fantom’s rebrand after Michael Kong announced the Sonic mainnet launch in March 2024. Fantom later fully transitioned to Sonic on January 16, 2025, as the project expanded through partnerships with Chainlink, Pyth Network, Alchemy, Dune, and Safe.
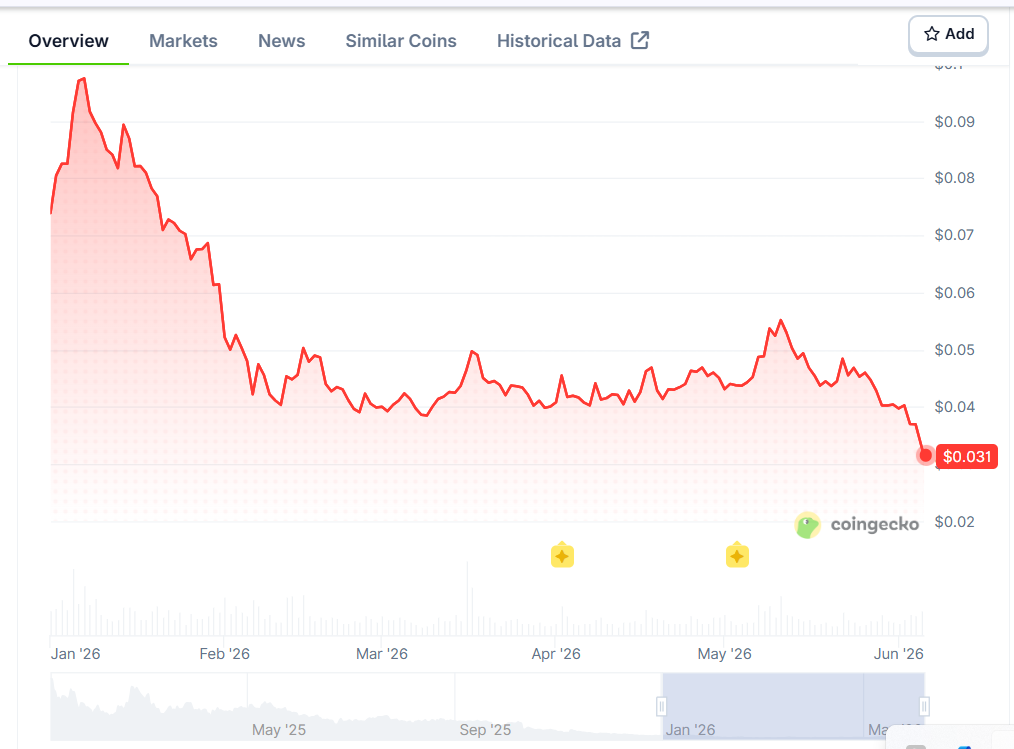
Sonic reached an all-time high of $1.03 in January 2025 before falling to a low of $0.0368 in February 2026. Investors’ questions remain. Will Sonic reclaim Fantom’s all-time high of $3.48? How high can Sonic (S) go in the coming years? Let’s take a look at Sonic’s price prediction and price prediction tool to answer these questions.
Sonic Price Prediction: An Overview
Cryptocurrency
Sonic
Token
S
Price
$0.02906
Market Cap
$83.71M
Trading Volume (24-hour)
$19.27M
Circulating Supply
2.88B S
All-time High
Jan 05, 2025 $1.03
All-time Low
Jun 05, 2026 $0.03036
24-h High
$0.040901
24-h Low
$0.040163
Sonic (S) price prediction: Technical analysis
Volatility
4.09% (Medium)
50-Day SMA
$ 0.04407
Price Prediction
$ 0.02376 (-25.50%)
14-Day RSI
37.59 (Neutral)
Green Days
11/30 (37%)
Sentiment
Bearish
Fear & Greed Index
12 (Extreme Fear)
200-Day SMA
$0.06032
Sonic price analysis S falls to a new all-time low as sellers stay in control
TL;DR Breakdown
Today’s Sonic price analysis shows strong bearish pressure as S falls to a fresh all-time low of $0.02768
Sonic’s current resistance is at $0.0321, while the immediate support remains at the all-time low of $0.0277
Today, Sonic is trading around $0.02924, down 6.32% in the last 24 hours
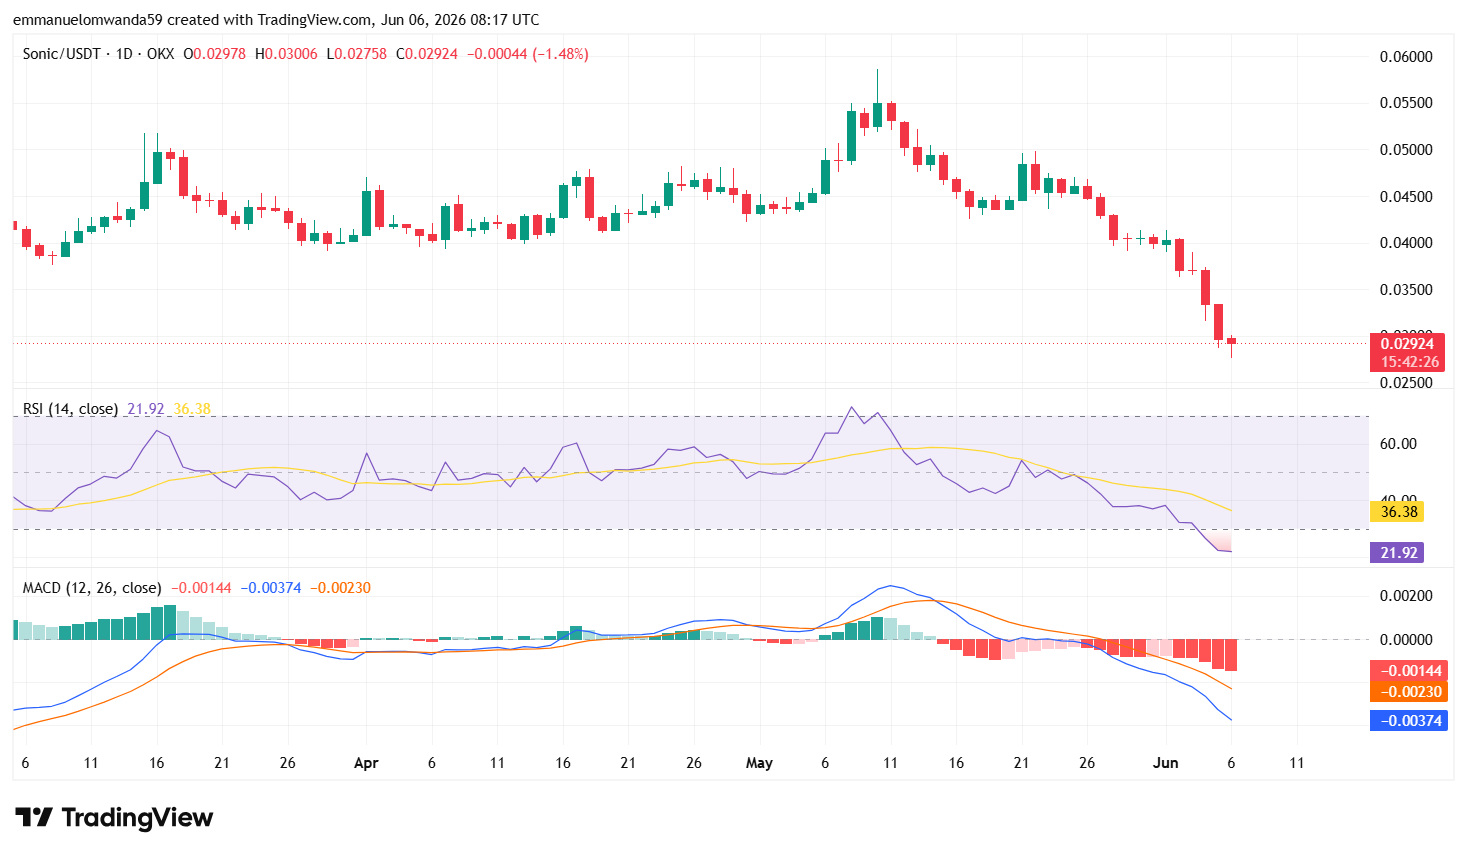
As of June 6, 2026, Sonic’s price analysis shows a bearish market structure. Sonic is currently trading at $0.02928, down 6.32% in the last 24 hours. Selling pressure increased today, driven by Sonic’s new all-time low price of $0.02768, underscoring the continued market dominance by bears. Although buyers managed to trigger a small recovery from the lows, it remains weak as the price continues to trade near historically depressed levels.
Sonic (S) price analysis 1-day chart
Analyzing the one-day chart for Sonic, it shows persistent selling pressure after the token recorded a fresh all-time low.S dropped to $0.02768, breaking below previous support levels and extending its broader downtrend that has been in place for several months.
The latest daily candle remains bearish despite a small recovery from the day’s low. The decline reflects weak market confidence, with sellers continuing to dominate price action. Sonic is now trading more than 97% below its all-time high of $1.03, showing the level of the long downtrend.
Trading activity has weakened over the past 24 hours, with volume falling by 26.14% to $18.93 million. The decline in volume suggests that market participation is cooling despite Sonic’s drop to a new all-time low, indicating limited buying interest at current levels.
S/USD Chart: TradingView
Technical indicators continue to favor sellers. The Relative Strength Index (RSI) has dropped to 21.9, placing Sonic deep in oversold territory. While such levels often precede temporary relief rallies, the indicator is yet to show any meaningful bullish divergence. The continued decline in RSI reflects strong bearish momentum and weak buying interest.
The MACD indicator remains negative as the MACD line trades below the signal line. Expanding red histogram bars suggest that downward momentum is still dominating the market despite today’s rebound from the all-time low. This setup indicates that sellers continue to control the broader trend.
Buyers need to reclaim the $0.0320 area before any meaningful short-term reversal can be considered. Until then, rallies may continue to attract selling pressure.
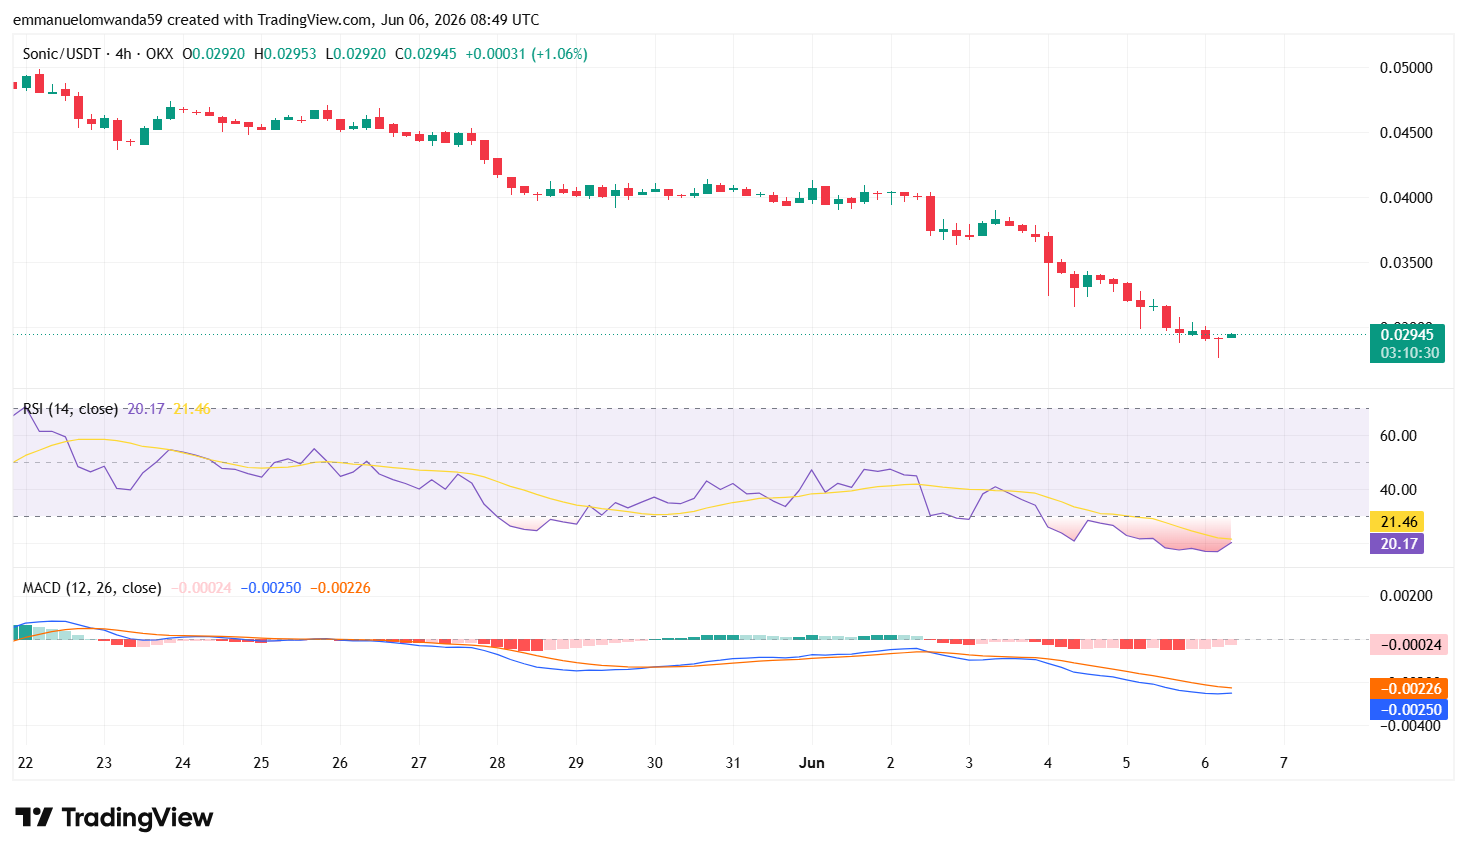
S’s technical analysis 4-hour chart
The 4-hour Sonic price chart shows bears still maintaining strong control of the market. Although the token has stabilized around the $0.0294 level, buying momentum remains weak as the broader trend continues to favor sellers.
The RSI on the 4-hour timeframe has dropped to 20.17, still in oversold territory. While this suggests selling pressure has become extreme, the indicator has yet to show a convincing recovery signal. The MACD indicator remains bearish.
S/USD Chart: TradingView
The MACD line continues to trade below the signal line, confirming that downward momentum is still dominant. However, the shrinking red histogram bars suggest that bearish momentum is beginning to slow, although buyers have not yet gained enough strength to reverse the trend.
The nearest resistance is at $0.0300, followed by a stronger barrier around $0.0320. On the downside, immediate support remains at the recently established all-time low of $0.02768. If bears force a break below this level, Sonic could face another low as price discovery continues.
Sonic technical indicators: Levels and action
Daily simple moving average (SMA)
Moving averages are calculated from the average closing price over a set period.
Period
Value
Action
SMA 3
$ 0.03570
SELL
SMA 5
$ 0.03739
SELL
SMA 10
$ 0.03926
SELL
SMA 21
$ 0.04228
SELL
SMA 50
$ 0.04407
SELL
SMA 100
$ 0.04316
SELL
SMA 200
$ 0.06032
SELL
By June 29, 2026, Sonic’s 200-day Simple Moving Average is projected to drop to $0.05181, while the 50-day SMA is estimated to reach $0.03714.
Daily exponential moving average (EMA)
Period
Value
Action
EMA 3
$ 0.03547
SELL
EMA 5
$ 0.03674
SELL
EMA 10
$ 0.03885
SELL
EMA 21
$ 0.04130
SELL
EMA 50
$ 0.04328
SELL
EMA 100
$ 0.04941
SELL
EMA 200
$ 0.08657
SELL
What can you expect from the Sonic price analysis next?
Sonic remains in a corrective trend, but Sonic’s price action is showing early signs of stabilization around the $0.0290 level, and many traders use candlestick charts to assess momentum. Each candlestick shows the opening, closing price, highest, and lowest prices for a chosen interval, helping analysts determine whether support is holding or a rebound may follow.
A successful defense of the $0.02768 support level could allow the token to recover toward $0.0300 and potentially $0.0320 in the coming sessions, according to Sonic key price levels and recent market activity. On the downside, a break below the all-time low of $0.02768 would likely expose Sonic to further weakness, with sellers attempting to establish new lower levels.
In a relatively small market, whales can control short-term moves. Until buyers reclaim the $0.0300–$0.0320 resistance zone, the overall market structure remains bearish despite oversold conditions appearing on technical indicators.
Why is Sonic down today?
Sonic (S) is trading around, down 12.44% over the last seven days, suggesting the broader trend remains bearish despite today’s modest recovery. With no major news catalyst driving recent price action, the decline appears to be due to typical altcoin volatility and profit-taking following earlier gains.
Is Sonic a good investment?
Sonic is a high-speed, scalable blockchain platform that competes with established chains such as Solana and Ethereum L2s, positioning itself as a performance-focused chain within the blockchain ecosystem. Despite its potential, investing in Sonic (S) involves risks typical of cryptocurrencies, including market volatility, so any current forecast should weigh whether it looks like a good buy right now.
While Sonic does not currently lead the market, it maintains a credible and stable position as a reliable, mid-tier chain. Sonic (S) network is also transitioning from a community-driven layer-1 to a more structured corporate model, which investors should factor in before they invest. Own research and assessing personal risk tolerance are essential for anyone considering S as a potential investment opportunity.
Will Sonic reach $5?
The price of Sonic could reach $0.1215 by 2030, with price predictions suggesting a high of $0.1678. The base case scenario for Sonic’s price by 2030 is projected to be around $0.1215, with potential highs depending on market conditions. However, achieving this depends on market conditions, overall technical factors, and fundamental factors.
Will Sonic reach $10?
Based on our technical analysis of multiple technical quantitative indicators, S’s price projections for 2032 estimate a range, with Sonic expected to reach about $0.2967 but not approach double-digit prices within the next 6 years. A move to $10 is not guaranteed; even by 2046, Sonic is expected to reach $0.8797, still far below $10 and requiring over 25,386% upside to hit that mark.
Is Sonic a safe network?
Sonic is regarded as a secure blockchain platform whose architecture differs from traditional blockchains, using its unique Lachesis consensus mechanism to enable high-speed, scalable transactions.
Its directed acyclic graph approach helps deliver theoretical throughput of up to 10,000 transactions per second with finality in less than 500 milliseconds. However, as with any blockchain network, users should exercise caution, use official channels, and follow best security practices to protect their assets.
Does Sonic have a good, long-term future?
Sonic shows potential for a strong long-term future, with price predictions suggesting significant growth by 2030 and beyond. Analysts forecast prices could reach between $0.1215 and lowest prices at $0.1678, driven by its unique blockchain technology, increasing adoption in decentralized applications, and robust ecosystem growth.
Ecosystem growth, fueled by increased developer activity and more developers joining the platform, is crucial for Sonic’s long-term success. Total Value Locked (TVL) in dApps is a critical metric for long-term growth, reflecting real-world usage and platform strength. Sonic also continues airdrop campaigns and support for liquid staking tokens to help boost TVL and revenue generation.
Additionally, the Sonic ecosystem has established a $25 million fund to attract builders and improve user metrics, further supporting future expansion. Future ecosystem expansion may also benefit from plans to pursue a Spot ETF and private investment vehicles on Nasdaq, though the long-term impact remains uncertain. However, market volatility remains a concern.
Recent news/opinion on Sonic (prev. FTM)
Sonic recently expanded its ecosystem focus through infrastructure and security upgrades, including USDC integration support and new stablecoin functionality via Flying Tulip. The developments aim to strengthen Sonic’s position as a developer-friendly EVM chain while improving on-chain utility and security, even as the token continues facing bearish pressure in the broader crypto market.
Sonic recently highlighted the growing adoption of its vertical integration model. The network revealed that its USSD stablecoin is generating approximately $80,000 in annualized real-world asset (RWA) yield without incentives, while Shadow’s AutoVault has already purchased around 350,000 S tokens through market activity.
Vertical integration on Sonic is moving from concept to data.
With zero incentives, $USSD is at ~$80K annualized RWA yield, while @ShadowOnSonic‘s AutoVault has already bought ~350K $S from market activity.
The Sonic price prediction for June 2026 suggests a modest recovery from current levels, with the price expected to range between $0.02881 and $0.03259. The average price is projected to be around $0.03259, as market sentiment, trading volume, and broader crypto market conditions continue to influence short-term price action.
Period
Potential Low ($)
Average Price ($)
Potential High ($)
Sonic (S) price prediction June 2026
$0.02881
$0.03259
$0.03259
Sonic price prediction 2026
In 2026, Sonic (S) is expected to trade between $0.02750 and $0.03789, with an average price of around $0.03270. This suggests relatively stable price action throughout the year, with modest upside potential if ecosystem growth and market sentiment improve.
Period
Potential Low ($)
Average Price ($)
Potential High ($)
Sonic Price Prediction 2026
$0.02750
$0.03270
$0.03789
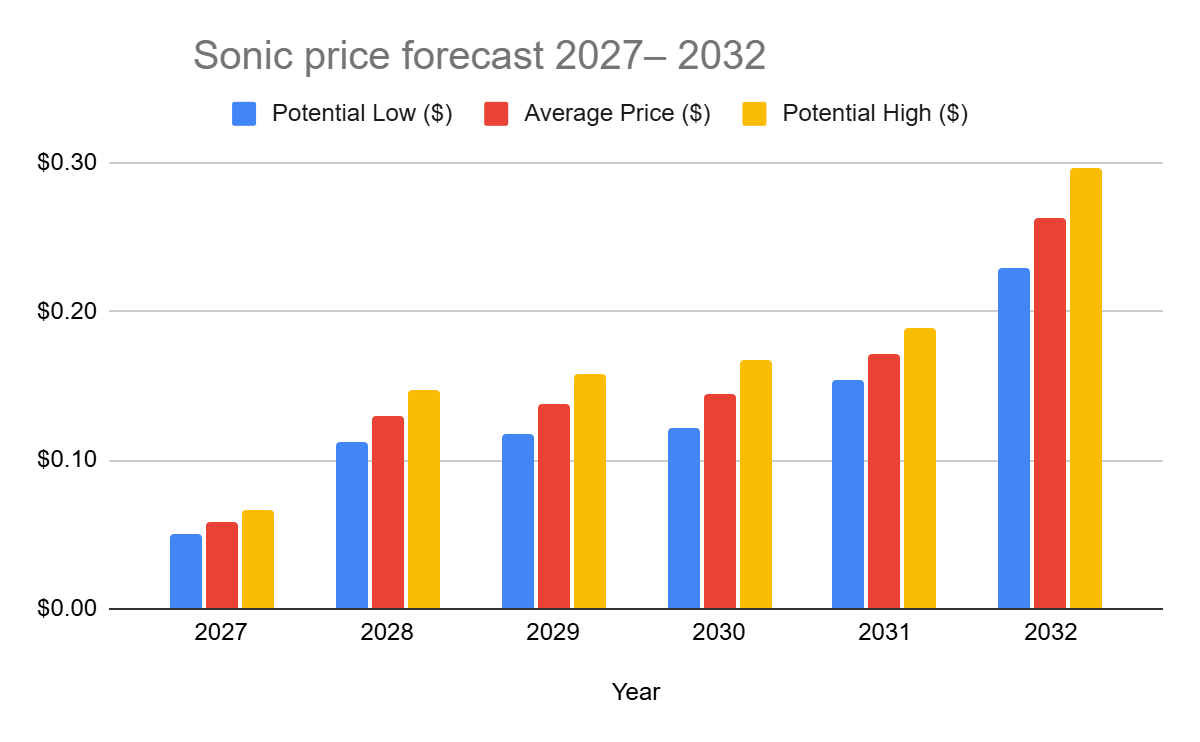
Sonic price forecast 2027– 2032
price prediction chart
Year
Potential Low ($)
Average Price ($)
Potential High ($)
2027
$0.0499
$0.0581
$0.0662
2028
$0.1128
$0.1296
$0.1465
2029
$0.1169
$0.1372
$0.1574
2030
$0.1215
$0.1446
$0.1678
2031
$0.1545
$0.1717
$0.1889
2032
$0.2285
$0.2626
$0.2967
Sonic (S) price prediction 2027
The Sonic forecast for 2027 speculates that the price might reach a maximum of $0.0662 by 2027. On the lower end, corrections may pull the price to $0.0499 with an expected average trading price of around $0.0581. As an alternate modeled scenario, the predicted price for 2027 could be around $0.03998, representing a potential 1.90% increase.
Sonic (S) price prediction 2028
Sonic’s (prev. FTM) 2028 forecast of $0.1128–$0.1465, averaging $0.1296, is linked to growing adoption of its rebranded ecosystem. By then, expanded DeFi, NFT, and gaming use cases are expected to strengthen utility and demand. The projected rise in Sonic’s price by 2028 is supported by its Fee Monetization model and the fee burning mechanism, which incentivize developer activity and reduce token supply. Network scalability upgrades and rising developer engagement support gradual appreciation, while market cycles keep growth within range.
Sonic (S) price prediction 2029
In 2029, Sonic’s market price might stabilize at $0.3238 while attaining an average trading price of around $0.2698, and a minimum price of around $0.2158. The broader outlook points to $0.03250 by the end of 2026, $0.1464 by 2030, and $0.2327 by 2040, based on combined technical and fundamental factors.
Sonic (S) price prediction 2030
Sonic is expected to reach a maximum of $0.1678 by 2030. However, it could fall to $0.1215 with an average price of $0.1446.
Sonic (S) price prediction 2031
Sonic is projected to hit a high of $0.1889 in 2031. In the event of a price correction, it could drop to $0.1545 with an average of $0.1717
Sonic (S) price prediction 2032
Sonic is expected to reach a high of $0.2967 in 2032. The average trading price is expected to be $0.2626, and the minimum price is projected to be $0.2285.
Sonic price prediction 2026-2032
Sonic market price prediction: Analysts’ FTM price forecast
Firm Name
2026
2027
Coincodex
$ 0.02589
$ 0.06573
DigitalCoinPrice
$ 0.03189
$0.0817
It’s important to note that these analyst forecasts may be influenced by broader market rallies and shifts in market sentiment, which can drive Sonic’s price targets higher or lower depending on overall investor optimism or pessimism.
Cryptopolitan’s Sonic (S) price prediction
Our predictions show that the Sonic token could achieve a minimum value of $0.02750 in 2026. The Sonic price may reach a maximum value of $0.03789, with an average trading price of $0.03270 throughout 2026. Investor confidence, along with supply and demand dynamics, plays a key role in Sonic’s price action.
Fundamental events such as hacks and other real-world occurrences can significantly impact price movements. Please note that the content provided on this page is for informational purposes only and does not constitute investment advice. Conduct your own research before making financial decisions
Sonic’s (S) historic price sentiment
Sonic price history
Fantom (FTM) launched in 2018 at $0.0182, hit a low of $0.00229 in 2020, and peaked at $3.24 in 2021 during the DeFi boom.
Following the 2022 bear market, FTM recovered to $0.55 by early 2024 before rebranding to Sonic Labs in August 2024.
The 1:1 FTM-to-Sonic (S) token swap began in December 2024, with Binance completing it by January 2025.
Sonic hit a new ATH of $1.029 in January 2025, but steadily declined to around $0.33 by late August.
By early September 2025, Sonic traded stably between $0.3092 and $0.3126.
Early September, Sonic traded around $0.309–$0.313, showing relative stability compared to its August lows.
Mid-September – Price remained in the ~$0.30–$0.33 band, with minor upward drift toward ~$0.32.
Late September – The token approached $0.26, as reported by markets, showing a decline and increased volatility.
Early October – Trading price dropped further into the ~$0.23–$0.26 range, indicating a weakening trend.
By November 3, Sonic had fallen to approximately $0.122, marking a substantial decline from early September levels.
At the beginning of November 2025, Sonic (S) traded around $0.12–$0.14, occasionally spiking to roughly $0.17 before retreating.
Through mid-November, the price generally drifted downward, reaching a low near $0.10–$0.11 around November 21.
From late November to December 3, S recovered slightly — trading in a narrow band around $0.10–$0.11, suggesting consolidation and stabilization after the mid-month slump.
From early December, Sonic traded around $0.071–$0.075 on Dec 3–Dec 6, then moved higher through mid-December as the price climbed into the $0.085–$0.095 zone by Dec 14–Dec 17, reflecting increasing buying interest late in the year.
Into late December and early January, S stabilized in the $0.07–$0.08 range before rising above $0.08, closing around $0.082–$0.086 by Jan 4 2026, showing a modest recovery into the new year.
On January 4, 2026, Sonic was trading near $0.086–$0.090 after stabilizing from December weakness, with modest rebounds in the first week of January as buyers emerged off key support levels.
By February 3, 2026, Sonic had drifted lower toward roughly $0.065–$0.070, reflecting continued selling pressure and failed rallies, with price consolidating near the low end of its recent range.
Sonic (S) traded around $0.052 to $0.048 between Feb 3 and Feb 10, 2026, before declining toward the $0.041 to $0.039 range by late February amid steady selling pressure.
From early March to Mar 14, 2026, Sonic moved between $0.038 and $0.044 with a gradual rebound attempt as the price stabilized near the $0.040 support zone.
From March 14 to late March, Sonic drifted lower from $0.0514 toward $0.040–$0.042, unable to sustain any meaningful bounces amid broad market weakness.
By April 7, its price pressed critical $0.040 support at $0.0396–$0.0414 — dangerously close to its all-time low of $0.0368 set on February 28.
Sonic is trading at around $0.04951 at the start of May 2026.
By the end of May 2026, Sonic had retreated to around $0.040, erasing much of its early-May gains after a failed rally above $0.055 and stabilizing near a key support zone amid continued selling pressure.
At the start of June 2026, Sonic traded around $0.03136, extending its decline after losing the key $0.040 support level in late May.
Uniswap (UNI) might reach as high as $3.51 in 2026.
Estimates for Uniswap’s average price in 2028 range from $5.10 to $5.87.
UNI’s average price in 2032 will be $11.64, with a maximum price of $12.4.
Uniswap, a DeFi protocol founded in 2018 by former mechanical engineer Hayden Adams. The Uniswap exchange is a 100% on-chain automated market maker (AMM) protocol on the Ethereum blockchain. The AMM allows DeFi users to swap ether (ETH) for any ERC-20 token without intermediaries, solving many liquidity problems most exchanges face. Uniswap’s unique features and utility make its governance token, UNI, attractive to traders and investors.
Will UNI reach $100? How high can UNI go in five years? Let’s take a look at Uniswap’s technical analysis and price prediction to provide answers to these queries.
Overview
Cryptocurrency
Uniswap
Abbreviation
UNI
Current Price
$2.43 (-0.95%)
Market Cap
$1.51B
Trading Volume (24-hour)
$140.38M
Circulating Supply
622.67M UNI
All-time High
$44.97 May 03, 2021
All-time Low
$1.03 Sep 17, 2020
24-hour High
$2.49
24-hour Low
$2.33
Uniswap price prediction: Technical analysis
Metric
Value
Price Prediction
$2.20 (-7.77%)
Fear & Greed Index
12 (Extreme Fear)
Market Sentiment
Bearish
Volatility
10.61%
Green Days
9/30 (30%)
50-Day SMA
$3.32
200-Day SMA
$4.26
14-Day RSI
21.10
Uniswap price analysis: UNI price plunges toward $2.43
TL;DR Breakdown:
Uniswap price analysis shows a downward trend toward $2.43.
The altcoin market is correcting today and UNI token has remained down 0.95% for the past 24 hours.
UNI coin has support around the $2.28 level.
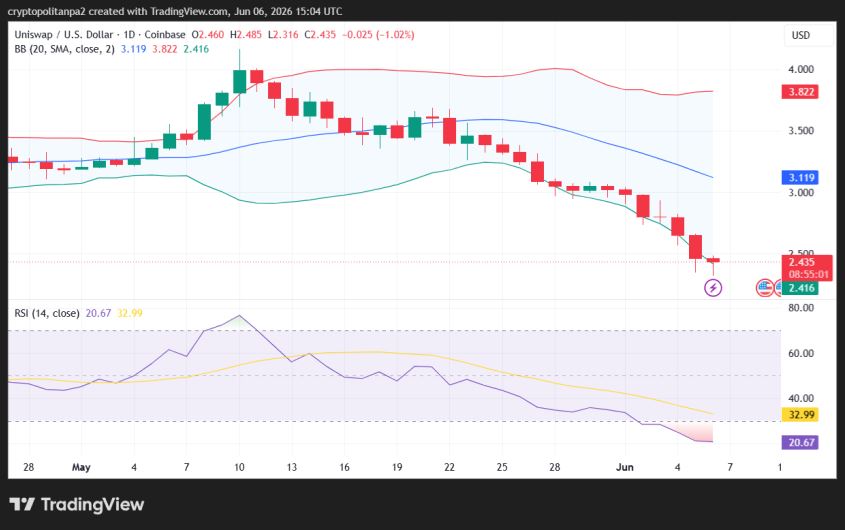
On June 6, 2026, Uniswap (UNI) price analysis reveals a bearish daily trend. The altcoin’s price decreased to $2.43, reporting an 0.95% loss over the past 24 hours. From a macro perspective, the token is facing overhead selling pressure even around local lows, which aligns with a larger bearish structure. No support from the buyers’ side has been observed yet, but immediate support for UNI is present at $2.28.
Uniswap price analysis on the daily time frame
The one-day price chart for Uniswap confirms a downward trend in the market. The UNI/USD pair is hovering near the $2.43 level as the selling pressure resurges. The bearish push has significantly decreased the price, as red candlesticks on the chart signify the intraday selling momentum.
The distance between the Bollinger Bands highlights the intensity of volatility. This distance is considerable, leading to high volatility. Moreover, the upper limit of the Bollinger Bands indicator, indicating resistance, has shifted to $3.82, whereby its lower limit, indicating a broken support, has moved to $2.41.
While many view it as a simple momentum gauge, the RSI acts as a critical price prediction tool when identifying bullish/bearish divergences that precede a trend reversal. The Relative Strength Index (RSI) is trending in the oversold region. The indicator’s value was recorded at 20 today. The downward curve on the RSI signifies a bearish trend, and more instability can be expected if the selling momentum intensifies and the indicator’s score decreases further. However, the indicator can give a buy call any time, as the token is already undervalued.
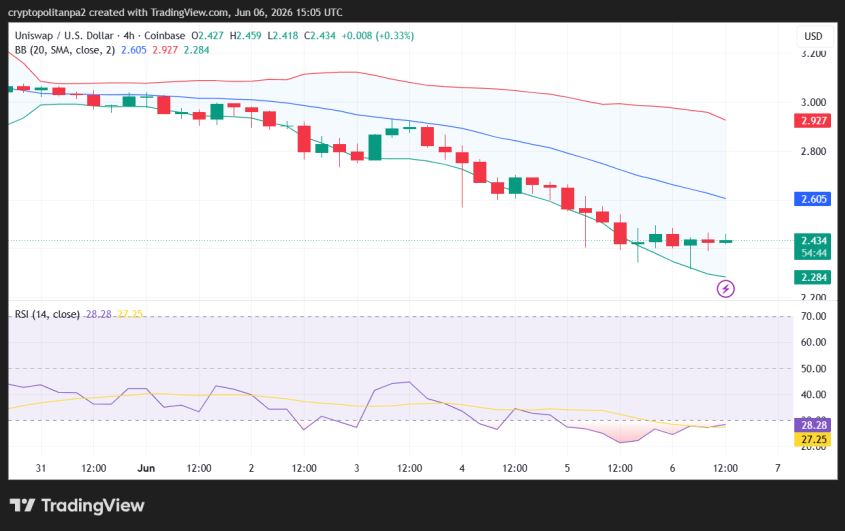
Uniswap price analysis on the 4-hour chart
The four-hour technical analysis of Uniswap shows that the price slippage has stopped, and it is now sustaining above the support of $2.28. This is evidenced by its price hovering near $2.43 over the past four hours. UNI may decrease further in the coming hours if traders continue selling more, as the likelihood remains high. Moreover, high volatility signifies a higher chance of a reversal or further price depreciation.
The Bollinger Bands are covering more area, leading to increased volatility levels. This high volatility signals greater market unpredictability. The upper Bollinger Band has shifted to $2.92, indicating the resistance point. Conversely, the lower Bollinger Band has moved to $2.28, establishing the support point.
The Relative Strength Index (RSI) indicator’s value has slightly increased to 28 over the past few hours, with its curve pointing upwards, as the indicator is still trending in the oversold region. This condition suggests an imbalanced trading setup on the four-hour chart. However, further depreciation in the coin’s value is possible only if sellers keep crushing support zones in the next few hours.
Uniswap technical indicators: Levels and action
Daily simple moving average
Period
Value ($)
Action
SMA 3
2.63
SELL
SMA 5
2.73
SELL
SMA 10
2.88
SELL
SMA 21
3.18
SELL
SMA 50
3.32
SELL
SMA 100
3.44
SELL
SMA 200
4.26
SELL
Daily exponential moving average
Period
Value ($)
Action
EMA 3
2.60
SELL
EMA 5
2.69
SELL
EMA 10
2.86
SELL
EMA 21
3.08
SELL
EMA 50
3.27
SELL
EMA 100
3.55
SELL
EMA 200
4.28
SELL
What to expect from Uniswap price analysis next?
Uniswap price analysis suggests a bearish outlook for current market trends. The coin’s price is decreasing in the current session, as the coin shows 0.95% losses over the past 24 hours, following a bearish streak. If sellers maintain their momentum, UNI’s price could decrease toward the $2.3 range.
Is Uniswap a good investment?
Uniswap is a decentralized cryptocurrency exchange (DEX) with massive potential. Unlike traditional exchanges, Uniswap uses an automated market-matching (AMM) system. Uniswap has shown good performance over time and is expected to reach the $4.77 level by 2027 and above $12.4 by 2032.
Why is UNI down?
The broader crypto market is experiencing negative market sentiment today. Most of the top cryptocurrencies are shedding value, and so is the Uniswap token.
How much will Uniswap be worth in 2026?
The maximum UNI can reach in 2026 is $3.51, while the average price is expected to be around $2.56.
Will UNI reach $10?
Uniswap is trading just above the $2 range, down from $18.59, which it achieved in December last year. The current resistance levels are $3.16 and $3.82; a break above them can lead to $11. If UNI gets more support, $10 can be achieved by the year 2031.
Will UNI reach $50?
In May 2021, UNI touched $44.9, its all-time high, which is not much below $50. This possibility can arise again if the broader cryptocurrency market turns bullish on political and economic factors. However, this is not investment advice, and one should seek independent professional consultation before making any investment decision.
Can Uniswap reach $100 dollars?
According to the Uniswap price prediction, UNI is not expected to reach near $100 after 2032. Though this is a five-year time frame, it’s worth waiting, as the coin’s value will increase but may not reach $100.
Does UNI have a good long-term Future?
UNI is the token of the famous Uniswap decentralized exchange. It has a wide user base and good liquidity, so the coin has good prospects. Market analysts expect UNI’s price to reach $12.4 by the end of 2032, substantially higher than its current price.
Recent news/opinions on Uniswap Network
Uniswap Labs announced that an in-app wallet is now live on the Uniswap web app. Users can now sign up for a new account with TouchID, FaceID, or a passkey without any password or seed phrase.
In-App Wallet is now live on Uniswap Web App
Spin up a new account in seconds with FaceID, TouchID, or a passkey
For June 2026, UNI shows an ability to swing wildly; the anticipated minimum value of Uniswap is $2.01. The price may jump to $3.12, but the average trading price of $2.45 is expected throughout the month.
Month
Potential Low ($)
Average Price ($)
Potential High ($)
June 2026
$2.01
$2.45
$3.12
Uniswap price prediction 2026
For 2026, UNI’s price might reach a maximum of $3.51. The minimum price is expected to be $1.91, with the year’s average trading price estimated at around $2.56.
Year
Potential Low ($)
Average Price ($)
Potential High ($)
2026
$1.91
$2.56
$3.51
Uniswap price predictions for 2027-2032
Year
Potential Low
Average Price
Potential High
2027
$3.87
$4.12
$4.77
2028
$5.10
$5.46
$5.87
2029
$6.34
$6.89
$7.38
2030
$7.96
$8.61
$9.30
2031
$9.55
$9.85
$10.70
2032
$11.14
$11.64
$12.4
UNI price prediction 2027
For 2027, Uniswap’s price is projected to have a minimum value of $3.87. The price could soar up to $4.77, with an average of $4.12.
Uniswap (UNI) price prediction 2028
In 2028, the price of UNI is anticipated to hit a minimum of $5.10. The maximum price might reach $5.87, with an average trading value of $5.46.
Uniswap price prediction 2029
The 2029 forecast for Uniswap predicts a minimum price of Uniswap to be $6.34 and a maximum of $7.38, with an average price of $6.89, many folds higher than the current Uniswap price.
Uniswap price forecast 2030
The Uniswap price forecast for 2030 shows that the coin is expected to start at a minimum UNI price of $7.96 and climb to $9.30 while averaging $8.61.
Uniswap (UNI) price prediction 2031
For the 2031 Uniswap coin price prediction, the minimum projected price for Uniswap is $9.55. Traders can expect a maximum price of $10.70 and an average price of $9.85, considering the future price movements.
Uniswap price prediction 2032
For the 2032 Uniswap forecast, it is projected to have a minimum price of $11.14. The price could soar up to $12.4, with an average of $11.64.
UNI market price prediction: Analysts’ UNI price forecast
Firm Name
2026
2027
DigitalCoinPrice
$3.81
$4.23
Coincodex
$1.94
$2.42
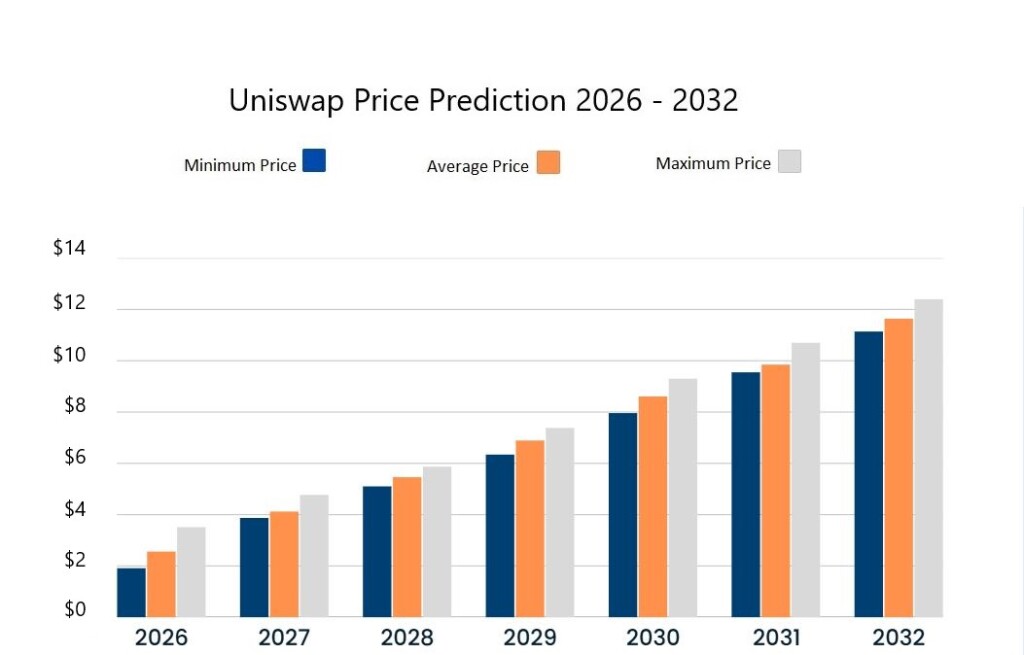
Cryptopolitan’s Uniswap price prediction
Our price prediction for Uniswap shows that UNI will reach a high of $3.51 near the end of 2026. In 2027, it will trade between an expected range of $3.87 and $4.77. In 2032, UNI will range between $11.14 and $12.4, with an average price of $11.64. It is important to consider that the predictions are not investment advice. Professional consultation is suggested, or you can carry out your own research.
Uniswap historic price sentiment
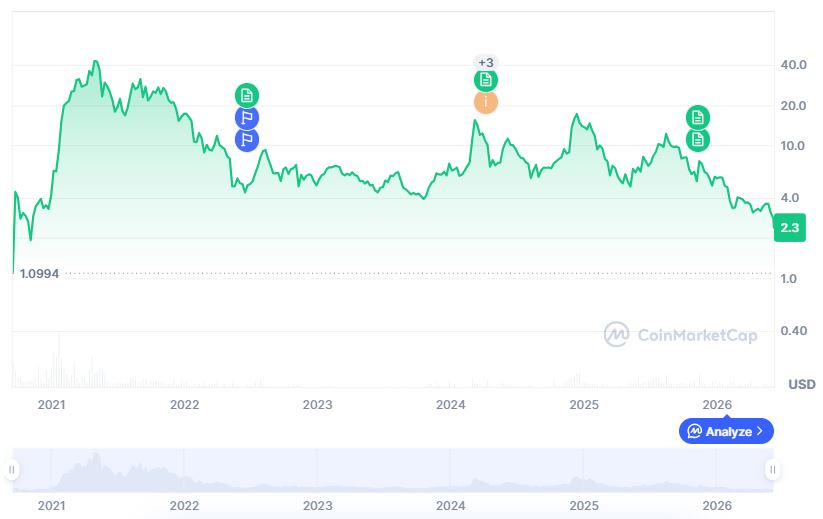
Uniswap price history. Source: Coinmarketcap
Uniswap (UNI) token launched on September 17, 2020, starting at $3.00. It quickly rose to $7.00 before reaching an all-time low of $1.03 (CoinGecko) or $0.4190 (CoinMarketCap) on the same day. UNI ended the year at $5.00 after a gradual recovery during the 2020 bull run.
In 2021, UNI surged 400% in January to $20. By March, it hit $28; on May 3, it reached an all-time high (ATH) of $44.93, skyrocketing its market capitalization. It ended the year near $18 after a significant decline.
Throughout 2022, UNI continued to decline as the cryptocurrency prices kept falling, dropping to around $5.5 by June as the bearish trend persisted.
The crypto market rebounded in 2023, and UNI saw bullish momentum, peaking at $7.77 on December 28.
UNI began 2024 on a downtrend, briefly recovering to $15 by March 6. After mid-May, it faced selling pressure, falling to $0.14 by July 31, as UNI holders kept selling assets.
It stabilized in August at around $5 and traded above $6 at the start of September.
In October, UNI reached a peak of $8, and November saw a peak price of $13.58. In December, UNI soared to $18.60.
In February 2025, Uniswap was trading near $12, which was below January price levels of $15.
In March, it dipped further down, reaching the $7.4 range, and the descent continued into April with a price of $4.7. However, some bullish price action was observed in May, when UNI jumped to $7.5 and finally peaked at $11.74 in July.
August proved a bullish month as UNI/USD reached a yearly high price of $12.31, while it remained in a downtrend in September and October.
UNI traded near the $5.7 mark in early November. After surging toward $10 in mid-November, the price of UNI declined again toward $5.5 in early December.
At the start of January 2026, UNI was trending near the $5.8 level, but in March its price decreased to $3.79.
In April, UNI was trading just above the $3 level, and it was maintaining that level until the end of May, but it decreased to $2.3 in June, as the current market sentiment is bearish.
Bitcoin is still trading above $60,000, but there are questions as to whether that area has already become the macro bottom for this correction or whether another crash could still drag the price back into that zone. Technical analysis using Bitcoin’s weekly RSI, prior cycle support, and the 21-week and 50-week EMA trend presents the bullish side of that trend, but bears can still argue that confirmation has not arrived until Bitcoin breaks above the weekly EMA structure.
Bitcoin Might Have Bottomed Already
The strongest argument that Bitcoin may have already bottomed is from the weekly RSI indicator. According to the thesis shared by Cryptoposeidon on X, Bitcoin’s weekly RSI has fallen below 30 only four times in history. The first three came around the January 2015, December 2018, and June 2022 lows, all of which later became macro bottom zones.
Back in January 2015, Bitcoin’s RSI fell to about 28 when the price fell to $200. A similar pattern played out in December 2018, when RSI dipped below 30 around $3,500, followed by about three months of sideways accumulation before Bitcoin broke higher. The third instance was June 2022, in the depths of the bear market that followed the Luna collapse.
The fourth reading came in early February 2026, shortly after Bitcoin’s crash into a bottom around $63,000, and this supports the proposal that Bitcoin may have already gone through its major capitulation phase.
The weekly candlestick timeframe chart below also shows the RSI recovering from a low band similar to the previous bear-market bottom zones, with the projected path suggesting that momentum could spend more time rebuilding before a stronger move returns in 2027.
What Confirmation And Return To $100,000 Actually Looks Like
The last two bear markets both took 364 days to move from peak to trough. The current correction is now 236 days old, which leaves a 128-day window for Bitcoin to make another low if it follows the same timing pattern.
However, looking at November 2022, Bitcoin broke below the prior cycle’s $19,900 peak and collapsed to $15,500, spending a brief period under $16,000. That breakdown was forced by the FTX implosion, a black swan event that liquidated billions in assets and obliterated confidence simultaneously. Without a comparable catalytic shock, current crypto market dynamics lack the mechanism to sustain prices below $60,000 within the remaining 128-day window for a bottom.
Bitcoin’s long-term support band is between $58,000 and $66,000, and the February 2026 low is inside that range. Bitcoin can still wick to $55,000 or even $50,000 in a liquidation event, but spending a long period below $60,000 would require a very strong bearish catalyst.
On the other hand, a reclaim and monthly close above the weekly EMA and $80,000 in June 2026 would change the conversation from “Is $60,000 the bottom?” to “How fast can Bitcoin rebuild toward $100,000?” At the time of writing, Bitcoin is trading at $72,860, down by 1.2% in the past 24 hours.
Bitcoin is approaching a pivotal moment, with several key support and resistance levels set to determine its next major move. While bulls are fighting to maintain critical price zones and preserve the broader recovery structure, bears continue to pressure the market from above.
Bitcoin Struggles Below $78,080 As Bears Retain Control
Analyst Kamile Uray notes that Bitcoin’s recent recovery attempt was feeble, with the price remaining trapped below the critical $78,080 threshold. Until the market secures a decisive 4-hour close above this level, the structural outlook remains vulnerable, and the downward trend is likely to persist.
To the downside, attention shifts toward the Fibonacci support zone spanning $71,000 to $68,000. This region historically attracts buyers and could serve as a vital foundation for a structural rebound.
Conversely, should the market turn bullish, traders must watch the $82,885 level as the primary launchpad. A successful close above this resistance opens the door to targets at $98,000, $107,000, and $109,000 that would require significant conviction to overcome.
Examining the longer-term landscape, $126,199 represents a pivotal ceiling where corrective pressure may reemerge. Ultimately, $60,000 stands as the final defense line for the asset’s structural health.
$72,500 Monthly Low Becomes The Key Level To Watch
As the new month kicks off, Lennaert Snyder identifies the $72,500 level as the critical pivot point for Bitcoin. Serving as both the Previous Monthly Low (PML) and the Previous Weekly Low (PWL), this zone dictates the immediate market bias. A decisive breakdown here would establish a strong bearish confluence, making a recovery to the previous monthly high (PMH) of $82,500 highly improbable.
Snyder’s ideal short strategy hinges on the loss of this $72,500 threshold. If the price fails to maintain this support, he anticipates a relief retest of the range, using the $78,000 Previous Weekly High (PWH) as the ceiling. This setup would provide a high-probability entry for shorts to drive the asset down to test new lows.
However, if the market successfully defends the $72,500 PML/PWL and generates a clean bullish reaction, the focus shifts to the long side. In this scenario, Snyder intends to play the continuation of the trend, provided the market maintains its structure. He emphasizes monitoring the identified imbalances, which serve as key Points of Interest (POIs) that will help determine the validity of each move.
While there is room for counter-trend opportunities, they require strict discipline. Snyder notes that while a bounce after a breach of the $72,500 support is technically possible, it remains a high-risk play. Consequently, he views such trades strictly as short-term scalps rather than foundational positions, preferring to align with the dominant trend once the market shows its hand.
Silver (XAG/USD) slipped 2.1% on Thursday to trade near $73, putting bears within striking distance of the $71 swing low. A break would expose the long-term 0.618 Fibonacci retracement at $69.
Meanwhile, the daily Relative Strength Index (RSI) tests an ascending trendline that has guided momentum since late March. Traders now wait to see whether buyers defend the line or surrender it.
Silver Price Tests $71 Support on Daily Chart
The daily chart frames the setup clearly. Silver broke above a steep descending trendline on May 7. Price retested it as support on May 8, 19, and 20. It now approaches the trendline for a fourth test.
A hold at $71 would preserve the bullish reclaim and keep the door open to a retest of $83 resistance. Beyond that level, the 0.382 Fibonacci retracement at $89 becomes the next upside target.
A loss of $71 changes the picture entirely. The next major buyer interest sits at the long-term 0.618 Fibonacci near $69. The market last saw that zone during the February crash to $63.
The confluence at $71 makes this level the most important on the chart. It stacks the swing low, the descending trendline retest, and the gateway to deeper Fibonacci support into a single zone.
Daily RSI Clings to Its Ascending Trendline
The momentum picture mirrors the price chart. On the daily timeframe, RSI sits at 43. It presses directly against an ascending trendline that has guided every dip since late March.
That trendline acted as the springboard for the rally that lifted silver toward $86 in mid-May. A clean bounce from this level would keep the neutral-to-bullish structure intact.
A break, however, would mark the first failure of the trendline in two months. Such a loss would suggest daily momentum has flipped, opening the door to deeper declines over the coming weeks.
The 43 area also matters because it capped previous corrections in March and April. A third bounce from this zone would extend the multi-month base.
For now, both bulls and bears wait for confirmation.
XAG/USD 4-Hour Action Points Toward $71
The zoomed-in view leans bearish. The 4-hour XAG/USD chart shows Bollinger Bands expanding sharply as price slides toward the $71 floor. Such expansion typically signals strong directional conviction behind the move.
The most recent 4-hour candle closed at $73.16, with the lower band pushing down toward $72. That band lines up almost perfectly with the recent swing low.
Price already broke beneath the 4-hour middle band on May 27. That move signaled the consolidation around $76 had failed. Sellers have controlled every candle close since.
The 4-hour RSI has also dropped to 36, deep into bearish territory. Sellers would need to lose control above $76 for short-term momentum to neutralize.
Macro pressure adds weight to the bearish setup. Fed rate-cut odds for June have collapsed from 48% to under 8% after the hot April CPI print. That shift lifted the dollar and pressed dollar-denominated metals.
Silver has also lost its safe-haven bid this week as oil prices ease on US-Iran negotiations. That move turns the focus back to industrial demand, which has softened with weaker manufacturing data.
The next move depends on which technical line breaks first, the ascending RSI trendline or the $71 horizontal floor.
Gold (XAU) is sliding toward the $4,376 support zone as bearish momentum accelerates. The metal broke down from a parallel triangle on May 15 and trades near $4,410 after a 2% daily drop.
Both daily and 4-hour charts flash deepening bearish momentum. Relative strength index readings are pushing into oversold territory, and Bollinger Band Width Percentile expansion confirms the strength of the downtrend.
4-Hour Chart Loses Channel Midline as RSI Hits 27
On the 4-hour timeframe, gold has slipped beneath the midline of a descending parallel channel. Price now trades near the lower band of that structure, just above the 0.618 Fibonacci retracement at $4,376.
The 4-hour relative strength index has fallen to 27, planting the indicator deep inside oversold territory. Meanwhile, Bollinger Band Width Percentile readings have reached extremely volatile zones. That profile often accompanies strong directional continuation rather than reversal.
A reclaim of the $4,609 channel midline would be the first sign that the short-term bearish setup has stalled. Until then, dips into the lower band remain in line with the dominant trend. BeInCrypto flagged the same bearish setup in earlier coverage.
Daily RSI and BBWP Reinforce the Broader Downtrend
The daily timeframe shows a similar bearish structure. However, daily RSI reads 36, well above the 4-hour oversold extreme. That gap leaves room for the higher-timeframe trend to extend without triggering an immediate mean reversion bounce.
BBWP on the daily chart has just started to expand after weeks compressed inside the very low blue zone. Historically, volatility breakouts from compressed conditions tend to extend rather than fade. The pattern supports the case for continued downside on the higher timeframe.
Gold lost the lower trendline of the prior parallel triangle on May 15 and has trended lower since. Therefore, the current sell-off extends that breakdown rather than counter-trending against it. The move mirrors the channel-based breakout framework BeInCrypto highlighted earlier this month.
Gold (XAU) Price Prediction Targets $4,044 Below $4,376 Support
On the daily chart, the immediate test is the 0.618 Fibonacci retracement at $4,376. A clean break below that zone opens the path toward the 0.786 Fibonacci at $4,044. That level marks the next major support cluster on the long-term Fib map.
However, if buyers defend $4,376, the first upside target sits at $4,609. A deeper relief rally could probe long-term resistance at the 0.382 Fibonacci near $4,842. That level has capped every bounce since the February peak above $5,600. The BeInCrypto May 2026 forecast tracks the same resistance band.
Meanwhile, X analyst CelalKucuker has mapped an even more aggressive downside path. His sequence projects a year-end 2026 target of $3,500.
“Gold 5600$ 4350$ 5250$ 4000$ 5000$ 4600$ 4200$ (almost) 3500$ 2026 end of year”
The outlook aligns with the bearish projection sketched on the higher-timeframe chart. Price targets there cascade from $4,234 toward $3,475. The path contrasts sharply with the $20,000 speculation circulating in derivatives markets.
For now, the daily channel and BBWP expansion suggest the path of least resistance remains to the downside. That outlook holds until $4,376 proves it can absorb sustained selling pressure.
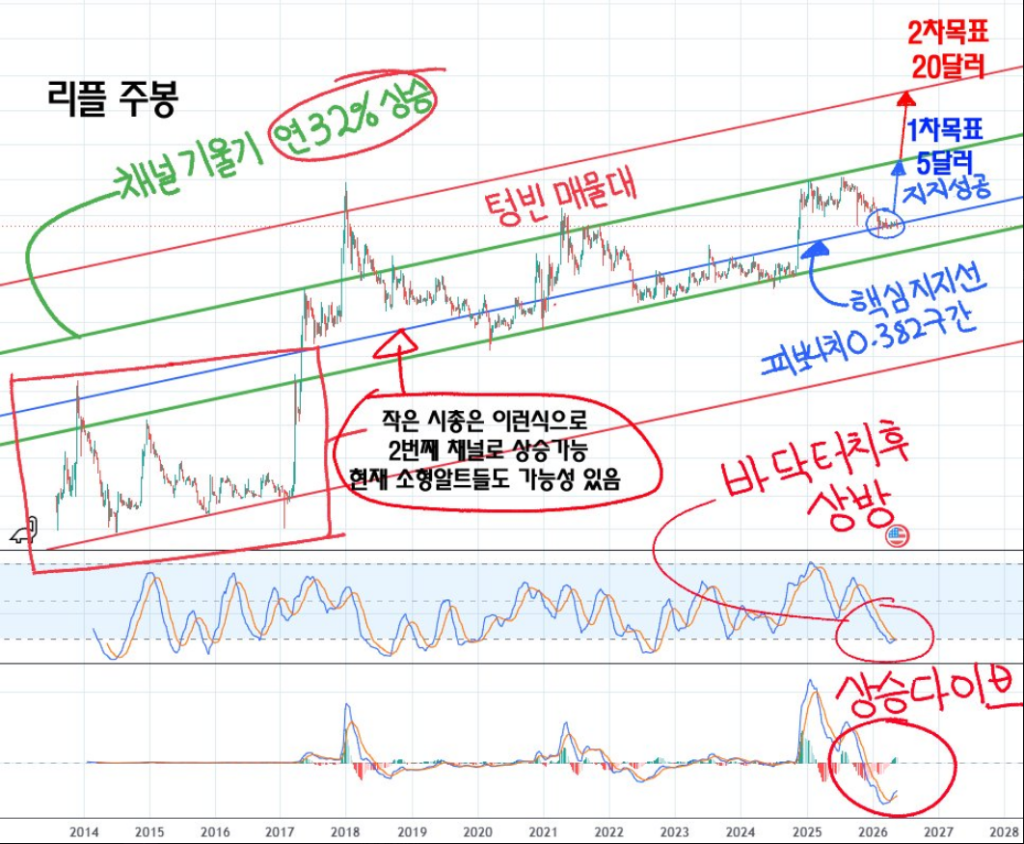
XRP could climb as high as $20 if a breakout pattern from 2018 repeats itself, according to pseudonymous Korean financial analyst Ninedex.
That scenario, while not his main call, hinges on the token breaking out of the upper edge of a channel structure that has shaped its price movement for over a decade.
The Long Road From $1.34
XRP is currently trading around $1.34, down nearly 13% from its May 14 high of $1.54. Despite the pullback, Ninedex argues the token is still holding a key support zone within what he describes as a multi-year ascending channel — one that has guided XRP since it began trading in 2013.
Based on his analysis, that support sits just above the lower boundary of the channel’s middle layer and aligns with the Fibonacci 0.382 level, which corresponds to the $1.40 price area.
The zone was built over an extended period between 2022 and 2024, which is why he considers it one of the strongest long-term support levels in XRP’s history.
XRP spent its early years in the lower section of that channel before a broad crypto rally in early 2017 pushed it into the middle range. It briefly entered the upper channel in January 2018 when prices surged above $3, but a sharp correction followed and pulled it back into the middle layer.
Ninedex says the token has stayed there for the past eight years, and its ability to hold that zone is what keeps it among the major assets in the market rather than slipping back to minor status.
26.05.25 리플 코인 분석.
리플 주봉을 분석해보겠습니다.
리플의 경우 철저히 자본팽창을 추종하며,
연성장 32%의 기울기를 가지고 있으며,
14년~16년이후 소형알트에서 메이저 알트가 되며,
채널이 한 계단 상승하였습니다.
(옥석이 가려진 몇몇 소형 알트들의 미래라고 생각함.)
The transition from a small altcoin to a top-tier asset happened precisely because XRP moved up a layer in the channel during that 2017 cycle, he argues.
Technicals Back The Bullish Read
Ninedex pointed to two technical signals that support his outlook. The weekly stochastic indicator has bounced from 15 points to 20 points — a level he says has historically marked one of XRP’s rare oversold conditions.
The MACD, meanwhile, has formed a golden cross on its EMA lines, with the oscillator moving back into positive territory, which he reads as a sign that market momentum is turning upward.
His primary target is $5, reachable if XRP climbs toward the upper boundary of the middle channel. But he also noted that XRP’s history of sharp rallies and its large community base could push prices well beyond typical expectations — and if it breaks into the upper channel again, $20 becomes the figure he has in mind.
Featured image from Unsplash, chart from TradingView