Bitcoin’s rebound has not removed the risk of another volatile move. CryptoQuant is warning that exchange deposit activity has picked up across Bitcoin, Ethereum, and altcoins, a pattern that often appears when traders are preparing to move risk around quickly.
That does not automatically mean a crash is coming. It does mean the market is becoming more sensitive.
For more details, visit the official Cryptoquant platform.
TL;DR
CryptoQuant’s latest market read points to a jump in exchange deposits, including elevated Bitcoin inflows. Rising deposits can be a volatility signal because coins moving to exchanges are more likely to be sold, hedged, rotated, or used as collateral.
The important word is “can.” On-chain deposits are not a perfect sell signal. Sometimes coins move to exchanges for liquidity management, derivative margin, or market-making activity. But when deposits spike while price is already under pressure, traders tend to pay attention.
That is the situation Bitcoin is in now. BTC has stabilised, but the wider market still feels jumpy. ETF flows have been uneven, altcoins are fragile, and macro risk appetite is not giving crypto a clean tailwind.
Why Deposits Matter Here
Exchange inflows matter because they change the available supply profile. Coins sitting in cold storage are usually less likely to hit the market quickly. Coins arriving on exchanges are more flexible. They can be sold, used to open positions, or shifted into other assets.
When a large number of coins arrives at once, the market starts asking why.
If the inflow is driven by whales preparing to sell, spot pressure can build. If it is linked to derivatives positioning, volatility can rise even if the coins are not immediately dumped. If it reflects market makers preparing for higher activity, price can swing both ways.
That is why the signal is more about volatility than direction. The market is being primed for movement.
Bitcoin Needs More Than A Bounce
Bitcoin’s short-term recovery gives bulls room to argue that sellers are losing control. But on-chain deposit pressure complicates that argument.
A healthy rebound usually wants to see coins moving away from exchanges, not toward them. It wants accumulation, calmer leverage, and improving flows. If deposits keep rising, traders may stay defensive even while price holds above recent lows.
The next phase will depend on whether those deposited coins become sell pressure. If Bitcoin absorbs the inflows and holds its recovery, that would be a constructive sign. It would show that the market can handle supply without breaking.
If price rolls over while deposits remain elevated, the CryptoQuant warning will look more serious.
For now, this is not a panic signal. It is a caution flag. Bitcoin has bounced, but the market is still loaded with enough exchange-side activity to make the next move sharp.
This report is based on information from CryptoQuant.
The practical takeaway is that traders should avoid reading the current rebound in isolation. A market can look stable on the surface while exchange-side liquidity is preparing for a larger move. That is why deposit data belongs next to ETF flows, funding conditions, and spot support levels when assessing Bitcoin risk this week.
This article was written by the News Desk and edited by Samuel Rae.
Bitcoin has staged a notable rebound after sweeping liquidity beneath the June lows, but the recovery is now approaching a critical resistance cluster. While momentum has improved in the short term, the broader structure remains bearish until BTC reclaims several major resistance levels overhead.
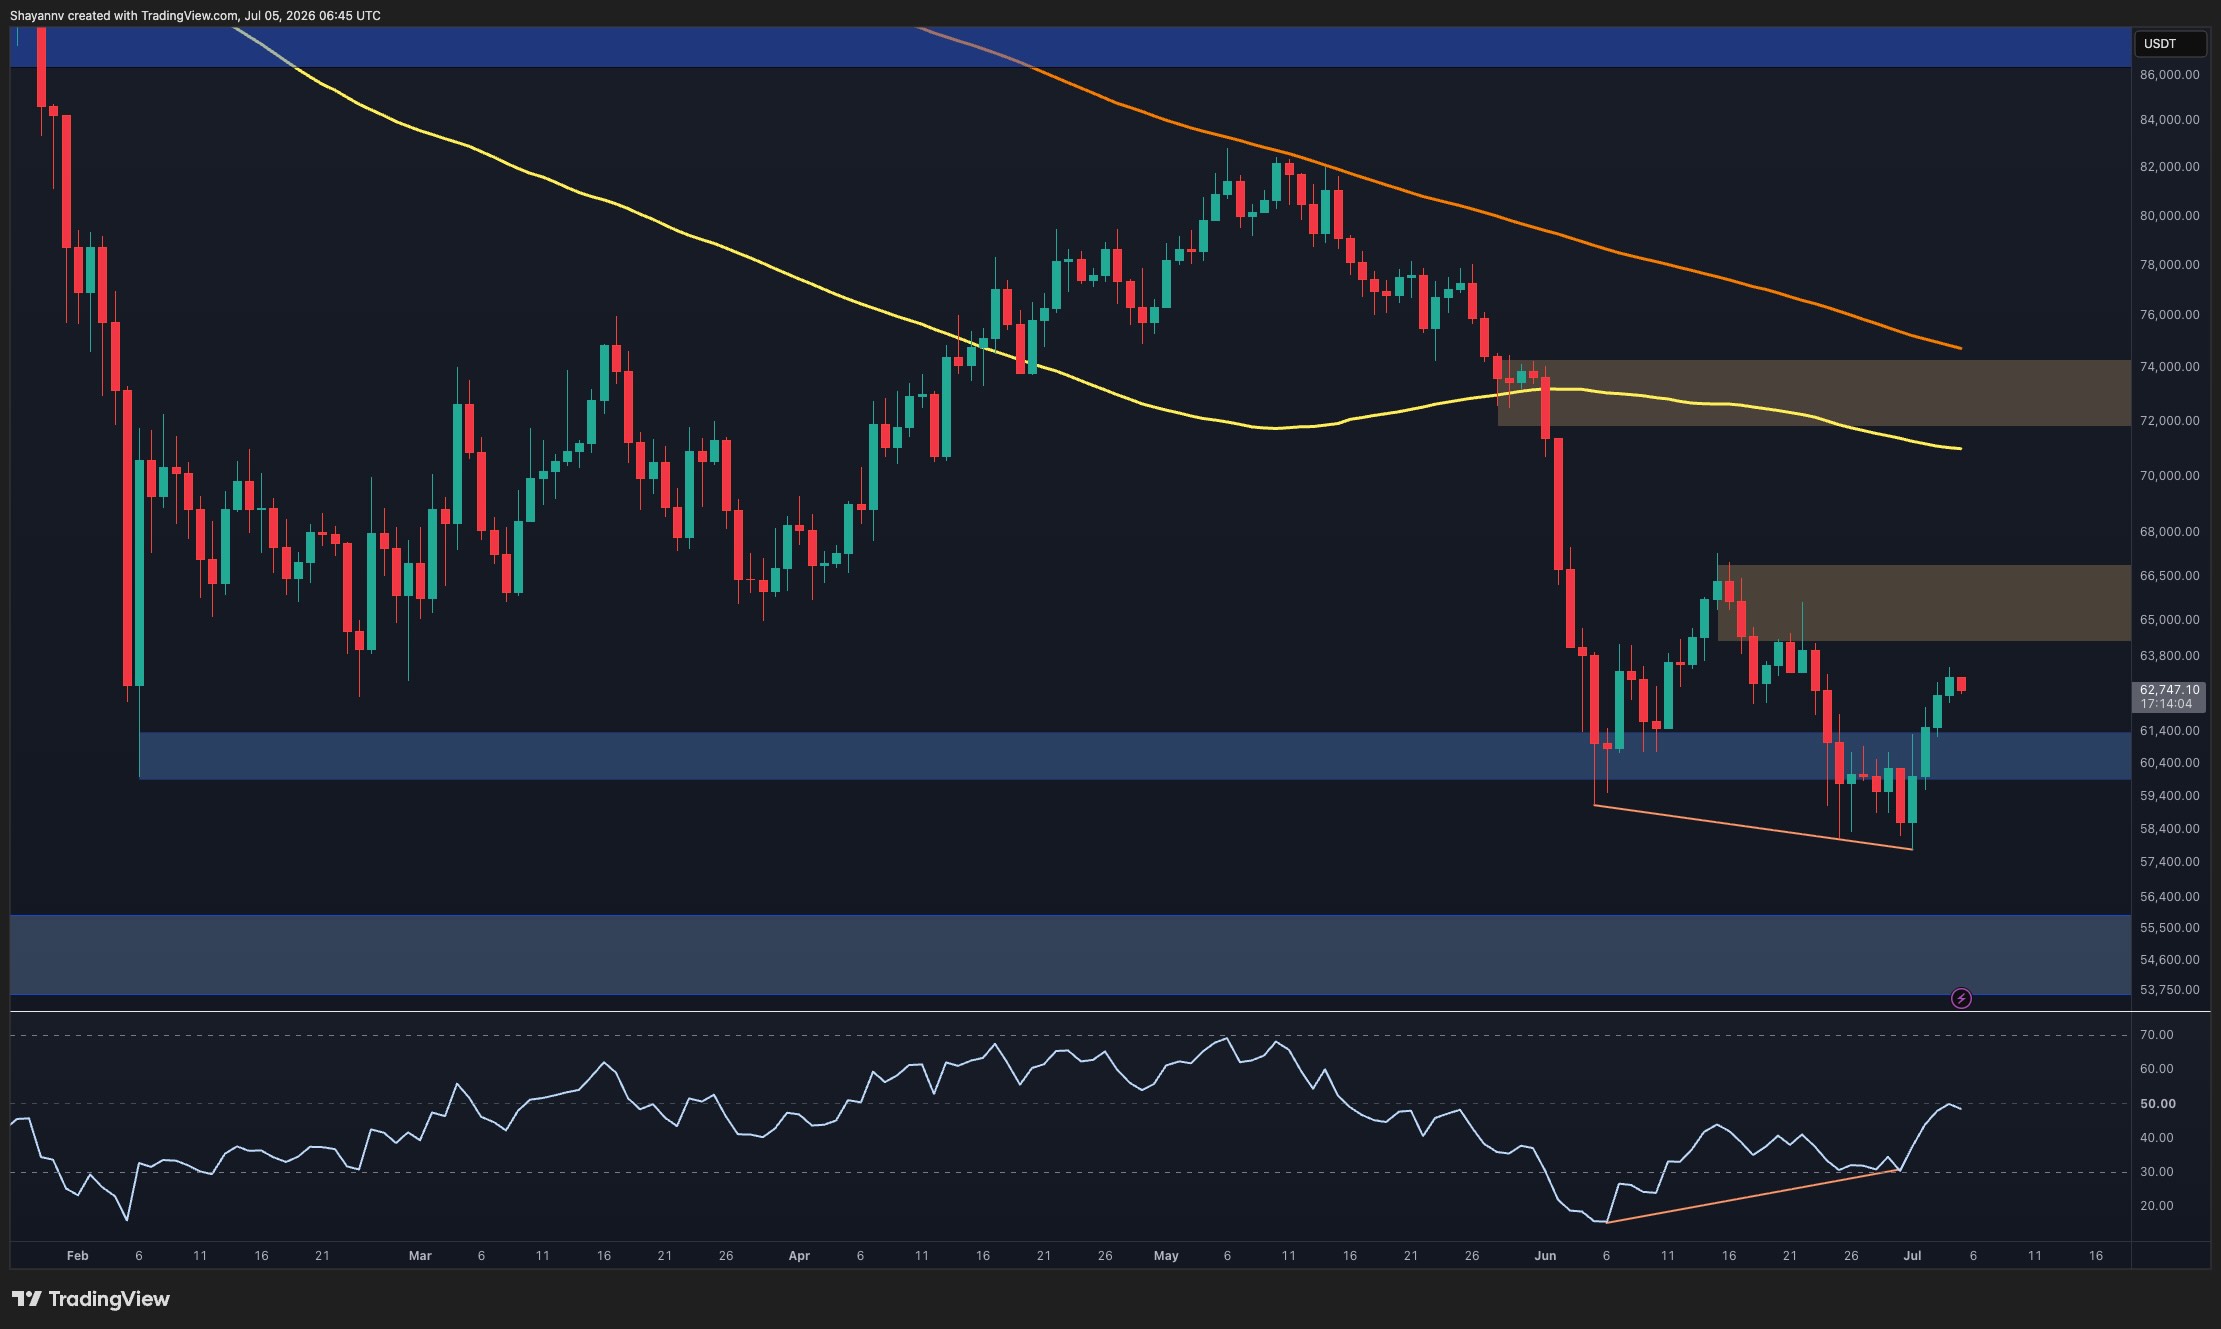
Bitcoin Price Analysis: The Daily Chart
The daily timeframe shows Bitcoin continuing to trade below its key moving averages, with both the 100-day and 200-day moving averages sloping lower and acting as dynamic resistance. The market remains structurally bearish after losing the $72K-$74K support zone in June, which has now flipped into a major supply area.
However, the recent price action is becoming more constructive. BTC successfully defended the $58K-$61K support region and produced a sharp bounce from the lower boundary of the broader descending structure.
More importantly, the daily RSI has formed a bullish divergence, with momentum making higher lows while the price registered comparable or lower lows around the June bottom. This divergence often appears during exhaustion phases and suggests selling pressure has been weakening despite the downtrend.
The immediate challenge lies around $65K-$67K, where a major resistance zone intersects with the descending upper trendline. A successful breakout above this area would likely trigger a larger recovery toward the former breakdown region near $72K-$74K. Conversely, rejection from the current resistance cluster would reinforce the prevailing bearish structure and increase the probability of another move toward the $60K support area.
BTC/USDT 4-Hour Chart
The 4-hour chart highlights a developing falling wedge structure. Bitcoin recently rebounded from the lower boundary near $58K and has advanced steadily toward the upper trendline, which currently converges with the $63K-$64K area.
The recovery has already reclaimed the $60K-$61K support zone, turning it back into a short-term demand area. Price is now testing the upper boundary of the wedge while approaching the lower edge of the $64K-$66.5K supply zone.
A breakout above the descending trendline could accelerate bullish momentum and open the path toward the higher resistance region around $65K-$67K. Such a move would also confirm a short-term shift in market structure after weeks of lower highs.
If the breakout fails, Bitcoin may continue consolidating inside the wedge before attempting another push higher. The $60K-$61K region remains the most important near-term support, while a breakdown below it would place the recent recovery at risk.
Sentiment Analysis
The Spot Average Order Size metric provides insight into the behavior of larger market participants. Recent data shows that whale-sized transactions continue to dominate activity despite Bitcoin trading near local lows.
The latest readings indicate that large orders remain active in the market while prices hover around the $60K-$63K region. Although the metric alone cannot determine directional intent, the persistence of larger transaction sizes during a prolonged decline suggests institutional and high-net-worth participants remain engaged rather than stepping away from the market.
Combined with the bullish RSI divergence on the daily chart and Bitcoin’s defense of the $58K-$61K support zone, the data suggests accumulation interest may be emerging around current levels. Nevertheless, confirmation still requires a technical breakout above the descending trendline and the $65K-$67K resistance cluster.
Until that occurs, Bitcoin remains in a broader corrective structure, with the current recovery appearing more like an attempt to build a base rather than a confirmed trend reversal.
Wall Street’s Bitcoin expectations have taken another hit. Citi has cut its 12-month Bitcoin target to $82,000 from $112,000, pointing to weaker investor appetite, negative ETF flows, and a slower regulatory backdrop in the United States.
The move is not just another forecast revision. It shows how much of the institutional Bitcoin thesis still depends on one input: whether spot ETFs can keep attracting fresh capital.
For more details, visit the official Reuters platform.
TL;DR
Citi lowered its Bitcoin target to $82,000 and cut its Ether forecast to $2,240. The bank also reportedly reduced its assumed net ETF inflows over the next 12 months to zero, down from a previous expectation of $10 billion. That is the real headline for crypto markets.
Price targets are easy to debate. Flow assumptions are harder to ignore.
Bitcoin’s ETF launch era gave the market a clear institutional demand story. For a while, that story helped support higher prices and stronger confidence. But when flows turn negative, the same structure works in reverse. Analysts do not simply mark down price targets because BTC fell. They mark them down because the demand model behind the price target has changed.
That is what Citi’s revision reflects.
The ETF Bid Is Being Repriced
The key issue is not whether Bitcoin can still trade above Citi’s target. It can. Crypto price targets are never guarantees. The more important point is that one of the market’s most widely followed demand channels has become less reliable.
ETF flows have been treated as the bridge between traditional portfolios and Bitcoin exposure. If those flows weaken, the market has to lean more heavily on native crypto demand, corporate treasury buyers, and long-term holders.
That can still be enough. But it makes the path more volatile.
Citi’s cut also lands at a moment when digital asset treasury companies are under closer scrutiny. If investors worry that treasury buyers may become sellers, the market’s confidence in institutional accumulation weakens further. That does not mean a wave of forced selling is inevitable, but it adds another layer of caution.
Why This Matters For Bitcoin Traders
For traders, the message is simple: Bitcoin needs a new catalyst or a repair in ETF flows.
A stronger macro backdrop could help. So could clearer US digital asset legislation, a return of ETF inflows, or renewed accumulation from long-term holders. Without one of those, the market may struggle to rebuild the same momentum it had when spot ETF demand was the dominant story.
That does not make Citi’s $82,000 target bearish in absolute terms. It is still above current prices. But it is a meaningful downgrade from the earlier view and shows that institutional expectations are being reset.
Bitcoin has survived plenty of forecast cuts before. The question now is whether the ETF market can stop being the reason analysts lower their numbers and start being the reason they raise them again.
This report is based on information from Reuters and Citi’s reported market forecasts.
This article was written by the News Desk and edited by Samuel Rae.
The setup makes the “freedom money” moniker fit quite nicely. Bitcoin does not need a bank branch, a U.S. exchange session, or an ETF trading day to keep settling globally. But the same independence leaves price discovery running while some of the largest U.S. institutional access channels are offline.
The root problem with conventional currency is all the trust that’s required to make it work. The central bank must be trusted not to debase the currency, but the history of fiat currencies is full of breaches of that trust.
The phrase “freedom money” appears in Bitcoin writing at least as early as Hector Rosenkrans’ July 4, 2020 essay on Bitcoin and the First Amendment, and later gained a broader human-rights framing through writers such as Alex Gladstein.
The ETF pause
The holiday benchmark, however, is less philosophical than mechanical. The latest Bitcoin ETF flows showed U.S. spot Bitcoin funds swinging from $222 million in net outflows on June 30 and $296 million in outflows on July 1 to $223.5 million in inflows on July 2. Then the U.S. market holiday removed the normal exchange-traded fund window just as Bitcoin itself kept moving.
The same feature now does two jobs. Holders and global traders still have access when NYSE and Nasdaq markets are closed. Yet ETF creations and redemptions, U.S. equity market liquidity, and much of traditional market-making capacity are paused or reduced.
Banking is also more complicated than a simple on-off switch. Federal Reserve Financial Services says in its holiday schedule that Federal Reserve Banks and branches are open the preceding Friday when a holiday falls on Saturday, while Independence Day processing has a scheduled pause late July 3 and resumes July 5. In practice, payment and banking services move onto holiday schedules while Bitcoin’s settlement clock keeps running.
That leaves a cleaner answer than either side of the debate usually wants. Bitcoin’s always-on design is a real advantage during a U.S. holiday, but it can also become a holiday liquidity trap if price moves accelerate while ETF buyers and traditional liquidity providers are away.
The weekend test is whether BTC can maintain orderly price discovery when the very rails that helped institutionalize the asset are absent to absorb the move.
The Department of Government Efficiency (DOGE) officially ended on July 4, the sunset date written into President Donald Trump’s January 2025 executive order. Posts from Elon Musk and Michael Saylor quickly fueled speculation that Bitcoin (BTC) inherits the reform story.
Musk, DOGE’s former co-leader, marked Independence Day with a patriotic video montage instead of a farewell to the program. Meanwhile, MicroStrategy’s executive chairman answered him with one loaded line.
DOGE Ends With No Report and No Farewell
Trump’s January 2025 executive order created DOGE as a temporary organization. It set termination for July 4, 2026, America’s 250th birthday.
The program barely made it that far. DOGE had already collapsed as a centralized body last November, months ahead of schedule. Its public savings tracker went silent after January 1.
The commission claimed $215 billion in savings, about $1,335 per taxpayer by its own math. That equals roughly 3% of one year’s $7 trillion federal budget, and a fraction of the $2 trillion Musk pitched in October 2024.
Office of Management and Budget Director Russ Vought told lawmakers this week that no closing report is planned, Politico reported.
Musk, who left Washington in May 2025 after 130 days as a special government employee, always framed the ending as intentional.
The efficiency concept has meanwhile traveled beyond Washington. New York City Mayor Zohran Mamdani recently launched a municipal efficiency version of the playbook.
Michael Saylor Answers Musk With a Bitcoin Pitch
Marc Andreessen opened July 4 with a five-minute montage of American history and the caption “God bless America.” Musk shared the same video hours later.
Saylor then replied to Musk directly, swapping a letter for the Bitcoin symbol.
Saylor has run this play before. In December 2020, he publicly urged Musk to shift Tesla’s balance sheet into Bitcoin. Tesla bought $1.5 billion worth two months later, then suspended BTC payments in May 2021 over energy concerns.
That history shaped the reaction. Traders read the exchange as a handoff from government reform to sound money, and some replies urged Tesla to resume Bitcoin payments. BTC trades near $62,584, up about 1% in 24 hours.
The timing carries irony for Saylor. Strategy faces questions over a reported 491 BTC sale and a dividend policy JPMorgan called risky. Meanwhile, Saylor pits MSTR against the Magnificent 7.
Neither Musk nor Saylor mentioned DOGE by name. The debate now turns on whether innovation and Bitcoin truly replace the reform push, or whether the ₿etter reply stays a holiday flourish.
Our Bitcoin price prediction expects BTC’s price to reach $150K by the end of 2026 due to the bullish sentiment following the halving event.
By 2032, BTC might touch $350,548 following increased institutional adoption.
Bitcoin’s outlook for 2026 has become highly debated. The approval of spot Bitcoin ETFs and the rally after the halving were expected to bring more clarity, but instead they’ve brought mixed volatility in Bitcoin price forecast.
However, top analysts are bullish on BTC price prediction this year. Charles Hoskinson, the founder of Cardano, has predicted that Bitcoin could reach about $250,000 by 2026. He bases this view on Bitcoin’s limited supply and the possibility that institutions and major companies will continue to adopt it. Investor and author Robert Kiyosaki has made a similar prediction, arguing that Bitcoin’s scarcity makes it a strong store of value in a world where traditional currencies are becoming less stable.
As Bitcoin’s on-chain activities surge, questions arise, such as: “Does Bitcoin have the potential to hold above the $100K mark?” or “Will Bitcoin go up?” or “Where will Bitcoin be in 5 years?” Let’s answer them using our Bitcoin price prediction 2026 model.
Overview
Cryptocurrency
Bitcoin
Ticker
BTC
Price
$61,348 (+1%)
Market capitalization
$1.42 Trillion
Trading volume (24-hour)
$52.53 Billion (+7%)
Circulating supply
20 Million BTC
All-time high
$124,457; August 14, 2025
All-time low
$0.04865; Jul 15, 2010
24-hour high
$62,682.34
24-hour low
$58,926.33
Bitcoin price prediction: Technical analysis
Metric
Value
Current Price
$ 61,748
Price Prediction
$ 66,003 (7.61%)
Fear & Greed Index
19 (Extreme Fear)
Sentiment
Bearish
Volatility
3.25% (Medium)
Green Days
12/30 (40%)
50-Day SMA
$ 67,794
200-Day SMA
$ 75,112
14-Day RSI
43.82 (Neutral)
Bitcoin price analysis
TL;DR Breakdown:
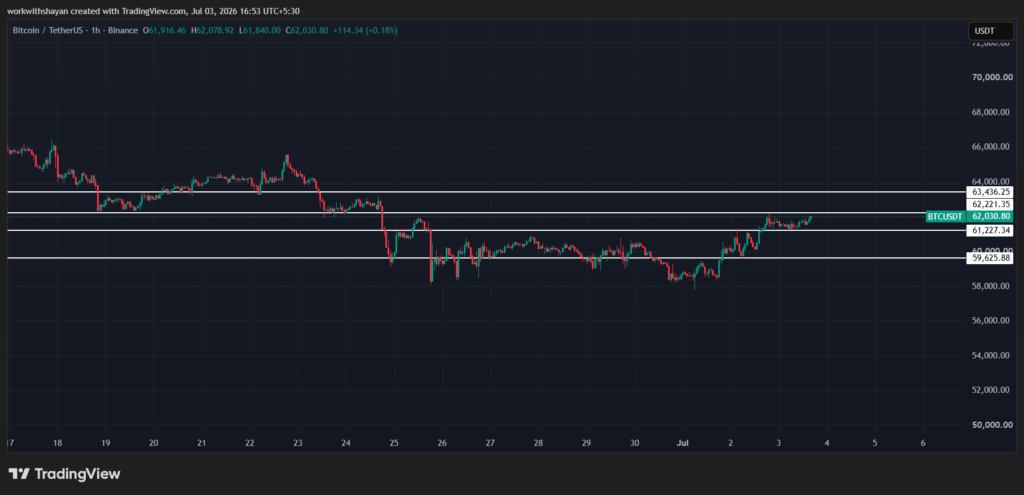
BTC price analysis shows that buyers are pushing the price toward $62K
Resistance for BTC is at $62,221
Support for BTC/USD is at $61,227
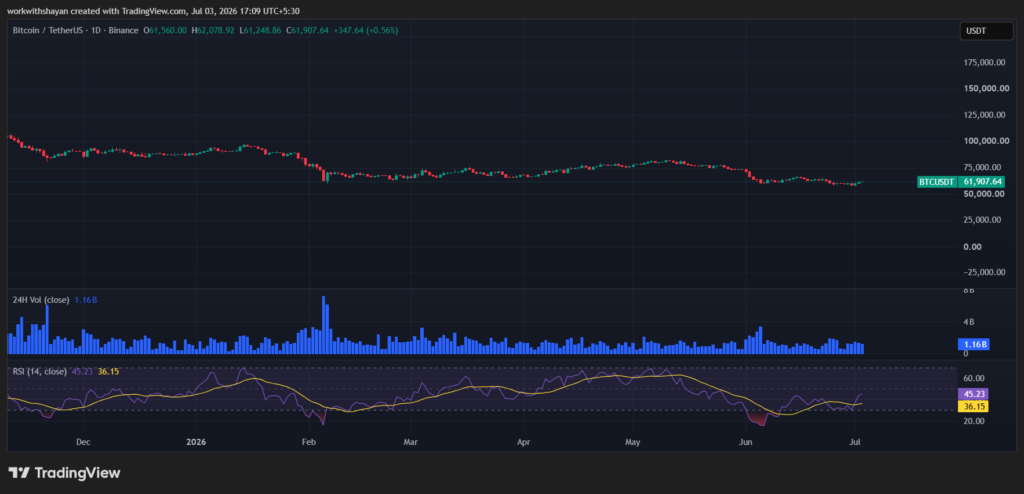
The BTC price analysis for 3 July confirms that BTC faces buying pressure as BTC declines toward $62K. Currently, the Bitcoin price is aiming to hold above $60K.
Analyzing the daily Bitcoin price chart, we see that Bitcoin faces bullish pressure as it surges toward $62K. Currently, the BTC price is facing short-liquidation around immediate resistance channels. The 24-hour volume has increased to $1.16 billion, showing a surge in trading interest today. BTC is trading at $62,111, surging by over 1% in the last 24 hours.
The RSI-14 trend line hovers around 32, hinting that a strong bearish pressure is on the way. The SMA-14 level suggests volatility in the next few hours.
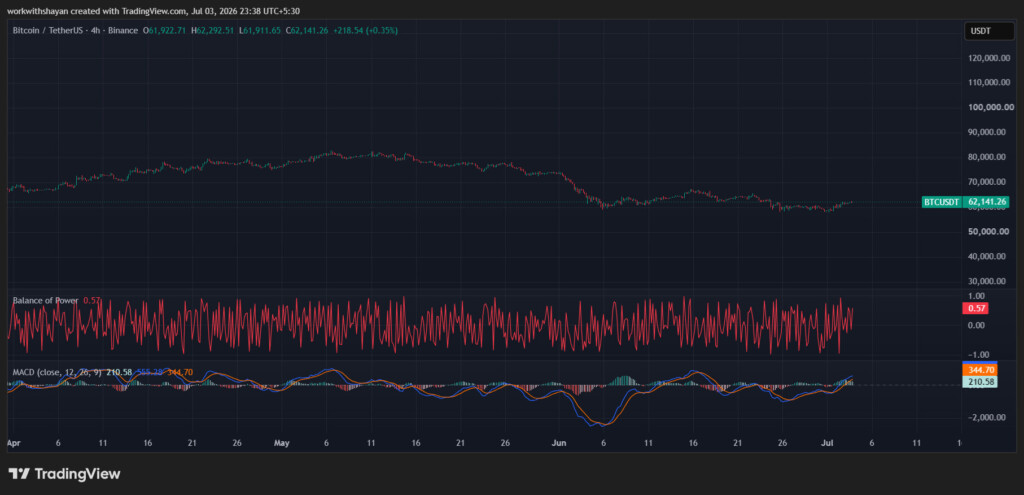
BTC/USD 4-hour price chart: Selling domination rises around EMA trend lines
The 4-hour Bitcoin price chart suggests that sellers are strengthening their position to hold the price below the EMA trend lines. Currently, sellers are strongly defending a recovery.
The BoP indicator trades in a positive region at 0.52, showing that short-term buyers are taking a chance to accelerate an upward trend.
Additionally, the MACD indicator has formed green candles above the signal line and the indicator aims for positive momentum, strengthening long-position holders’ confidence.
Bitcoin technical indicators: Levels and action
Daily simple moving average (SMA)
Period
Value
Action
SMA 3
$ 60,096
BUY
SMA 5
$ 60,036
BUY
SMA 10
$ 60,393
BUY
SMA 21
$ 62,482
SELL
SMA 50
$ 67,794
SELL
SMA 100
$ 71,181
SELL
SMA 200
$ 75,112
SELL
Daily exponential moving average (EMA)
Period
Value
Action
EMA 3
$ 60,652
BUY
EMA 5
$ 60,448
BUY
EMA 10
$ 60,800
BUY
EMA 21
$ 62,305
SELL
EMA 50
$ 66,195
SELL
EMA 100
$ 69,980
SELL
EMA 200
$ 76,481
SELL
What to expect from BTC price analysis next?
The hourly price chart confirms that Bitcoin is attempting to drop below the immediate support line; however, bulls are eyeing a recovery rally in the coming hours. If BTC’s price holds momentum above $62,221, it will fuel a bullish rally to $63,436.
If bulls fail to initiate a surge, the BTC price may drop below the immediate support line at $61,227, beginning a bearish trend to $59,625.
Is Bitcoin a good investment?
The rising institutional demand for Bitcoin etfs makes it a good investment option in the crypto market. However, Bitcoin has a short investment history filled with very volatile market value. Whether it is a good investment depends on your financial profile, investment portfolio, risk tolerance, and investment goals. It is suggested to conduct investment advice of the financial markets and understand the financial system risks.
Why is Bitcoin up today?
Bitcoin faced a surge in buying pressure as buyers pushed the price above immediate fib levels around $60K.
Will the BTC price reach $100K?
Bitcoin price broke its much-anticipated mark of $100K, aiming for a new ATH. The price currently prepares to maintain its buying demand above $100K.
Will BTC reach $1 million?
$1 million is a significant milestone for the BTC price. However, it is achievable if Bitcoin continues to attract institutional interest in the coming years.
Is Bitcoin a good long-term investment?
As several institutions continue to accumulate BTC and Bitcoin faces a rise in global recognition, Bitcoin has a solid long-term future.
Recent news/opinions on BTC
As reported by Cryptopolitan, JPMorgan Chase & Co. is concerned that Strategy’s new policy of selectively selling its Bitcoin holdings will introduce new risk to the crypto market.
Bitcoin price prediction July 2026
Bitcoin’s price dropped toward $60K in June. However, it is now facing minor accumulation, which could mean we’ll see a recovery around July 2026.
Bitcoin’s price might attempt to maintain an average price of $75,000 and be pushed further, at least $80,000 if strong downward pressures are not seen. However, we might see a rejection on the bearish side, leading to a consolidation at around $60,000.
Bitcoin Price Prediction
Potential Low
Potential Average
Potential High
Bitcoin Price Prediction July 2026
$60,000
$75,000
$80,000
Bitcoin price prediction 2026
Historically, Bitcoin has been a significant crypto coin in the years following a halving, and it is expected to push up its price after a downturn in 2025. Bitcoin miners might play a crucial role in holding bullish sentiment for future price movements.
Spot Bitcoin ETFs are projected to be a key driver of Bitcoin prices and the broader cryptocurrency market in 2026. As a result, Bitcoin’s trajectory might follow a bullish trend ahead with rising treasury term premium.
Furthermore, there is an increasing bullish sentiment that the base interest rates could be cut in the US, and thus, help to further the upward movement of Bitcoin. An outcome of which the 2026 year could be positive for Bitcoin, with its crypto-price perhaps touching $150,000 at the highest and the low could be around $48,000.
Bitcoin Price Prediction
Potential Low
Potential Average
Potential High
Bitcoin Price Prediction 2026
$48,000
$100,000
$150,000
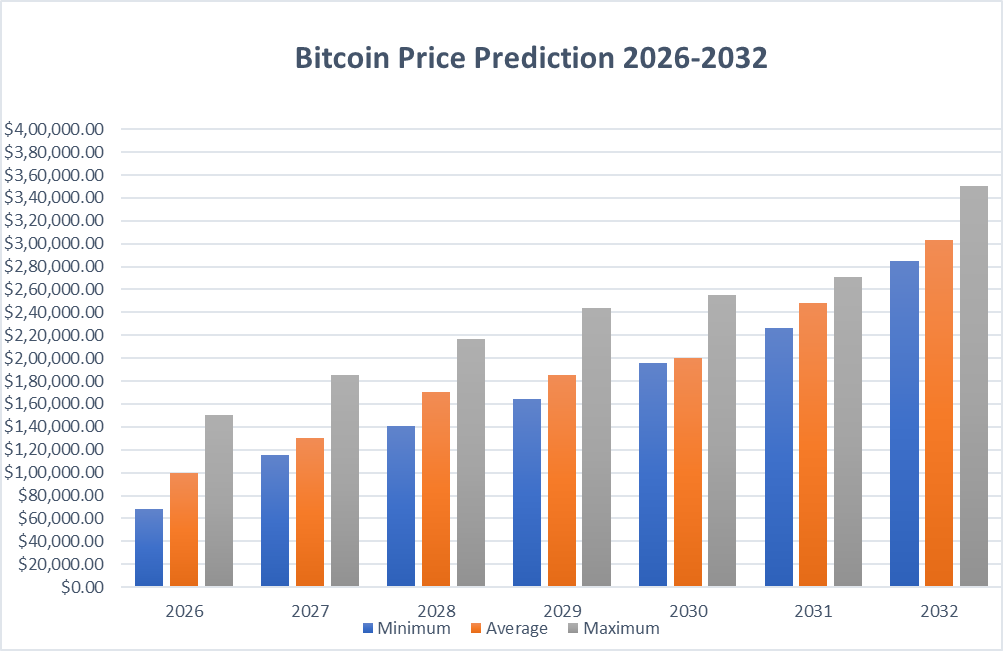
Bitcoin Price Predictions 2027-2032
Year
Minimum Price
Average Price
Maximum Price
2027
$115,000
$130,000
$185,000
2028
$140,491
$170,100
$216,738
2029
$164,063
$185,068
$244,142
2030
$195,629
$200,312
$255,321
2031
$225,903
$248,568
$270,593
2032
$285,058
$303,555
$350,548
Bitcoin price prediction 2027
Bitcoin might witness slow growth after 2025’s Bitcoin halving surge, resulting in a surge in selling pressure. However, more financial products including a surge in ETF flows might hold BTC prices within a bullish region. The digital assets market sentiment shows bullish signals for Bitcoin hit new highs. As the overall sentiment gives a bullish outlook, one should research more about Bitcoin before investing.
We might see a maximum price of $185,000, with a minimum price of $115,000 and average price of $130,000.
Bitcoin forecast 2028
Based on a detailed technical analysis of past Bitcoin price movements, it is projected that in 2028, Bitcoin could see a minimum price of $140,491. The potential maximum price is estimated to be $216,738, with an average closing price of $170,100.
Bitcoin price prediction 2029
By 2029, Bitcoin’s price is expected to reach a low of $164,063. Maximum price projections are as high as $244,142, averaging about $185,068 for the year.
Bitcoin price forecast 2030
Projections for 2030 suggest that Bitcoin could be valued at a minimum of $195,629. The price may peak at as much as $255,321, with an average throughout the year expected to be around $200,312.
Bitcoin (BTC) price prediction 2031
The forecast for 2031 suggests that Bitcoin’s price could start at a minimum of $225,903 and potentially rise to a maximum of $270,593. The average price is anticipated to stabilize at about $248,568 throughout the year.
Bitcoin price prediction 2032
The forecast for 2032 suggests that Bitcoin’s price could start at a minimum of $285,058 and potentially rise to a maximum of $350,548. The average price is anticipated to stabilize at about $303,555 throughout the year.
A surge in bitcoin adoption and the expansion of the Bitcoin ecosystem might end the controversy of “Bitcoin bubble” in future. This might boost the Bitcoin cost and strengthen the Bitcoin network. At Cryptopolitan, we are bullish on Bitcoin’s future price as the historical market sentiment is extremely impressive. By the end of 2026, Bitcoin might record a maximum of $150,000, with a minimum price of $48,000 and an average price of $100,000.
However, Bitcoin’s future market potential entirely depends on its buying demand, regulation, and investor sentiment regarding long-term holdings. Crypto analysts provide a positive sentiment as macroeconomic trends turn promising.
We expect Bitcoin price to surpass a high of $216,738 by the end of 2028.
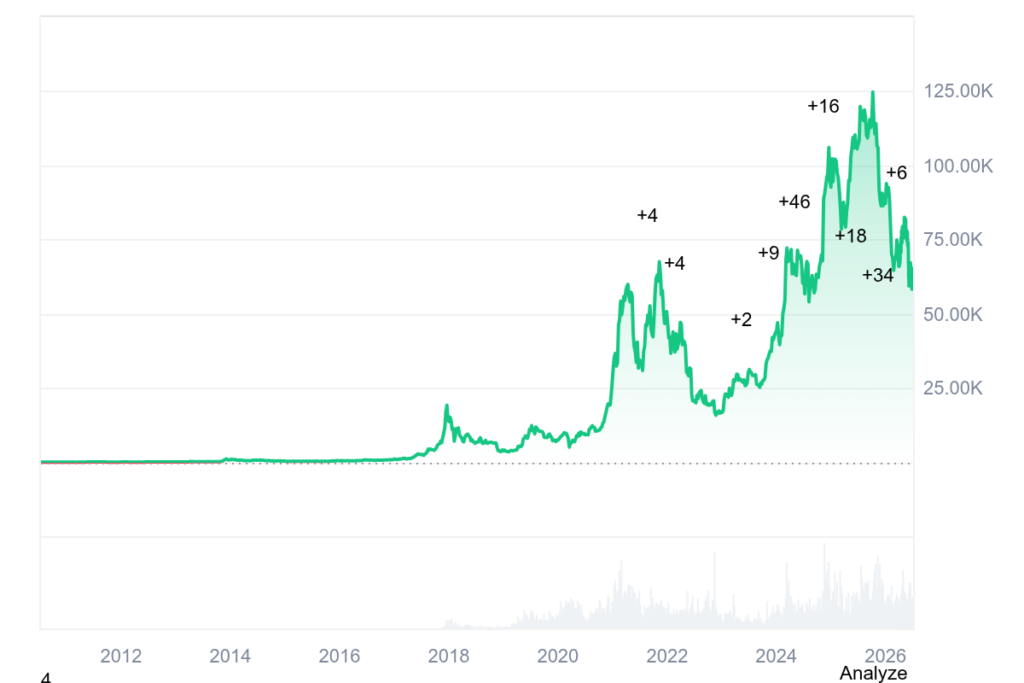
Bitcoin historic price sentiment
BTC price history: Coinmarketcap
Satoshi Nakamoto created Bitcoin in 2009, marking the first use of blockchain technology.
Bitcoin was initially of little value, gaining significant traction and hitting over $15,000 during the 2017 boom, with further highs reached in 2019 and 2021.
In 2021, Bitcoin peaked at $68,789.63 but dropped to $15,760 by December 2022 amid economic pressures, including inflation and geopolitical conflicts.
By April 10, 2023, Bitcoin’s price surged 83%, breaking the $30,000 resistance level.
Throughout mid-2023, Bitcoin’s value hovered around $30,000, nearly reaching $32,000 due to positive market sentiments and potential ETF approvals.
Bitcoin experienced a significant price drop in mid-August 2023, falling to $25,000. However, its prices remained volatile, fluctuating between $26,000 and $29,500 in October.
Bitcoin closed 2023 above $42,000, a 155% increase from the year’s start.
In early 2024, Bitcoin rose above $45,000 on ETF anticipation but briefly dipped below $40,000 after approvals. It broke its 2021 all-time high in March, reaching $73,750.07 on March 14, before dropping below $60,000 in April. May saw another surge above $70,000, while June and July brought heavy fluctuations between $70K and $55K.
Bitcoin rallied to $66K in September after a Fed rate cut, climbed to $70K in October’s Uptober rally, and surged toward $108K following Donald Trump’s victory in the November US elections. BTC ended 2024 consolidating below $95K.
At the start of January 2025, BTC was trading between $92,788.13 and $95,824.39. However, it formed an ATH at $109,114 on January 20.
In the weeks of February, the price of BTC dropped heavily as it dropped toward the $78K low.
In March, the price of Bitcoin declined heavily and dropped toward a low of $76.6K. In April, the price of Bitcoin started recovering. By the end of April, it neared the critical $95K zone.
In May, Bitcoin price skyrocketed and it formed a new ATH at $111,970. However, the price declined later, toward $104K.
By the end of June, BTC price reclaimed the $108K level.
In July, BTC price triggered a surge toward $123K; however, it faced strong selling pressure later.
In mid-August, the price of Bitcoin surged above $124K. However, the price failed to maintain its momentum as it dropped below $110K in early-September.
By the end of September, the price of Bitcoin dropped further and touched a low around $108K.
In October, the price of Bitcoin crashed heavily below $110K. The price crashed further toward $84K in November.
Bitcoin ended December 2025 on a bearish note by trading below $90K.
Bitcoin price further dropped in January 2026 as it crashed toward $77K. In February, the price of BTC hit a low at $60K.
BTC price continued to face bearish pressure in March. However, it surged above $70K in early April. By the end of April, BTC price surged toward $80K.
By the end of May, the price of BTC dropped toward $73K. In June, BTC dropped toward $60K.
Ordinals developers say their technology will survive BIP-110, a proposed rule change that aims to stop people from storing files on Bitcoin. The fight comes down to one question. Should Bitcoin (BTC) handle only money, or anything users pay for?
Inscriptions let people store images and text on the Bitcoin blockchain, similar to NFTs. BIP-110 would block most of that data for one year. Supporters call it spam, while critics say Bitcoin should stay open to everyone.
What Would BIP-110 Change for Bitcoin?
Every Bitcoin transaction can carry a little extra data, and inscriptions use that space to store pictures and messages forever. The proposal would shrink the allowed space to 256 bytes per piece, about one short paragraph of text.
That limit would break the storage method inscriptions use today. The rule would last for one year, then switch off automatically, and old coins would not be affected.
Its author, who writes under the pen name Dathon Ohm, credits Bitcoin Knots maintainer Luke Dashjr for the first draft.
Miners vote by adding a small flag to the blocks they mine. The plan needs 1,109 flagged blocks out of 2,016 in a two-week window. However, the public monitor counted just three flagged blocks as of June 30, under 1%.
BIP-110 miner signaling chart showing 0.73% support versus the 55% activation threshold, alt text “BIP-110 signaling status”, Source: bip110.org monitor
Support has never passed 1% since voting opened in December 2025. The best two-week stretch reached 0.79% in mid-June.
Here is the twist. The plan does not need a majority to activate. From around early August, computers running the BIP-110 software will reject blocks that do not carry the flag.
Blockstream CEO Adam Back has warned of fork risk, meaning Bitcoin could split into two competing versions. MicroStrategy’s Michael Saylor called the plan a self-inflicted risk.
Dashjr, for his part, framed the stakes as existential on Thursday.
“If BIP110 fails, Bitcoin fails with it. I am not interested in any CBDC, much less an unregulated CBDC pretending to be decentralised,” he wrote.
A CBDC is a government-issued digital currency. In his view, a Bitcoin that cannot reject spam loses what makes it different.
Ordinals Developers Say They Are Ready
On July 2, Ordinals developer lifofifoX published a fix that stores data in a new way. It cuts files into small, allowed pieces instead of using the method that BIP-110 bans. In short, inscriptions would keep working even if the rule passes.
Ordinals creator Casey Rodarmor approved the fix the same day.
“Looks good to me! Let’s wait until BIP-110 activates to merge this,” Rodarmor wrote on GitHub.
The other side has already hit back, filing a counter-update to Bitcoin Knots, the software most BIP-110 supporters run. He argues the software simply does not notice the new format, letting it slip past the size checks.
Money sits at the center of the fight. In October 2024, Runes, a similar data-based format, drove a 32% fee increase that paid miners.
In contrast, supporters say the volunteers who run Bitcoin’s network computers must store all that data forever and get nothing for it.
The forced voting phase is about five weeks away. Back has already dismissed the August deadline as a path to a minority altcoin, a spinoff coin few would follow.
The coming weeks will show whether the miner’s silence means opposition or indifference.
Although July has only just begun, the past seven days brought some much-needed and long-awaited relief to the cryptocurrency market, even if the overall sentiment remains nothing but fragile.
Last week at this time, Bitcoin was still struggling around the $60,000 mark after the painful correction that was charted in June. The cryptocurrency spent the weekend moving mostly sideways, as neither bulls nor bears managed to take control.
The real action only started at the beginning of the business week. BTC attempted to recover, but was quickly rejected near $60,700, which allowed the sellers to push it lower. The pressure intensified on Tuesday, when Bitcoin, alongside the majority of the broader market, including the S&P500, the Nasdaq, as well as major tech stocks, took a beating. BTC dumped below $59,000 and slipped toward $58K on some exchanges, marking its intraweek low.
However, that support held firm. The cryptocurrency bounced back and quickly reclaimed $60,000. Later, it pushed toward $62,000 as buyers returned and spot Bitcoin ETFs finally saw renewed inflows after a brutal streak of outflows.
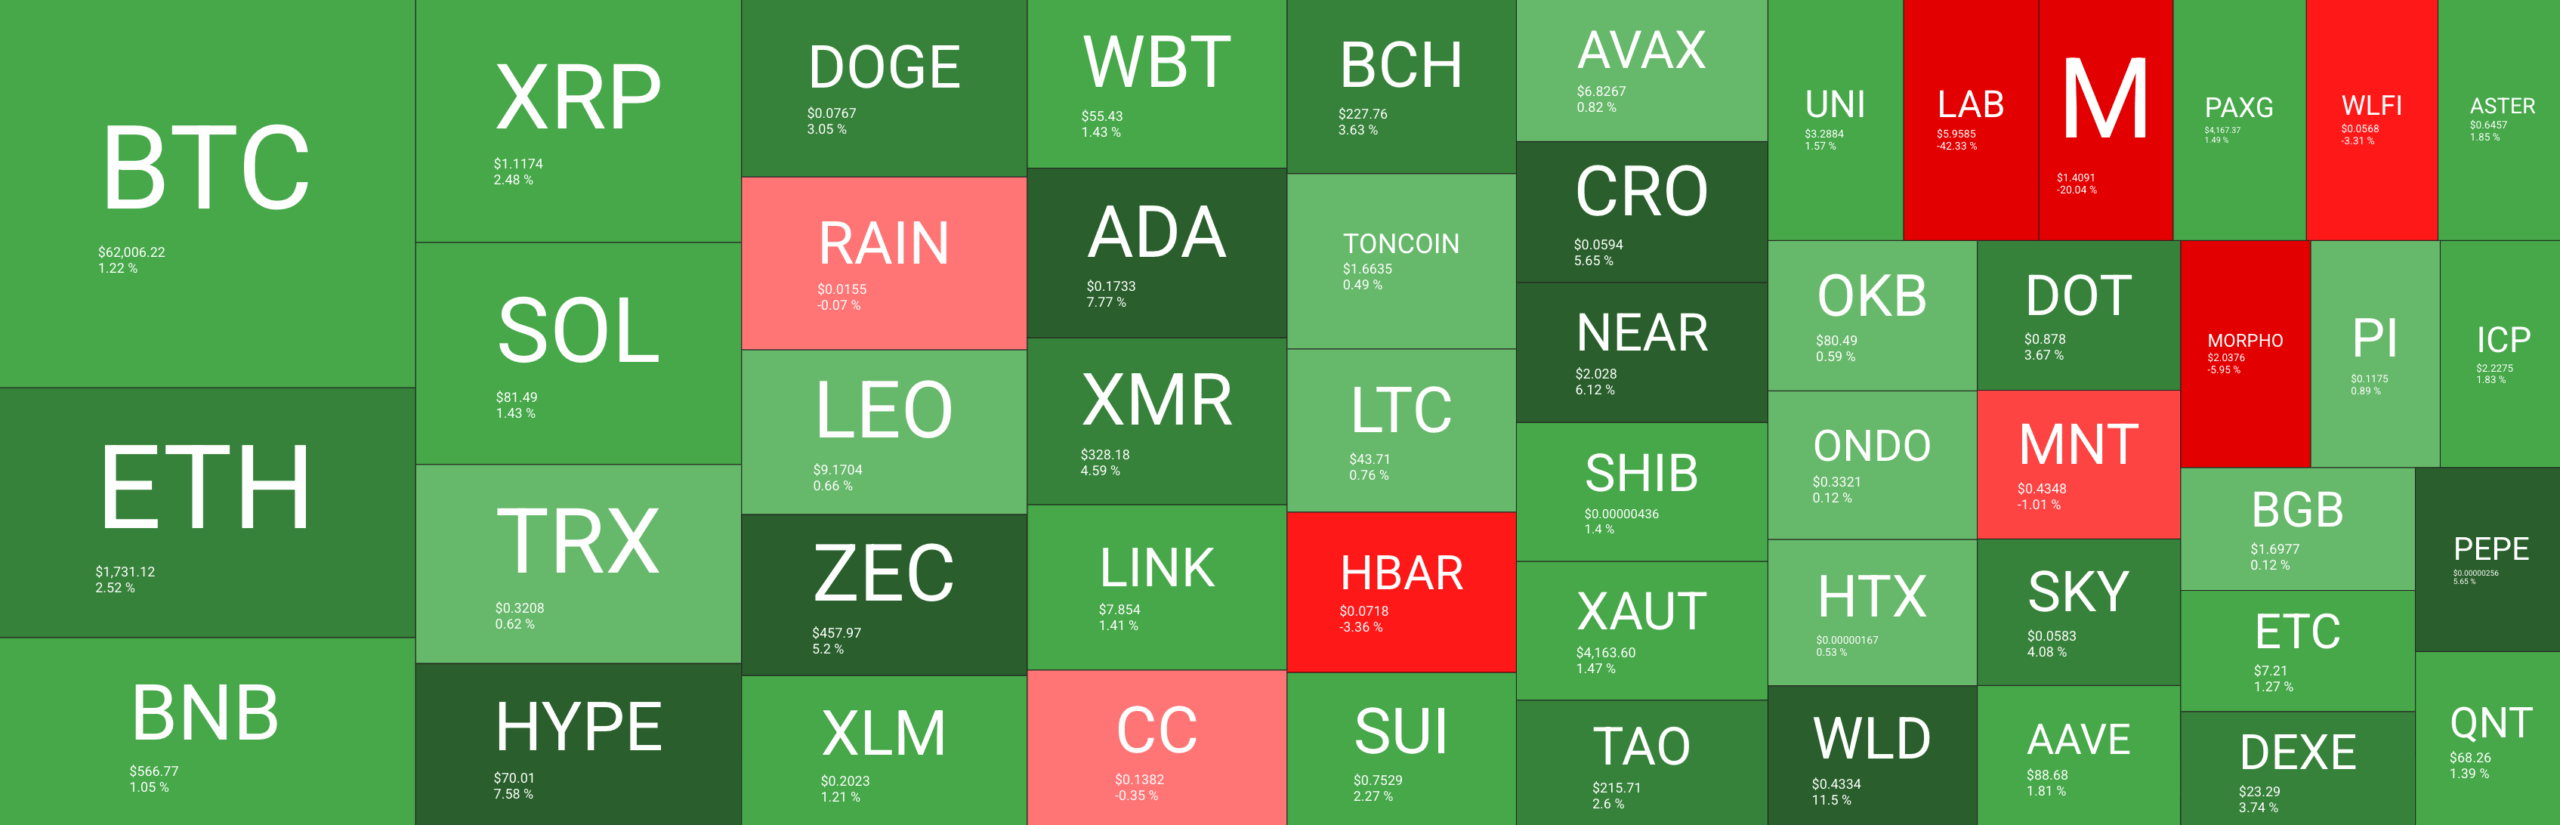
Altcoins were also able to follow, and some of them even marked sharper increases. ETH recovered strongly and moved back toward $1700, while SOL was among the best performers with a double-digit weekly jump. XRP, DOGE, ADA, XLM, and HYPE also joined the rebound, helping the total crypto market cap recover some of its recent losses.
The week was also packed with some major headlines. Donald Trump’s latest financial disclosure showed that he holds more than $50 million in Bitcoin, reigniting strong debates. FBI Director Kash Patel also amended a disclosure that was associated with Strategy’s stock, while Securitize made its NYSE debut and launched tokenized shares on Solana and Avalanche.
Overall, the bulls were finally able to stop the bleeding. However, this doesn’t mean that the worst is over. BTC still needs a decisive breakout above pivotal levels around $70K to prove that this was more than just a slight dead cat bounce.
Tokenized Stocks Emerge as Altcoin Lifeline Amid Crypto Market Reset. A new report argued that tokenized stocks are becoming one of crypto’s few bright spots, as persistent token unlocks and weak altcoin narratives continue to wear speculative assets down. The analyst also outlined that Solana is currently dominating tokenized equity trading alongside Hyperliquid’s HIP-3.
Why Bitwise’s Matt Hougan Thinks Strategy’s Bitcoin Era Is Fading. The CEO of Bitwise, Matt Hougan, said that Strategy’s role as one of the largest corporate buyers of Bitcoin is likely going to fade, especially as the next cycle could be led by institutions such as banks, asset managers, pension funds, and sovereign wealth funds.
Standard Chartered Becomes First Major Bank to Offer Direct Stablecoin Services. Standard Chartered became the very first major global bank to offer direct USDC minting and redemption services to institutional clients through its banking platform. The service was launched with Circle in Dubai’s DIFC.
Can Circle Defend Its Stablecoin Lead Against OpenUSD? Experts Weigh In. Experts, on the other hand, warned that Circle itself might be facing one of its toughest challenges yet from OpenUSD – a new stablecoin backed by major financial and payments firms such as Visa, Mastercard, BlackRock, and Coinbase.
UK Investors Sue Binance and Former CEO Changpeng Zhao for $200M. A group of 1,700 UK investors sued Binance and its former CEO – Changpeng Zhao – in London’s High Court. The plaintiffs seek roughly $200 million in damages, claiming that the exchange sold unauthorized derivatives products.
The Vanishing Bitcoin Bid: Where Are the ETF Billions Going? HashKey research Tim Sun told us that Bitcoin’s recent ETF outflows may reflect capital rotating into AI, semiconductors, and GPU-related stocks rather than a complete collapse in risk appetite.
JPMorgan Chase & Co. is concerned that Strategy’s new policy of selectively selling its Bitcoin holdings will introduce new risk to the crypto market.
On Monday, Strategy announced a BTC monetization program through which the company can sell a portion of its 847,363 BTC holdings to support its preferred dividend payments and buybacks.
The so-called Digital Credit Capital Framework followed months of criticism of Strategy’s capital position amid declines in the price of BTC and MSTR.
JPMorgan said the policy adds avoidable “two-way” flow risk to crypto markets.
In a Wednesday report, JPMorgan analysts led by Nikolaos Panigirtzoglou said Strategy has spent years as one of Bitcoin’s most consistent buyers, accounting for about 70% of total net digital asset inflows this year.
The policy, as such, introduces a new risk that the biggest BTC buyer could sell off its holdings at any moment.
Strategy should raise 24 to 36 months of cash reserve
JPMorgan suggests that Strategy raise its cash reserve by issuing common equity to shore up investors’ confidence that it won’t need to sell its Bitcoin holdings.
Strategy currently holds $2.55 billion in cash, enough to cover about 17 months of preferred dividend and interest obligations. The analysts believe the buffer is not wide enough.
They said, “a higher coverage of 24-36 months would be needed to make investors more comfortable with the idea that Strategy would not need to sell bitcoins in the foreseeable future.”
Analysts split on what comes next
Not everyone at the research desks shares JPMorgan’s caution. Benchmark Equity Research reiterated a Buy rating on MSTR with a $570 price target, implying more than 500% upside from recent levels, following the sales policy.
Analyst Mark Palmer called the capital framework “formal permission” to put Strategy’s capital machine into reverse during periods of market stress, framing it as a net positive for shareholders, as Cryptopolitan reported.
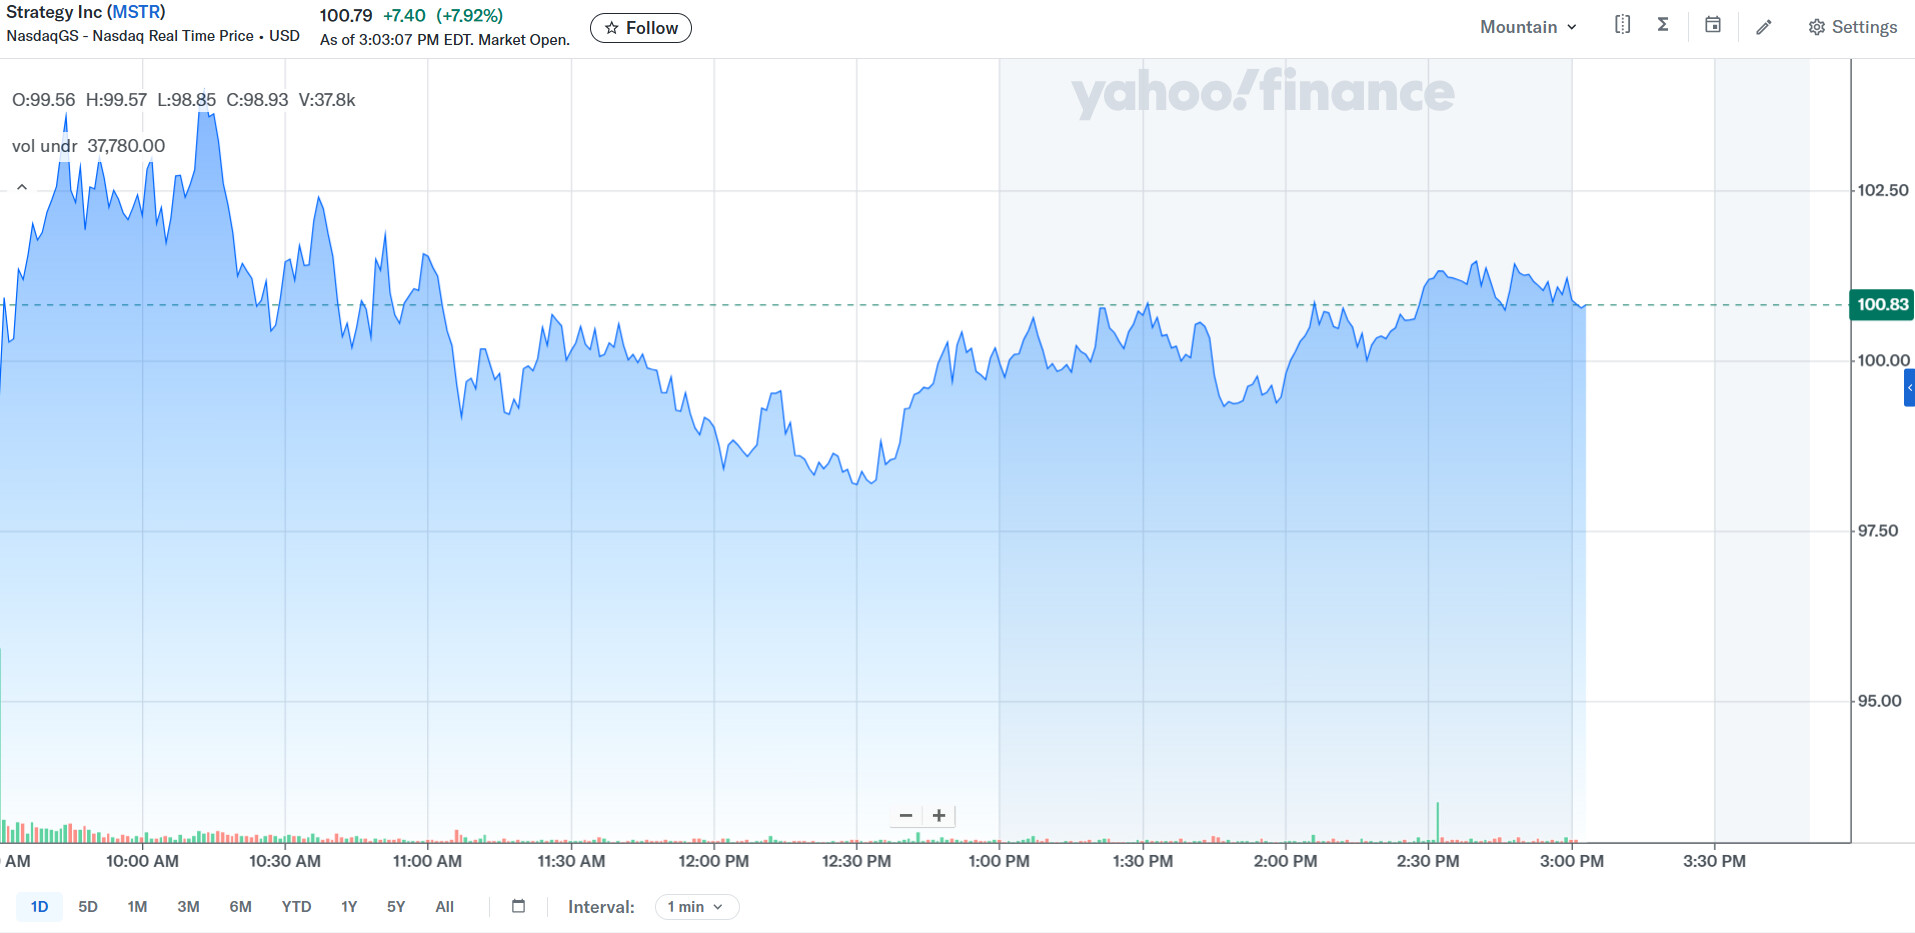
Meanwhile, the MSTR price has made gains since the policy. The shares rose 12.6% to $92.68 on Monday, while STRC gained roughly 10% to around $83.67 after trading below $75 the previous week.
By Wednesday, MSTR had pushed past $100, adding $5 billion in market cap and climbing 27% from Friday’s low.
At the time of writing, MSTR was trading at $100.83, a 7.93% increase on the day.
Bitcoin is entering the second half of the year with its support system, which powered its last rally, under pressure.
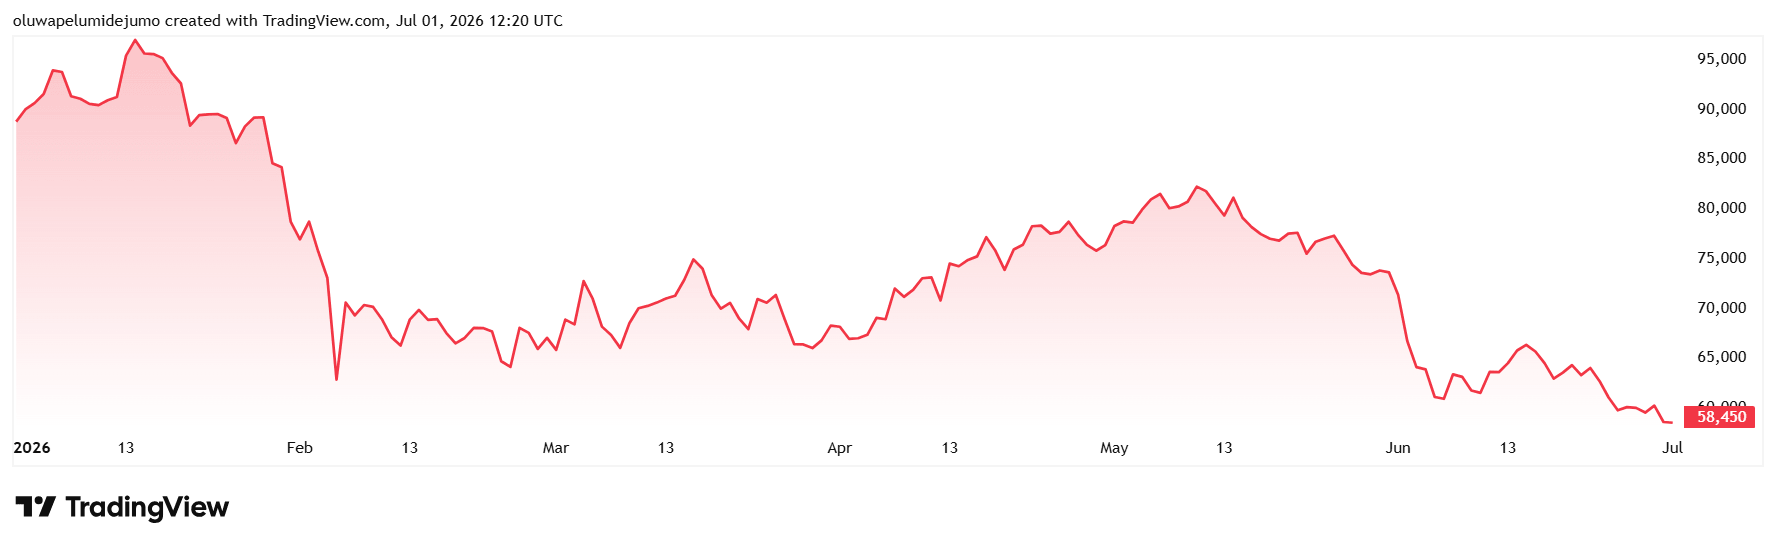
Data from CryptoSlate shows that the largest digital asset has fallen about 33% this year and more than 50% from its October record high above $126,000, trading near its weakest level since September 2024 at around $58,600 as of press time.
Bitcoin Price Performance in H1 2026 (Source: Tradingview)
That makes July a test of whether the market is nearing exhaustion or beginning another leg lower. The next four weeks bring three pressure points: whether exchange-traded fund outflows slow, whether the Federal Reserve signals another rate increase, and whether Congress can move the CLARITY Act before the August recess.
The outcome could determine whether Bitcoin rebounds toward $100,000 by year-end or retests the $50,000 to $55,000 area, which analysts now see as the next major structural support zone.
ETF demand has flipped from cushion to pressure
ETF flows have become one of the clearest signs that Bitcoin’s institutional support is weakening.
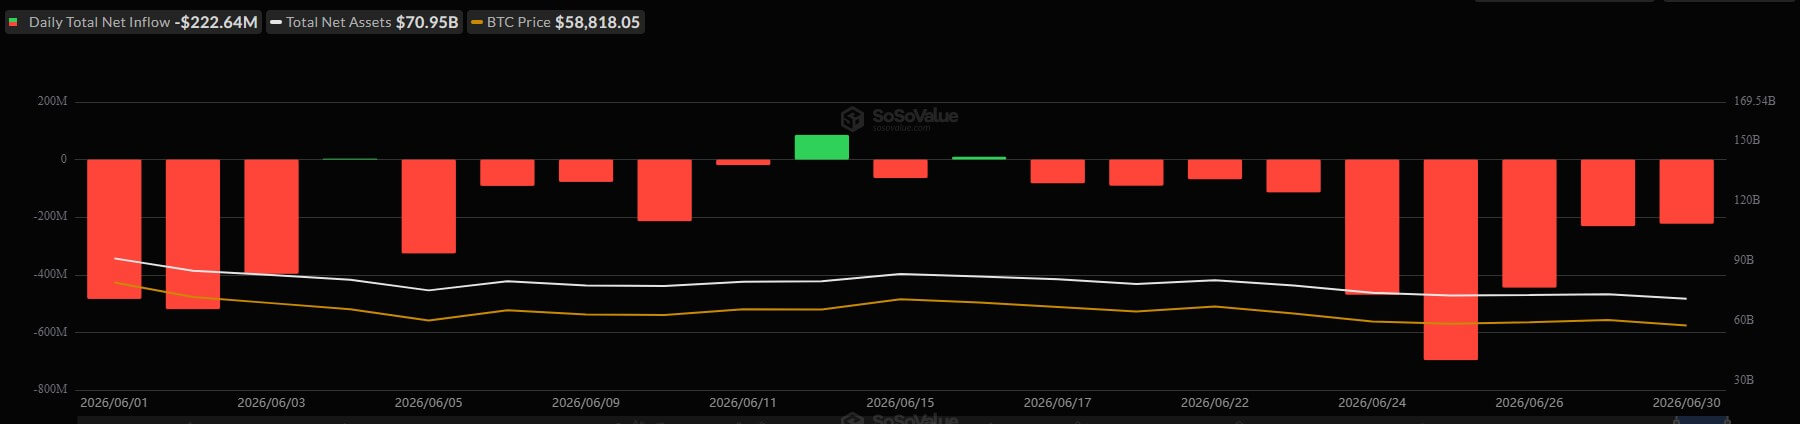
Data from SoSoValue show US spot Bitcoin ETFs posted about $4.5 billion in net outflows in June, their worst month since the products began trading in January 2024.
BlackRock’s IBIT accounted for most of the withdrawals, underscoring how the largest regulated demand channel for Bitcoin has become a source of sustained selling pressure.
The weakness was spread across the month rather than concentrated in a single trading session. Spot Bitcoin ETFs recorded only three days of inflows in June, with those positive days totaling less than $100 million combined.
Bitcoin ETFs Daily Flows in June 2026 (Source: SoSoValue)
The rest of the month was dominated by redemptions, including several sessions in which hundreds of millions of dollars left the products.
That pressure followed Bitcoin below the $60,000 area and challenged one of the central assumptions behind the ETF-led phase of the market: that regulated funds would provide a steadier base of demand during drawdowns.
Ecoinometrics, a Bitcoin analysis platform, said the decline was consistent with the pressure visible in fund flows, noting that:
“Bitcoin below $60K shouldn’t surprise anyone watching ETF flows. The last 30 days have seen some spectacular days of selling. But they’ve really been defined by relentless selling.”
The firm said nearly every recent trading session had seen capital exit spot Bitcoin ETFs, creating one of the most persistent stretches of outflows since the funds launched. It added:
“That’s the kind of demand shock that keeps pushing prices lower.”
However, the withdrawals do not necessarily point to panic selling.
This is because many ETF investors entered the market at lower prices and may be taking profits or cutting exposure after Bitcoin’s sharp advance last year. But the persistence of the outflows shows that institutional investors are not yet stepping in to absorb the decline.
That marks a clear shift from the earlier stage of the cycle, when ETF demand helped pull Bitcoin deeper into mainstream portfolios and supplied a visible stream of new capital. In June, the same structure showed how quickly large allocators can retreat when prices weaken, macro conditions tighten and momentum fades.
The market is now treating ETF flows as a better gauge of confidence in the top crypto.
So, a return to steady inflows would suggest institutional buyers are willing to rebuild exposure after the drawdown.
But continued redemptions would leave Bitcoin more dependent on long-term holders and less protected by Wall Street demand heading into the second half of the year.
The Fed has removed the rate-cut trade
The ETF retreat is happening just as the rate-cut narrative that carried much of the early-year optimism has broken down.
The Federal Reserve held interest rates steady at its June meeting, but the decision itself was not the market-moving part. The tone was.
Under Chair Kevin Warsh, policymakers have shifted toward a more hawkish stance as inflation remains above target and tariff-related price pressure continues to show up in consumer data.
That has forced traders to reprice the second half of the year. Rate relief, which many crypto investors expected to arrive under a Trump-appointed Fed chair, is no longer the base case. Markets are now considering the possibility that the next move could be a hike rather than a cut.
That shift matters for Bitcoin because the asset does not pay yield.
When Treasury yields rise and the dollar strengthens, investors have less incentive to hold assets whose value depends heavily on liquidity expectations. Bitcoin is absorbing that pressure even as its ETF channel sees redemptions.
The Fed’s change in tone also undercuts one of the market’s earlier assumptions about Warsh. Many crypto investors expected him to lean dovish because President Donald Trump had long pushed for lower rates.
However, that expectation was never as firm as the market treated it. Surveys had suggested only a narrow lean toward dovishness on rates, while many investors expected Warsh to take a tougher stance on the Fed’s balance sheet and preserve some independence from the White House.
The June meeting forced a reset. In March, policymakers were still leaning toward one or two cuts by year-end. By June, the median projection had shifted toward a possible hike, even though the committee remained divided.
That leaves Bitcoin without the macro support many investors expected heading into the summer.
Financial conditions are not easing, the dollar has firmed, and Treasury yields have moved back toward recent highs. For an asset still treated by many allocators as a high-beta liquidity trade, that is a difficult backdrop.
Strategy’s shift raises questions over BTC treasury demand
Meanwhile, market pressure has also spread to the corporate Bitcoin treasury trade, where Strategy’s first sale in years drew attention well beyond the transaction’s size.
Strategy (formerly MicroStrategy) disclosed in May that it sold 32 Bitcoins, worth about $2.5 million. The sale represented only a small fraction of its holdings and did little to alter the company’s overall exposure.
However, the larger concern was the signal it sent to a market that has long viewed Strategy as Bitcoin’s most committed corporate buyer.
For much of the cycle, Strategy stood for a straightforward trade: raise capital, buy Bitcoin and hold through volatility. That made the company an important reference point for investors, especially as spot ETF inflows and corporate treasury purchases reinforced each other.
The company later reinforced that shift, saying it could sell part of its Bitcoin holdings to strengthen its balance sheet, support its perpetual preferred securities and fund stock repurchases.
The statement gave investors a clearer view of how management could balance Bitcoin exposure against liquidity needs, financing costs and shareholder returns.
Strategy remains closely tied to Bitcoin. Its holdings remain large, and one small sale after years of purchases does not change the market’s supply balance.
Still, the company’s new flexibility has raised a broader question of whether Bitcoin treasury companies will continue to act as steady buyers if prices remain weak and funding conditions tighten.
That question has become more important as Strategy adjusts its financing structure, dividend commitments and reserve policy.
The framework could make the company more resilient by improving liquidity and reducing balance-sheet strain. It also gives management more room to prioritize financial discipline over constant Bitcoin purchases.
For a market already under pressure from ETF outflows, the shift adds another source of uncertainty. Stable corporate holders could help absorb weakness. Slower buying or further deleveraging would remove part of the demand base that supported Bitcoin’s previous advance.
Over the past year, hedge funds, asset managers and wealth advisers have poured into AI-linked stocks as investors search for exposure to one of the fastest-growing themes in global markets.
The demand has spilled into new listings, derivatives and exchange-traded products tied to companies seen as beneficiaries of the AI buildout.
That appetite has kept risk-taking alive across parts of Wall Street. But much of the money is moving toward chipmakers, data-center operators, software companies and other firms with a clearer earnings link to AI infrastructure, rather than into crypto.
The split complicates Bitcoin’s market signal. Its decline is not due to investors abandoning risk altogether. Capital is still moving into speculative areas, but Bitcoin is no longer the main destination.
AI offers investors a more immediate corporate growth story as large technology companies continue to spend heavily on chips, cloud capacity and data centers.
Bitcoin, by contrast, is entering the second half of the year with weaker ETF flows, policy uncertainty and renewed questions about corporate treasury demand.
That divergence has left Bitcoin outside a rally in other high-growth assets. If AI continues to absorb capital through the summer, Bitcoin may need a stronger catalyst than lower prices to regain investor attention.
CLARITY Act becomes July’s policy catalyst
After a first half shaped by ETF outflows, renewed rate pressure and questions over corporate Bitcoin buyers, the Senate calendar has become one of crypto’s few near-term openings for a shift in sentiment.
The CLARITY Act would create a federal market structure framework for digital assets and define the roles of the Securities and Exchange Commission (SEC) and the Commodity Futures Trading Commission (CFTC).
Its passage would give exchanges, banks, asset managers and token issuers a clearer basis for building products and expanding services in the US.
A delay or failure would leave the industry facing the same regulatory uncertainty that has weighed on investment, product development and market confidence for years.
The timing is tight because US Senate leaders have only a narrow window before the August recess, while lawmakers still need to reconcile committee versions, address Democratic concerns over ethics and illicit-finance provisions, and secure enough votes to move the bill through the chamber.
That makes July a key test for the market. If the bill advances, Bitcoin could gain a policy catalyst at a time when ETF redemptions and macro conditions are weighing on risk appetite.
However, if the effort slips into the fall, one of the clearest sources of potential positive sentiment in the second half would fade.
In view of this, Thomas Perfumo, Kraken’s Chief Economist, described the CLARITY Act as the catalyst to watch over the next four weeks, saying passage could help restore sentiment and momentum.
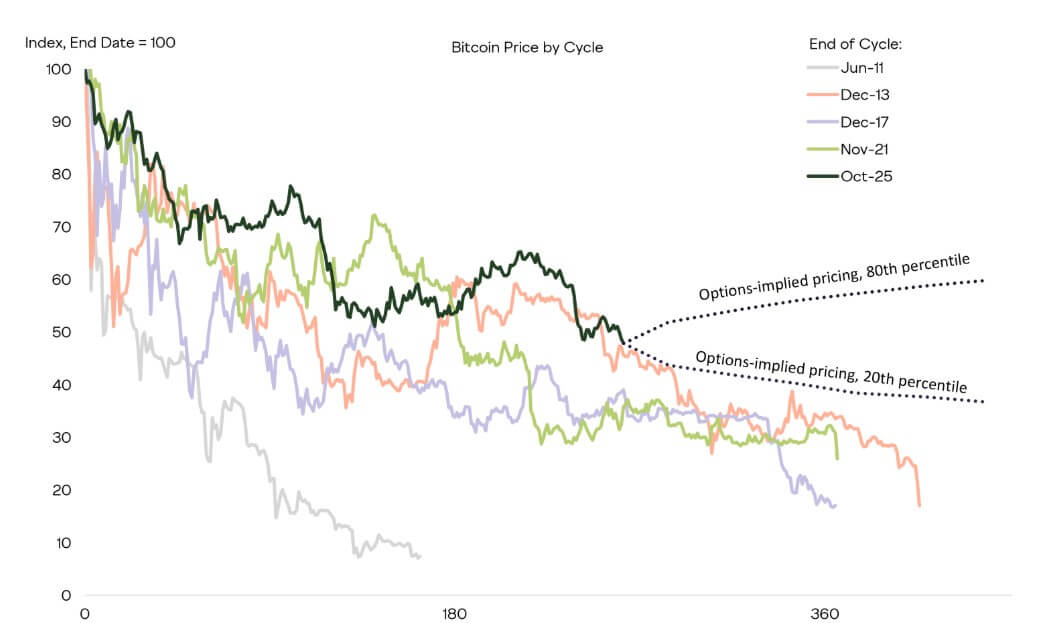
Bitcoin’s Potential Price Path if CLARITY is Passed (Source: Grayscale)
Notably, Grayscale has also tied the bill to Bitcoin’s near-term path, placing it alongside Strategy’s balance-sheet decisions and the Fed’s rate outlook as factors that could determine whether BTC is nearing a low or remains exposed to further losses.


![BIP-110 miner signaling chart showing 0.73% support versus the 55% activation threshold, alt text "BIP-110 signaling status", Source: bip110.org monitor]](https://assets.beincrypto.com/img/GJ1DRFXeu_YsEAf0OHhV94kA7XI=/smart/5d346e32f0f14407929adb14c63400da)