Following the recent uptick in altcoin prices, conversations about the potential start of an altseason are gaining significant momentum. Interestingly, recent on-chain data about the rising altcoin trading volume has added some weight to the altseason discussions.
Altcoin Trading Volume Climbs Above Yearly Average
In a recent Quicktake post on the CryptoQuant platform, CryptoOnchain revealed a critical change in the altcoin market. Citing the “CEX Volume Ratio: Others vs Top 5” metric, the market analyst explained that the altcoin trading volume has been in an uptrend lately.
The “CEX Volume Ratio: Others vs Top 5” metric tracks how much trading volume is flowing into altcoins outside the top 5, relative to the combined volume of the top 5 assets. As such, it plays a key role in identifying the extent of capital rotation and whether altcoins have started to gain strength.
According to CryptoOnchain, the 30-day moving average of altcoin trading volume has now climbed past its 365-day moving average. This trend, explained the analyst, shows that the volume of this sub-asset class is steadily increasing.
Higher readings in the CEX Volume Ratio: Others vs. Top 5 are telltale signs that traders are leaning towards smaller altcoins rather than into major cryptocurrencies (Bitcoin, Ethereum, Solana, XRP, and BNB). This, in turn, is interpreted as growing risk appetite, which could positively influence an altcoin rally.
The market analyst cited historical data, noting that instances where the signals flashed mostly reflected short-term volume growth relative to the long-term baseline. These cases have also signaled “clear rotation of capital from major caps into mid and low-cap altcoins.”
For example, during the 2021 bull cycle, repeated clusters of these signals coincided with explosive rallies across the altcoins’ sector, alongside a major price appreciation in Ethereum.
Notably, the chart shared by CryptoOnchain shows the purple “Volume Ratio” line gradually strengthening again after a period of weakness. The analyst noted that a breakout in the ratio could precede high-volatility periods, potentially increasing the likelihood of an altcoin market rally.
Ethereum Stability Could Confirm Imminent Altcoin Rally
CryptoOnchain further explained that the reinvigoration of the altcoin trading volume could be a sign that “retail and institutional interest is expanding beyond the top 5 assets.” However, this does not necessarily translate to bullish news for the altcoin market.
According to the crypto pundit, confirmation from Ethereum’s price action might be necessary to determine the market’s inner dynamics.
CryptoOnchain explained:
If this momentum is sustained and accompanied by a stable or rising ETH price, it could serve as a strong confirmation that a broader altcoin rally is underway.
As of press time, the Ethereum price stands at $2,329, up 1% over the past 24 hours, according to CoinGecko data.
The price of Bitcoin has been relatively stable since the start of April, showing strong efforts to reclaim former highs. In its latest recovery attempt, the premier cryptocurrency finally returned above $80,000 for the first time since early February.
Unsurprisingly, a relevant group of network participants, known as Bitcoin miners, appears to be taking advantage of the steady rise in BTC’s value over the past few weeks. Interestingly, a continuation of this profit-taking trend could pose an obstacle to the market leader’s recovery.
Miners’ Profit-Taking Could Halt BTC’s Recovery
In a May 8th post on the X platform, crypto analyst Ali Martinez shared that Bitcoin miners’ behavior has shifted in recent weeks. The latest on-chain data shows that this group of network participants has been booking profits, as the price of BTC steadily climbed to a local high.
Highlighting changes in the Miner Reserves metric, which measures the total Bitcoin held in miner-affiliated addresses, Martinez revealed that about 3,400 BTC have been sent from addresses associated with network validators since April 7. Interestingly, this period has coincided with the coin’s price rising from $72,000 to around $82,790, further supporting the profit-taking hypothesis.
The analyst wrote on X:
Back then, Bitcoin was trading near $72,000. Through the recent climb toward yesterday’s peak of $82,790, which represents a 15% price increase, miners have been steadily booking profits. On-chain data shows that miners have offloaded approximately 3,400 $BTC during this run, taking advantage of the recent price expansion to cover operational costs or lock in gains at multi-month highs.
Typically, falling Miner Reserves indicate that miners are distributing their coin to take profit, often to cover costs. As seen with several firms pivoting toward AI data centers, the profitability of the Bitcoin mining industry has been under significant pressure over the past few years.
More pertinently, the latest profit-taking and selling pressure can pose a threat to the ongoing recovery in Bitcoin’s price. The flagship cryptocurrency, which appears to have slowed down over the past day, would need uninterrupted bullish momentum to continue its current upside rally.
Bitcoin Price At A Glance
As of this writing, the price of BTC stands at around $80,287, reflecting a mere 0.8% leap in the past 24 hours. Meanwhile, the market leader’s value has risen about 3% over the past seven days.
Chainlink (LINK) has been trading in a tight range between $9 and $9.50 over the past week, but one technical indicator suggests that the consolidation may be replaced by heightened volatility in the near future.
The recent whale accumulation and other bullish elements point to a higher probability of an upward move.
Prepare for Potential Turbulence
Several hours ago, the renowned analyst Ali Martinez disclosed that LINK’s Bollinger Bands have squeezed on the 3-day chart. The metric, developed by John Bollinger in the 1980s, uses a moving average flanked by two channels (upper and lower) that widen in volatile markets and narrow when things calm down. Squeezing the bands usually foreshadows a major move, but it offers no clarity on whether a rally or pullback is on the horizon.
The majority of analysts who have touched on the asset lately believe an upside is the more likely option. X user Celal Kucuker claimed that LINK’s graph looks “solid and strong,” envisioning a pump to $100 during the next bull market.
For their part, CRYPTOWZRD suggested that the asset could be at a crossroads as its performance remains deeply correlated to Bitcoin’s price action.
“Above $9.55, we’ll see a further bullish move. Below, random movement will take place,” they predicted.
The Whales Step in
X user CryptoBusy revealed that whales (investors holding over 1 million LINK tokens each) have increased their exposure recently. As explained by the analyst, this move aligns with the latest real-world asset developments surrounding Chainlink and is a pattern historically linked to regime shifts.
Such accumulation is typically viewed as bullish for the price because it signals strong conviction from the big holders, which can encourage smaller players to follow their lead. It is important to note that whales are known as experienced, better-informed investors, suggesting they may be preparing for upcoming news that could positively impact LINK’s valuation.
The declining amount of tokens stored on exchanges is another factor that may favor the bulls. Earlier this week, LINK saw its largest daily net outflow since December of 2025. When investors move their holdings into self-custody, those tokens are less likely to be sold quickly. This, in turn, creates conditions that can support a possible price increase.
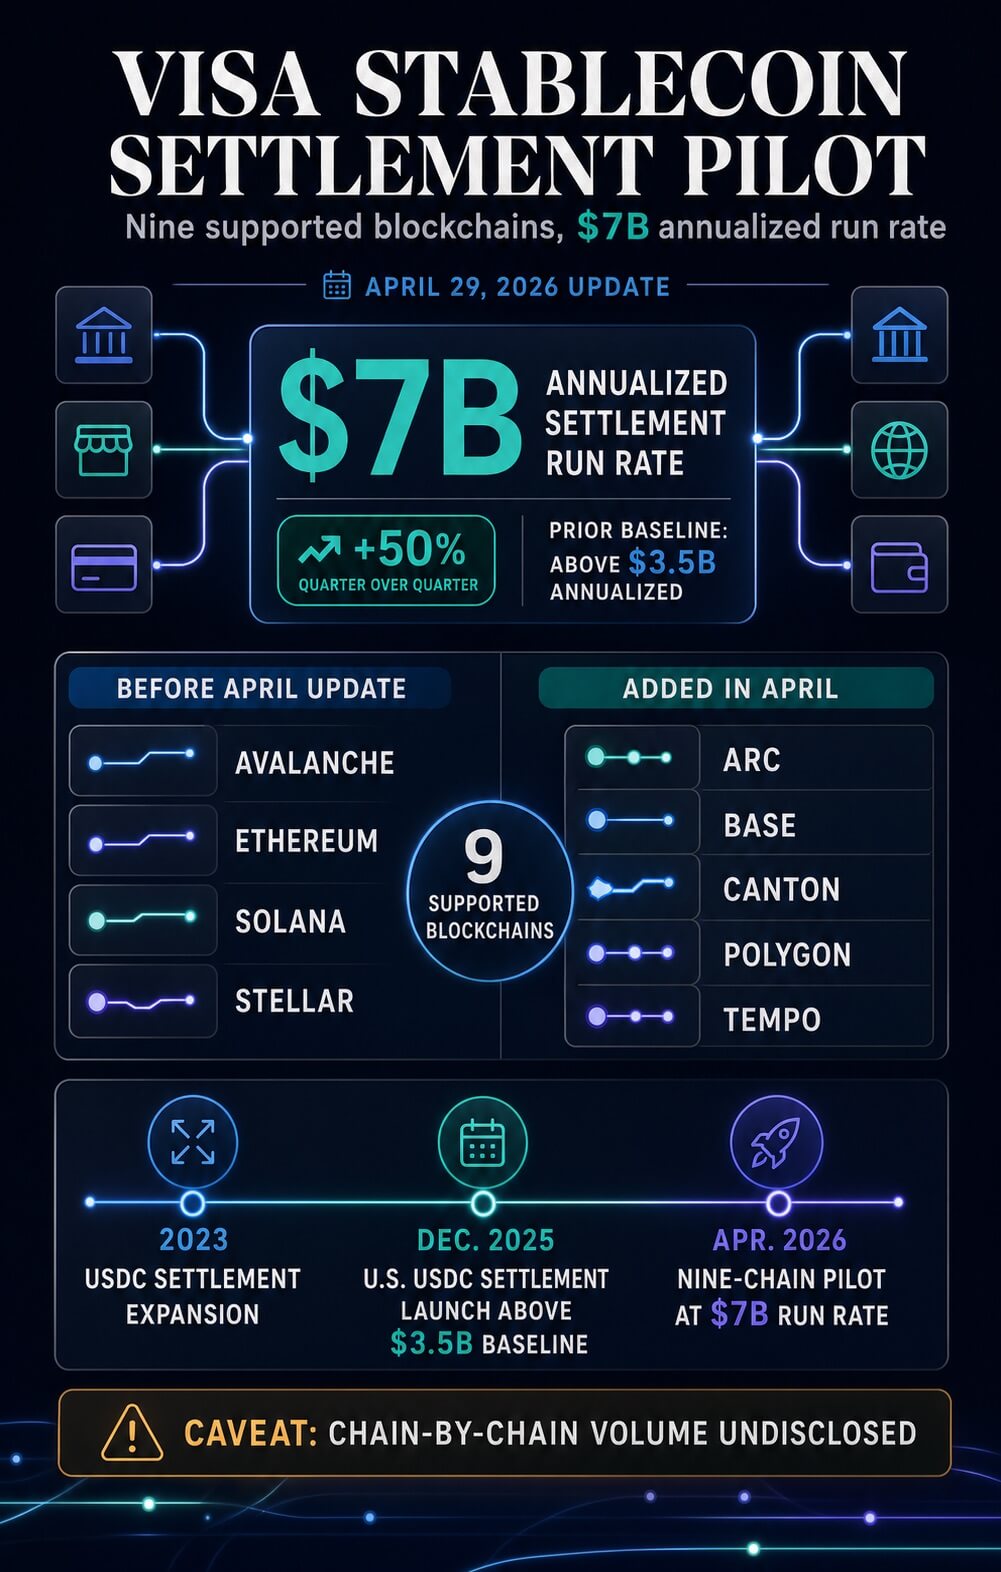
Visa said its settlement pilot for stablecoins now supports nine blockchains and has reached a run rate of $7 billion a year.
The company announced on April 29 that it added Arc, Base, Canton, Polygon and Tempo to a pilot that already used Avalanche, Ethereum, Solana and Stellar.
Visa said the annualized settlement run rate is up 50% from the prior quarter.
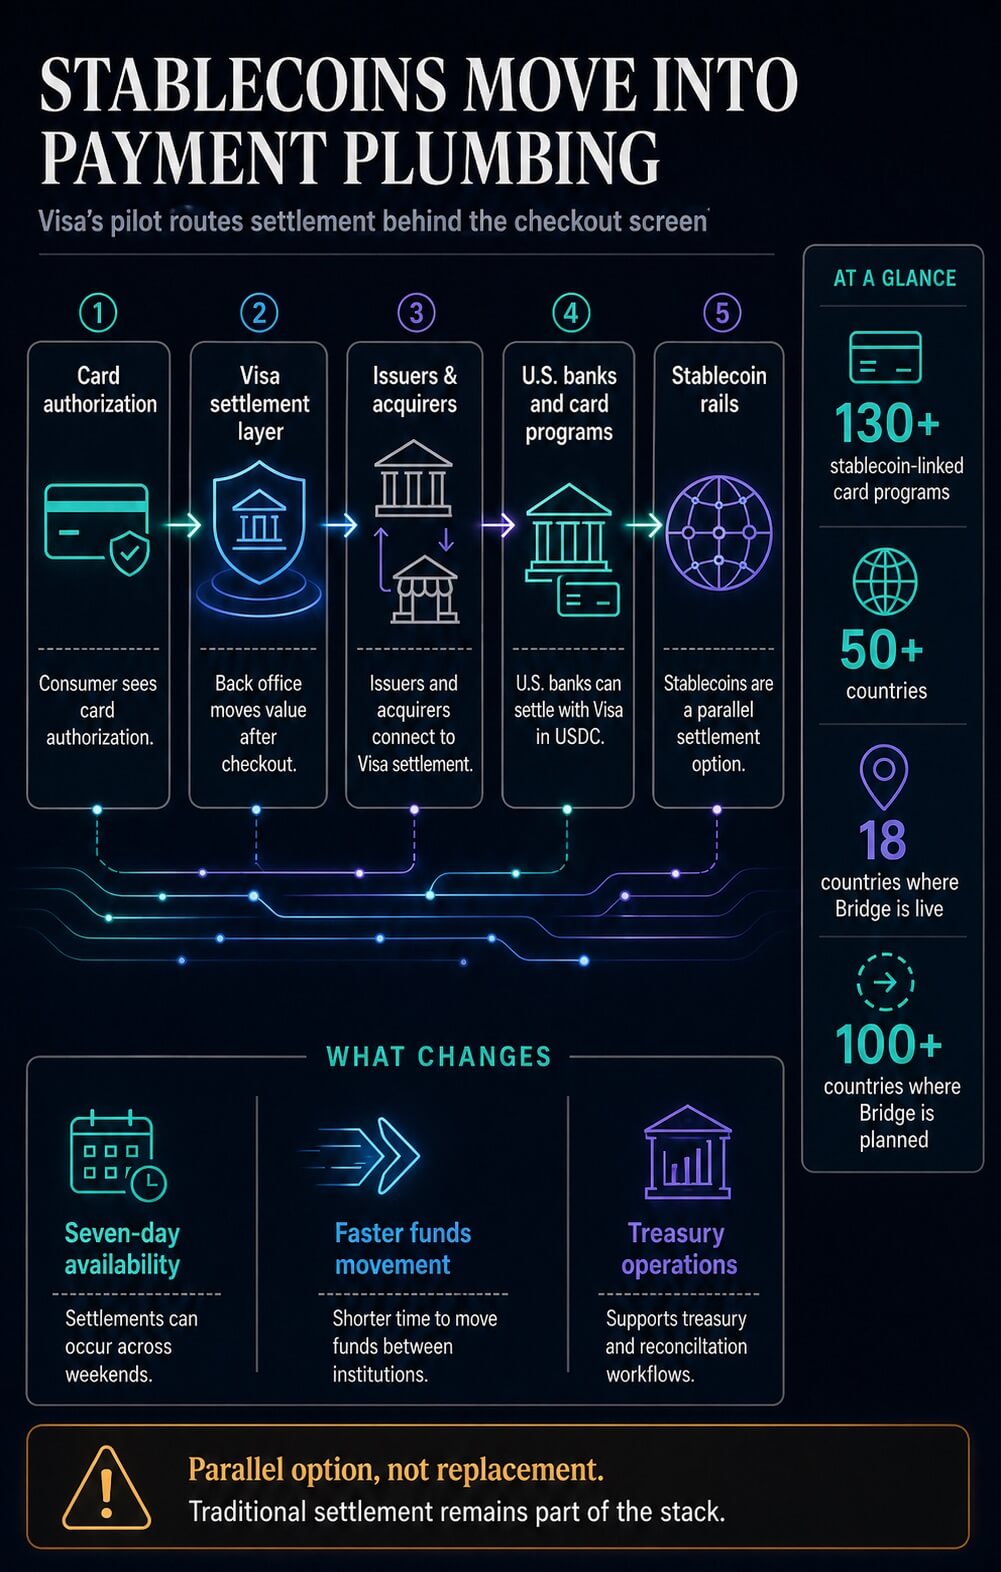
The pilot remains bounded by Visa’s own language, but the signal is in where the volume sits. Stablecoins are entering the part of payments consumers rarely see, the settlement layer that moves value between issuers, acquirers, banks, program managers and treasury systems after a transaction has already been authorized.
That makes the update a settlement-infrastructure signal as much as a blockchain support list. Visa is testing whether stablecoins can become a parallel settlement option inside payment infrastructure that already touches banks, card programs and merchants across markets.
The operational point is direct: crypto adoption is moving into the back office before it becomes visible at the checkout screen.
The conclusion has limits. The company described a pilot and support, gave a run rate for stablecoin settlement, and left the split by chain, stablecoin, partner, and geography undisclosed.
That keeps things bounded: the network is adding optional settlement rails, while traditional settlement remains part of the stack.
Visa has been building toward this point for several years. In 2023, the company said it had moved millions of USDC between partners over Solana and Ethereum to settle fiat-denominated VisaNet payments.
That announcement followed an earlier Crypto.com issuer pilot and expanded the settlement work to merchant acquirers Worldpay and Nuvei.
The operational issue is familiar in card payments. A consumer gets near-instant authorization at the point of sale, but funds still have to move between the issuing bank and the merchant’s bank.
Visa’s treasury and settlement systems sit inside that process, moving value across currencies and institutions.
In December 2025, U.S. issuer and acquirer partners gained the ability to settle with Visa in USDC, with Cross River Bank and Lead Bank initially settling over Solana.
The company cited faster funds movement, seven-day availability, and resilience across weekends and holidays.
The April release also connected the chain expansion to Visa’s stablecoin-linked card programs, which it said numbered more than 130 programs across more than 50 countries.
That makes the nine-chain footprint part of a broader payment operating model, beyond a ledger experiment.
The new run rate gives that timeline a sharper shape. The December 2025 U.S. launch put the prior annualized stablecoin settlement baseline above $3.5 billion.
The April update puts the run rate at $7 billion, with five more blockchains added to the pilot.
Before the April update
Added in April
Operational signal
Avalanche, Ethereum, Solana, Stellar
Arc, Base, Canton, Polygon, Tempo
Visa is widening the settlement pilot across public chains, payment-focused networks and institution-oriented infrastructure.
The table serves as a footprint rather than a volume map. The run rate applies to the pilot as a whole; the available disclosure leaves that volume undivided across the nine supported networks.
The sequence also shows a shift in who the product is for. The early work proved that USDC could move between card ecosystem participants.
The current phase asks whether the same settlement logic can be offered across a wider menu of rails while reducing the need for each partner to build separate crypto operations from scratch.
What the chain mix shows
The five additions suggest the types of environments Visa wants available to partners.
Arc is a stablecoin-native Layer 1 created by Circle. It brings USDC-denominated fees, optional privacy, sub-second deterministic finality and direct integration with Circle’s stack.
That makes Arc relevant to payment flows where predictable costs, stablecoin liquidity and transfer guarantees count more than token speculation.
Arc’s public materials also describe public testnet status, which keeps production claims bounded.
Base brings a different route into the same problem. Visa described Base as powered by Coinbase, while Base offers USDC payments that settle in seconds, use low gas costs and can be funded from a Base Account or Coinbase Account.
Base connects wallets, payment tooling, and exchange-linked liquidity into a consumer and developer surface.
Canton adds the institutional privacy layer. Visa had already said in March that it would become a Canton Super Validator, helping banks and financial institutions explore privacy-preserving payments, settlement and treasury use cases.
Canton centers stablecoin payments on need-to-know privacy, so counterparties, amounts and strategies can remain visible only to the parties that need them, unlike many open blockchains.
As an analytical reading of the chain mix, Polygon and Tempo fit the payment-infrastructure side of the roster. Polygon emphasizes global payments, stablecoin liquidity and lower-cost transactions.
Tempo emphasizes dedicated payment lanes, stablecoin-native gas, payment metadata for reconciliation and deterministic settlement.
Together, the additions create a wider operating menu across chain types. One partner may need low-cost stablecoin movement.
Another may need privacy controls for regulated finance. Another may value Coinbase-connected payment tooling.
Visa’s role is to make those differences usable through a common settlement layer.
The result is a portfolio of settlement options across chain types. That portfolio lets Visa present stablecoins as infrastructure that can adapt to partner constraints, from regulated privacy to low-cost throughput, while keeping the payment-network relationship in the center.
The adoption signal is operational
The broader market context supports the shift while keeping price moves out of the frame. As of April 30, the crypto market stood at around $2.55 trillion, while DefiLlama put total stablecoin market capitalization at around $319.802 billion.
USDC sits in that context as a core settlement asset used for payments, treasury management, collateral, and cross-chain liquidity.
Ethereum, Solana, and Polygon Ecosystem Token are large or payment-relevant networks and tokens that can carry settlement infrastructure while keeping price data in the background.
Stablecoins already have enough liquidity and operating history for large payment networks to treat them as infrastructure options.
The adoption test shifts from whether a consumer chooses a wallet over a card to whether payment firms can use stablecoins to move value after the customer-facing transaction is done.
The market-side thesis has been building. A January analysis of BlackRock’s stablecoin thesis argued that dollar tokens were shifting from trading utility to settlement infrastructure within and alongside traditional finance.
Visa’s update provides a current operating example for that thesis. The company is connecting stablecoin settlement to issuers, acquirers, U.S. banks, and stablecoin-linked card programs.
Its March expansion with Bridge said stablecoin-linked Visa cards were live in 18 countries, with planned expansion to more than 100 countries.
That release also said issuers and acquirers involved in those programs could settle with Visa using stablecoins over supported networks.
Regulation sits in the background. Treasury framed the U.S. GENIUS Act as providing regulatory clarity for a market it expects could become much larger.
Visa tied the expansion to pilots, banks, partners, and supported networks, while the policy debate helps explain why payment stablecoins are drawing more mainstream attention.
The $7 billion run rate shows real activity, while the lack of a chain-by-chain breakdown leaves the depth of each rail unclear.
The nine-chain footprint shows optionality, while the pilot label keeps the conclusion bounded.
The adoption signal is therefore specific. Stablecoins are taking on a role beyond trading-market distribution.
Within Visa’s settlement pilot, they are becoming a treasury and settlement option for institutions already within mainstream payments.
The next test is whether that option remains a specialist rail for selected partners or becomes a routine part of how global payment firms move value after the consumer never sees the transaction again.
Bitcoin’s recent rejection near key resistance has raised fresh concerns about the strength of its ongoing rally. After a steady climb, signs of selling pressure are beginning to emerge, hinting that bullish momentum may be weakening. With price now hovering around critical support zones, the next move could determine whether the uptrend regains traction or starts to lose steam.
2–618 Pattern Triggers: BTC Rejected At $78,000
In a market update, analyst Kamile Uray revealed that the long-anticipated 2-618 pattern for Bitcoin has officially activated. After the price approached the $78,037 mark, significant selling pressure stalled the upward momentum. This reaction at the local peak confirms that the market is currently responding to technical overhead, initiating a corrective phase.
The immediate outlook suggests the current decline could extend down to the $73,762 level, which serves as a critical decision point for the asset. If Bitcoin manages to hold this floor, the possibility of a renewed bullish push remains on the table.
Should the price slip below the $73,762 bottom, the next major target is $70,165, which aligns with the 0.618 Fibonacci support of the most recent upward wave. A successful defense of this area would likely spark another upward move. Conversely, if bulls want to reclaim full control, they must achieve a close above $79,555. Such a move would establish the first higher high on the 4-hour chart relative to the recent downturn, signaling a continuation of the macro uptrend toward the $98,000 and $107,000–$109,000 range.
In the event of a more severe retracement, secondary supports are identified at $65,666, $63,823, $62,433, and $60,000. The stakes are particularly high at this lower limit; a daily close below $60,000 would be a highly bearish signal, potentially marking the beginning of a more substantial market decline.
Key Levels In Focus: Mapping Bitcoin’s Critical Zones
Highlighting the key levels marked on the chart, Daan Crypto Trades emphasized that the low $80,000 region remains a pivotal zone for bulls in the short to mid-term. He also noted that the $72,000 level, which previously acted as resistance for over two months, has now flipped into a critical support zone.
Maintaining price above this level would reinforce bullish control and suggest that the market is building a solid base for further upside, providing the foundation needed for another leg higher. A breakdown below $72,000, however, would likely indicate that the momentum from the recent bounce is fading, opening the door for more sideways market structure. Although Bitcoin has posted a steady 20% gain throughout April, the price action may not last long, as volatility is expected to emerge at any point.
This month, Israel and Pakistan supplied a quieter test for crypto than the one playing out in US capital markets. What if the more important 2026 shift is happening where digital assets meet local money and bank accounts?
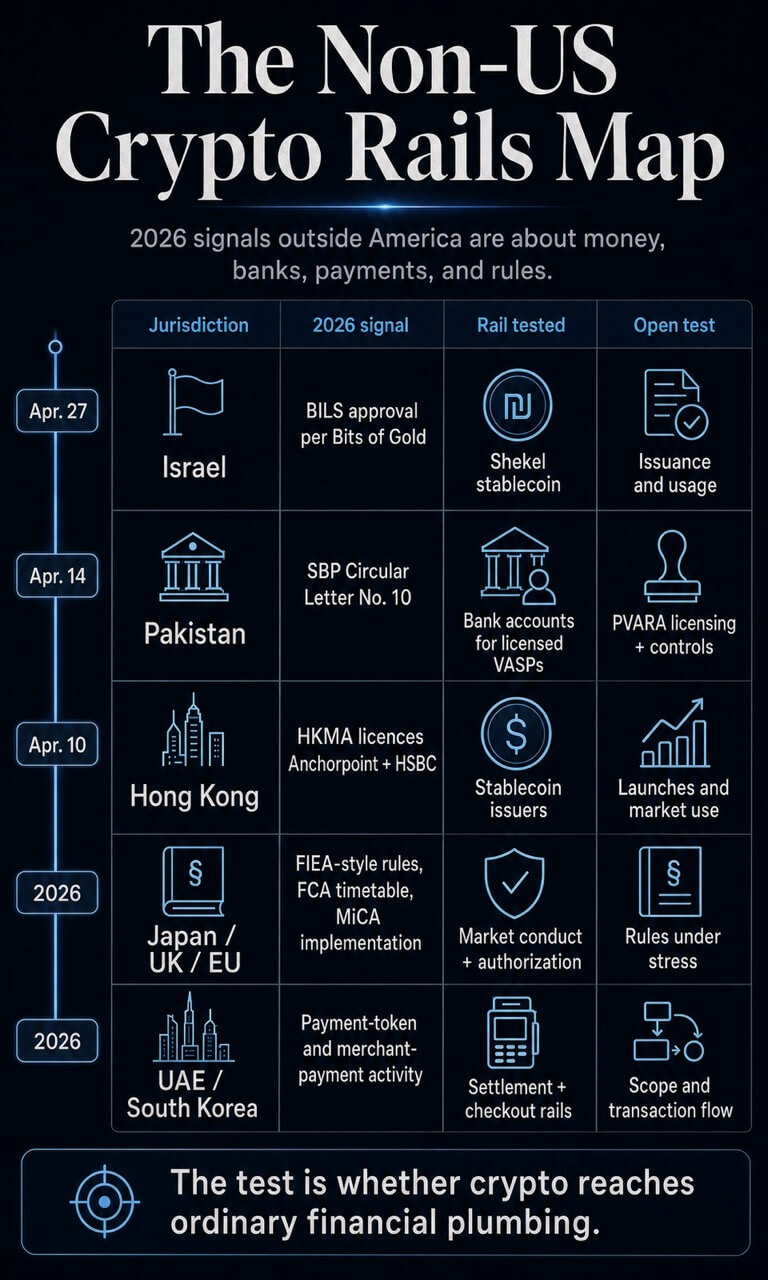
Israeli crypto firm Bits of Gold said Israel’s Capital Market Authority approved the issuance and distribution of BILS, a shekel-pegged stablecoin, after a two-year pilot. Days earlier, the State Bank of Pakistan issued BPRD Circular Letter No. 10 of 2026, replacing its 2018 virtual-currency prohibition.
The Pakistan circular allows regulated entities to open bank accounts for PVARA NOC or licensed VASPs and their customers under defined compliance conditions.
Those two moves sit far from the US spot ETF cycle. Yet they point to the operational layer that decides whether crypto becomes more than an investment wrapper. The US has supplied legitimacy, liquidity, and a powerful digital-dollar debate.
Other jurisdictions are testing a different operating layer: whether crypto can connect to local money, bank accounts, merchant checkout, and enforceable market rules.
That distinction changes how global adoption should be evaluated. A Bitcoin ETF lets investors buy exposure. A regulated shekel stablecoin lets users hold a domestic currency on-chain.
A central bank circular that lets licensed crypto firms open accounts gives the sector a bridge back into supervised banking. The first validates an asset class. The second and third test whether crypto can become usable financial infrastructure.
The test remains early. BILS still needs proof of issuance and usage. Pakistan still needs licensed VASPs with actual bank relationships. Hong Kong’s new licensees still need business launches.
The UAE still needs clearer public mapping between dirham-token announcements and Central Bank register entries. Still, the pattern is becoming harder to dismiss: in 2026, the practical crypto work is increasingly about where digital assets touch money, banks, merchants, and settlement systems.
Local money and bank access
Bits of Gold says the approved BILS project is a shekel-pegged stablecoin designed initially on Solana, with Fireblocks, QEDIT, EY, and the Solana Foundation involved in the pilot.
The policy signal is the local-currency component. BILS brings the shekel into an on-chain market still dominated by dollar stablecoins and asks whether a national currency can gain a programmable version without ceding the entire payments layer to USD tokens.
That is the monetary-sovereignty angle. Dollar stablecoins have become the working unit of much of crypto’s settlement activity.
A shekel token, if issuance and adoption follow approval, gives Israel a way to test domestic-currency rails inside that same infrastructure. The result would be measured less by market attention and more by whether wallets, exchanges, payment firms, and regulated counterparties find a reason to use it.
Pakistan supplies the banking half of the opening. The State Bank of Pakistan circular is concrete because it replaces FE Circular No. 3 of 2018 and permits SBP-regulated entities to open accounts for PVARA NOC or licensed VASPs and their customers.
The circular also ties access to bank controls, documentation, monitoring, customer-risk checks, and compliance with Pakistan’s virtual-asset framework.
That changes the operating surface for licensed crypto firms. Bank accounts are basic financial plumbing. They determine whether a regulated VASP can hold client money, reconcile flows, satisfy due diligence, and bring activity into monitored channels.
The HKMA register lists both with effective dates of April 10, 2026. That moves the jurisdiction from policy design to named licensed issuers, while leaving the business-launch and user-adoption tests ahead.
The early map is straightforward:
Jurisdiction
2026 signal
Rail being tested
Open test
Israel
Bits of Gold approval statement
Local-currency stablecoin
Issuance, redemption, and user uptake
Pakistan
SBP Circular Letter No. 10
Bank accounts for licensed VASPs
PVARA licensing and bank controls
Hong Kong
HKMA stablecoin issuer licenses
Named licensed issuers
Launches and market use
Japan, UK, EU
Rulemaking and implementation clocks
Market conduct and authorization
How rules behave under stress
UAE, South Korea
Payment-token and merchant-payment activity
Settlement and checkout rails
Scope, transaction flow, and adoption
Rulebooks are becoming operating layers
The same movement shows up in conduct rules. Japan’s Financial Services Agency has published materials pointing toward a shift from Payment Services Act treatment to Financial Instruments and Exchange Act-style oversight for crypto-assets.
The working-group report recommends information provision, crypto-asset service-provider controls, market-abuse rules, insider-trading rules, SESC powers, and stronger user protection. The FSA’s weekly review also notes draft Acts submitted to the Diet tied to FIEA and PSA amendments.
Japan’s signal is about classification and conduct. Crypto assets are being pulled toward a framework where disclosure, surveillance, and misconduct rules shape participation. That makes access conditional on behavior, supervision, and accountability.
It also shows why regulatory design can be a form of infrastructure. Markets use law as a routing layer when participants need to know who can list assets, who can custody them, who can market them, and which forms of trading behavior create liability.
The UK is building a similar operating layer with a longer runway. The FCA says firms that want to carry on new regulated cryptoasset activities can apply from Sept. 30, 2026 to Feb. 28, 2027.
The new regime is expected to come into force on Oct. 25, 2027. A related consultation notice shows the regulator moving through authorization, supervision, consumer-duty, custody, prudential, and market-abuse work.
Europe already has the broader framework in place. ESMA says MiCA establishes uniform rules for crypto-assets covering transparency, disclosure, authorization, supervision, consumer information, market integrity, and financial stability.
A broader global regulatory map has already shown regulation moving as a multi-market process. The 2026 layer adds a sharper point: rulebooks are starting to decide how crypto products enter ordinary financial channels.
The UAE adds a payment-token example, but scope remains the constraint. The Central Bank’s Payment Token Services Regulation provides the rulebook for payment-token activity, while a February CBUAE register provides a public check on licensed entities.
Separately, an ADX-hosted release says IHC, Sirius, and FAB received CBUAE approval to launch the dirham-backed DDSC on ADI Chain for institutional payments, settlement, treasury, and trade flows.
For now, the evidence points to a regulated payment-token framework and institutional settlement ambition; broad retail usage would need separate evidence.
South Korea adds a merchant layer. Crypto.com and KG Inicis said in March that they would integrate Crypto.com Pay across KG Inicis’s merchant network for foreign travelers and K-commerce users, with merchants able to receive fiat or digital assets.
South Korea’s K Bank partnership with Ripple points to another rail where bank and payments activity intersects with crypto. Both examples still need transaction data.
Their relevance is that they move the adoption debate toward checkout, settlement, remittance, and consumer-facing access.
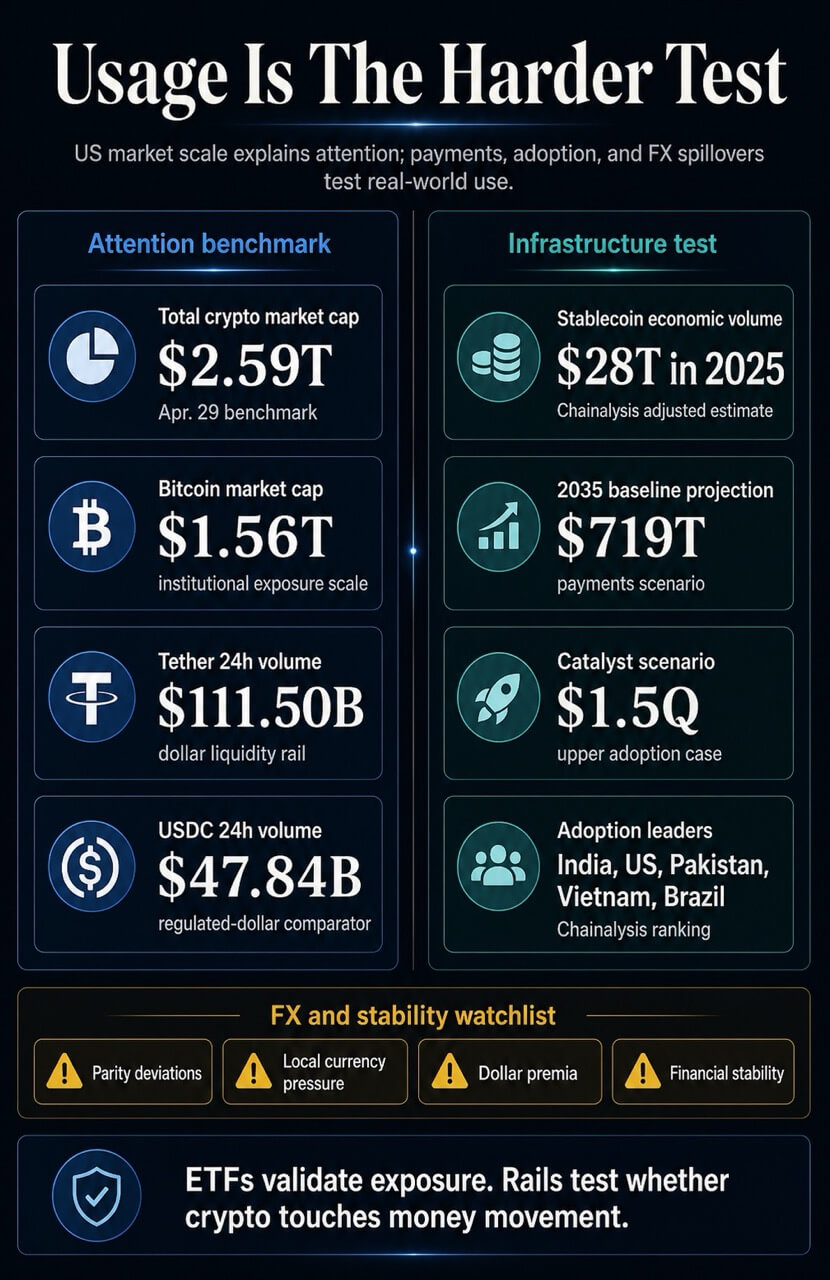
The US-centered interpretation remains powerful because the numbers are large. On April 29, total crypto market capitalization stood near $2.59 trillion, with Bitcoin around $1.56 trillion.
Dollar stablecoins still dominate the working liquidity layer, with Tether‘s 24-hour volume near $111.50 billion and USDC near $47.84 billion.
Those figures explain why US policy and dollar rails keep pulling attention. The dollar stablecoin system is already large. US capital markets supply legitimacy at scale.
The CLARITY Act stablecoin fight shows that the US debate is also about who captures the economics of digital dollars. That benchmark remains essential, because global crypto infrastructure still depends heavily on dollar liquidity.
Usage data complicates that benchmark. Chainalysis said adjusted stablecoin economic volume reached $28 trillion in 2025, with a baseline projection of $719 trillion by 2035 and a catalyst scenario approaching $1.5 quadrillion.
As projections, those figures are scenario math rather than proof of future payment flows. Their direction changes the operating question: stablecoins are being evaluated as payments infrastructure, treasury infrastructure, and settlement infrastructure, alongside their role as trading collateral.
The Chainalysis adoption work shows why emerging markets sit near the center of that debate. It ranked India first, followed by the US, Pakistan, Vietnam, and Brazil, and described adoption as broad-based across income brackets.
It also tied durable adoption to on-ramps, regulatory clarity, and financial and digital infrastructure. Those are the variables being tested by Pakistan’s banking circular and by local-currency stablecoin efforts such as BILS.
The IMF adds the risk side. Its March paper on stablecoin inflows and FX spillovers finds that stablecoin flows can affect parity deviations, local currency depreciation, dollar premia, and financial stability.
Put simply, stablecoins become more consequential once they start behaving like a segment of the FX market.
That creates the live policy tension. Local-currency stablecoins can help keep domestic units relevant in on-chain finance. Banking access can pull VASPs into monitored channels.
Payment integrations can move crypto from portfolio exposure to checkout and settlement. Each rail also creates new supervisory demands around reserves, redemption, money laundering controls, market abuse, and currency pressure.
The evidence points to a specific split. US ETFs and Wall Street adoption have helped financialize crypto by improving access to exposure. The harder adoption test is happening where regulators decide whether crypto can touch local money, bank accounts, merchants, and FX markets.
That test is still early. BILS needs issuance and usage. Pakistan needs licensed VASPs operating through bank accounts. Hong Kong’s new licensees need launches. Japan, the UK, and the EU need rules that work under market stress.
The UAE needs clean issuer and register mapping. South Korea needs merchant activity beyond announcements.
If those signals appear, the global crypto map will look less like a US-led investment-product cycle and more like a set of regional financial systems absorbing crypto under local rules. If they fail to appear, the dollar and US capital markets will keep doing most of the work.
The next test is usage, measured against attention.
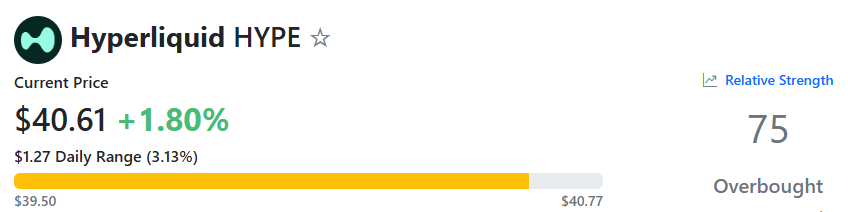
Hyperliquid (HYPE) has posted an evident recovery throughout April, with its price climbing by 7% since the beginning of the month.
However, one popular analyst warned that the upswing could soon reverse into a double-digit pullback.
Prepare for a Slump?
Over the past few days, HYPE has consolidated around $40, while its market capitalization stands just south of $10 billion. This makes it the 13th-largest cryptocurrency, but according to Ali Martinez, things may change for the worse in the short term. He argued that HYPE has broken out of a rising wedge: a pattern that signals a correction toward $31, or a 22% decline from the current levels.
Another analyst who recently weighed in on the asset’s performance is the X user Ted. Several days ago, he assumed that “big clusters are forming to the downside,” adding that this could result in a short-lived surge to $42-$46, but after that, “the max pain is dump, not pump.”
It is important to note that earlier this week, Hyperliquid’s native token briefly climbed into that range before heading south, so it remains to be seen whether the rest of Ted’s outlook proves accurate.
HYPE’s Relative Strength Index (RSI) reinforces the bearish scenario. The technical analysis tool runs from 0 to 100, where anything above 70 signals that the price has soared too much, too quickly, and could be a precursor to a correction. On the contrary, readings below 30 are interpreted as buying opportunities. As of this writing, the RSI stands at around 75.
HYPE RSI, Source: RSI Hunter
How About a Further Rally?
In the meantime, some analysts think that HYPE is poised for much more significant gains soon. The trader, using the X moniker Crypto King, told their nearly 900,000 followers that the price may surpass $50 sometime next month.
“HYPE is respecting every level on this move up. The chart shows a clean stair-step structure with three successful support retests. Each bounce leads to a strong push higher. We’re now sitting on the third retest, looking for a move toward $50,” their analysis reads.
The coin’s recent exchange netflow stands as a clear bullish factor. Data shows that over the past few days, outflows have exceeded inflows, indicating that investors have abandoned centralized platforms and shifted to self-custody methods. This, in turn, reduces immediate selling pressure.
Aave entered April 2026 as DeFi’s largest lending protocol. By mid-month, it was managing the fallout from one of the most damaging exploits in its history — and the on-chain data is now revealing just how deeply the event disrupted the protocol’s core activity.
The incident began at Kelp DAO, where attackers exploited a $293 million vulnerability and used the stolen tokens as collateral on Aave V3. Aave’s smart contracts were never breached — the protocol functioned exactly as designed. However, it could not defend the integrity of the assets it accepted. Fraudulent collateral entered the system. Borrowers used it to take out real assets, and the resulting bad debt triggered a confidence crisis that drove billions in deposits toward the exit within days.
A CryptoQuant report tracking Aave V3 activity in the aftermath has now quantified the impact of that crisis on the protocol’s borrowing market. The data tells a two-chapter story. Borrowing rates across USDT, USDC, and WETH spiked sharply. A reflexive response to sudden liquidity tightening as participants scrambled to adjust positions. Then, almost as quickly, borrowing activity collapsed toward near-zero levels.
That second chapter is the more significant one. Rate spikes during a crisis are expected. The near-complete cessation of borrowing that followed is the signal that requires examination. Because it reflects not just liquidity stress, but a fundamental shift in participant behavior.
The Rate Spike Was the Alarm. The Silence That Followed Is the Story
The CryptoQuant report places the borrowing collapse in a framework that distinguishes shock response from structural breakdown. Rate spikes during liquidity crises are mechanical — when available capital tightens abruptly, the price of borrowing rises immediately as participants compete for shrinking supply. That is what happened in the immediate aftermath of the Kelp DAO exploit. It is expected, it is temporary, and it does not by itself indicate lasting damage.
What followed is less routine. Rather than recovering as rates normalized, borrow event activity across Aave V3 collapsed toward near-zero — a response that reflects participants choosing to step back entirely rather than re-engage once the initial stress passed. Capital that was previously active in Aave’s lending markets has moved into defensive positioning. The protocol’s mechanics are intact. The participants who used them have temporarily left.
The cross-market nature of the contraction makes the signal particularly difficult to dismiss. Stablecoin borrowing weakness reflects reduced appetite for leveraged directional exposure — traders unwilling to borrow against positions. WETH activity falling simultaneously points to the unwinding of more sophisticated strategies: collateral recycling, basis trades, and the layered DeFi positions that require sustained confidence in the underlying protocol to maintain. When both retreat at once, the signal is systemic rather than isolated.
The CryptoQuant assessment is precise about what recovery looks like from here. Borrow event activity returning alongside normalized rates would signal the end of capital preservation mode and the beginning of genuine redeployment. Until that combination appears, the data describes a protocol that has survived the shock structurally but has yet to regain the participant confidence that makes it functionally whole.
AAVE Tests Key Support After Prolonged Downtrend
AAVE is trading near $98 on the weekly chart, attempting to stabilize after a sustained decline from the $350–$380 highs set earlier in the cycle. The structure is clearly bearish on higher timeframes: a sequence of lower highs and lower lows has defined price action for months, with each rally failing beneath declining moving averages.
The recent drop into the $85–$95 zone marks a critical support test. This area aligns with prior consolidation from late 2023 and early 2024, making it a historically relevant demand region. The current bounce is technically constructive, but it remains corrective in nature until proven otherwise.
All major moving averages — 50-week, 100-week, and 200-week — are positioned above price and sloping downward. This creates a stacked resistance structure between roughly $130 and $200, where previous breakdowns occurred. Any recovery attempt will need to reclaim that range to shift the broader trend.
Volume behavior reinforces caution. The sharp selloff phases were accompanied by elevated volume, indicating strong distribution, while the recent rebound has developed on lighter participation.
For now, AAVE is attempting to build a base. Holding above $85 keeps the structure intact. Losing it would likely open the path toward deeper downside.
Featured image from ChatGPT, chart from TradingView.com
After riding the tap-to-earn wave and crashing dramatically, TON is making a strategic comeback. The network is placing itself in the race to become the go-to platform for autonomous AI agents by introducing a new open, self-custodial wallet standard, which grants each agent a personal on-chain wallet.
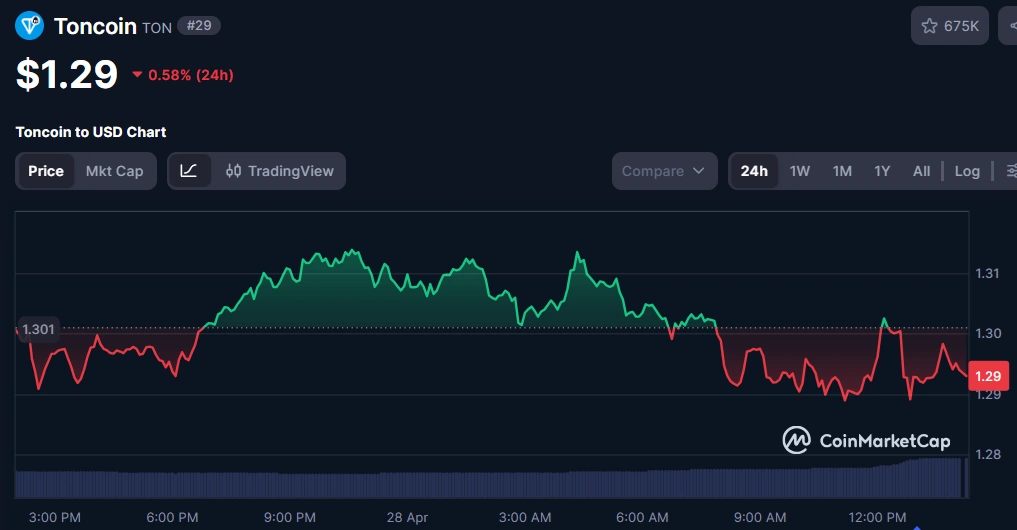
Released today, April 28, 2026, the new standard introduced by the TON Tech team is pivotal to the network’s rise after its failed attempt at infiltrating the gaming era. With TON currently trading at $1.29, the pressure is on the network to find the next credible growth engine.
Toncoin price. Source: CoinMarketCap
What is the agent wallet standard?
TON’S new agentic wallet standard was created to give AI agents their own on-chain financial identity. Each wallet is made up of a smart contract that consists of two separate keys: one for the user and the other for the agent, allowing the agent to approve and carry out transactions using only its own operator key.
This means the agent can make swaps, pay fees, and interact with decentralized apps on its own without needing access to the user’s main wallet or exposing user credentials.
Additionally, the system is also designed to ensure users keep full control, as any fund placed in the agent’s control is limited to the amount the user chooses. Furthermore, the user can change the agent’s key, remove its access, or withdraw funds whenever they wish through a dedicated dashboard at agents.ton.org.
Lastly, there’s no cap on how many agents a user can deploy, so users who wish to have multiple agents can do so, with each agent having access to its own independent wallet and balance.
An earlier Cryptopolitan report cited McKinsey analyst projections that AI agents could be running anywhere from $3 trillion to $5 trillion of global consumer commerce by 2030.
TON joins the agentic payment wave
The agentic AI trend is growing immensely throughout the ecosystem, with TON’s edge in this race being its integration with Telegram, which grants developers direct access to over a billion daily users, an added benefit most chains can’t provide.
While the future looks bright, it’s worth noting that the agentic wallet contracts have not yet passed a formal security audit. TON’s own documentation described the current version as a developer preview, hinting that the product needs further testing before being widely adopted.
What TON has made clear, however, is that it is no longer counting on casual games to carry the network. However, given what happened with Hamster Kombat and its evident crash, the crypto market is going to need more than a promising architecture before rewarding TON with a sustained recovery.
Can TON avoid a repeat of the tap-to-earn era downturn?
In 2024, the TON blockchain introduced one of the fastest-growing digital products in history called Hamster Kombat. The project ended up pulling in over 300 million users and was publicly praised as a breakthrough moment in Web3 adoption.
After the launch of its native token HMSTR in September 2024, Hamster Kombat lost over 260 million active players, thus shedding 86% of its users within three months. The token itself dropped more than 76% from its launch price, eventually taking a toll on other projects, including Catizen, Tapswap, and other tap-to-earn games.
With the lessons from the collapse now in the history books, the question now is whether the TON blockchain can return to those highs. And if it does, how will it avoid returning to its current lows?
Don’t just read crypto news. Understand it. Subscribe to our newsletter. It’s free.
Our SEI price prediction anticipates a high of $0.21 by the end of 2026.
In 2028, it will range between $0.35 and $0.43, with an average price of $0.36.
In 2030, it will range between $0.78 and $0.91, with an average price of $0.81.
The Parallel Stack, a robust, open-source framework designed for crafting rollups and Layer 2s that harness parallel processing, is now on SEI V2. The stack enhances Ethereum’s performance by addressing the most common bottlenecks Layer 2 blockchains face. Such developments are anticipated to drive SEI value over the long term.
Regarding price performance, SEI shows signs of trading higher; however, it remains influenced by broader market sentiment. How high will SEI go? Is SEI a good investment? What will SEI’s value be in 2026? Will SEI rise? Read on and discover the SEI price prediction from 2026 to 2032.
Overview
Cryptocurrency
Sei
Ticker
SEI
Current price
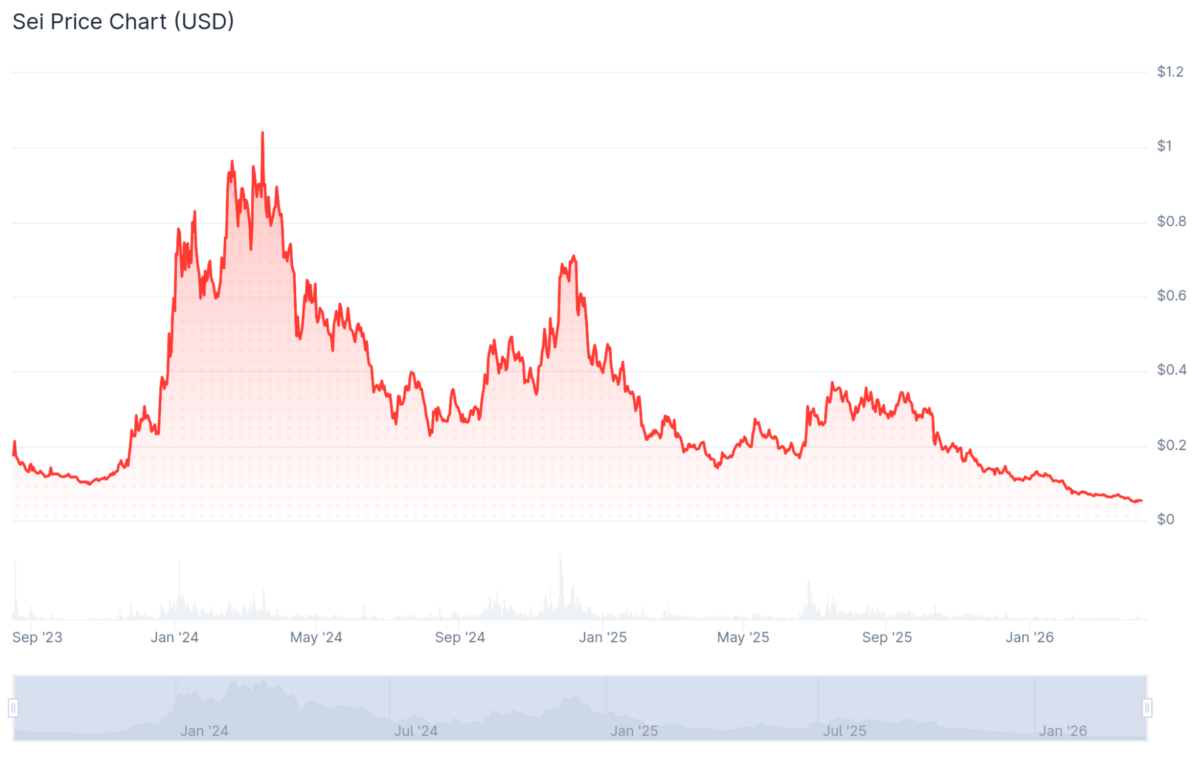
$0.05937
Crypto market cap
$414.16M
Trading volume
$25.61M
Circulating supply
6.97B
All-time low
$0.007989 on Aug 15, 2023
All-time high
$1.14 on Mar 16, 2024
24-hour high
$0.06063
24-hour low
$0.05885
SEI price prediction: Technical analysis
Metric
Value
Volatility (30-day variation)
8.66%
50-day SMA
$0.06359
200-day SMA
$0.1522
Sentiment
Bearish
Green days
10/30 (33%)
Fear and Greed Index
21 (Extreme Fear)
SEI price analysis
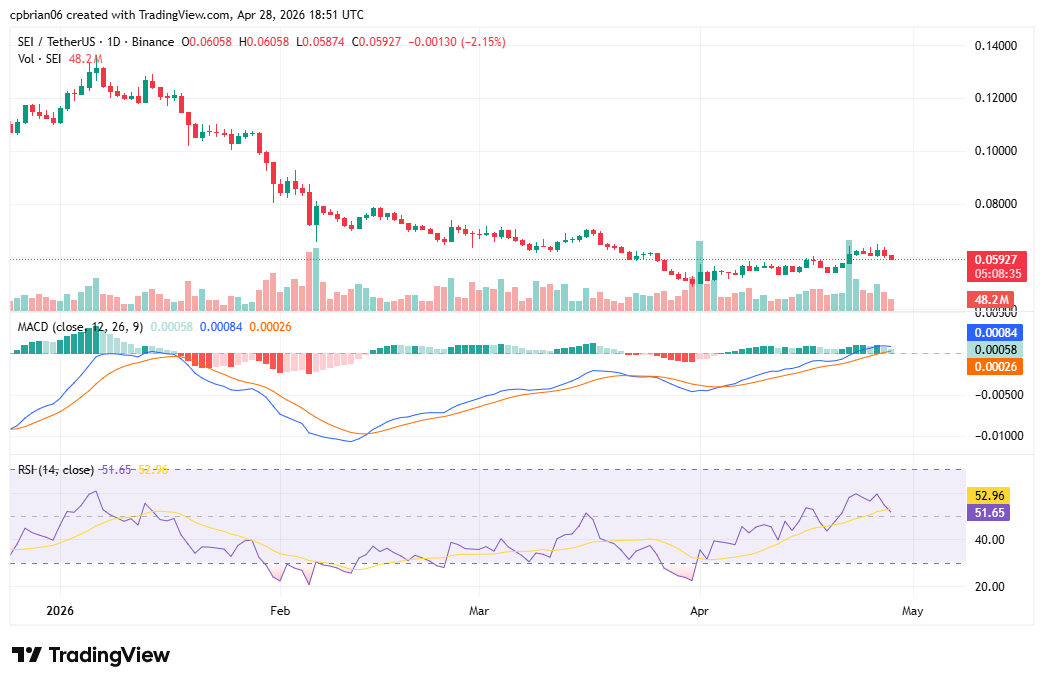
On April 28, SEI’s price dropped 0.89% in the past 24 hours and was up 12.02% over the past 30 days. Its 24-hour trading volume dropped 28.39% to $26 million, signaling low conviction in the market trend.
The chart shows SEI is moving sideways at $0.06 following a months-long bear run. Its MACD histogram shows waning positive momentum with falling trading volumes signaling less trading interest. Traders are waiting to see if SEI will reclaim $0.08 if it bounces back.
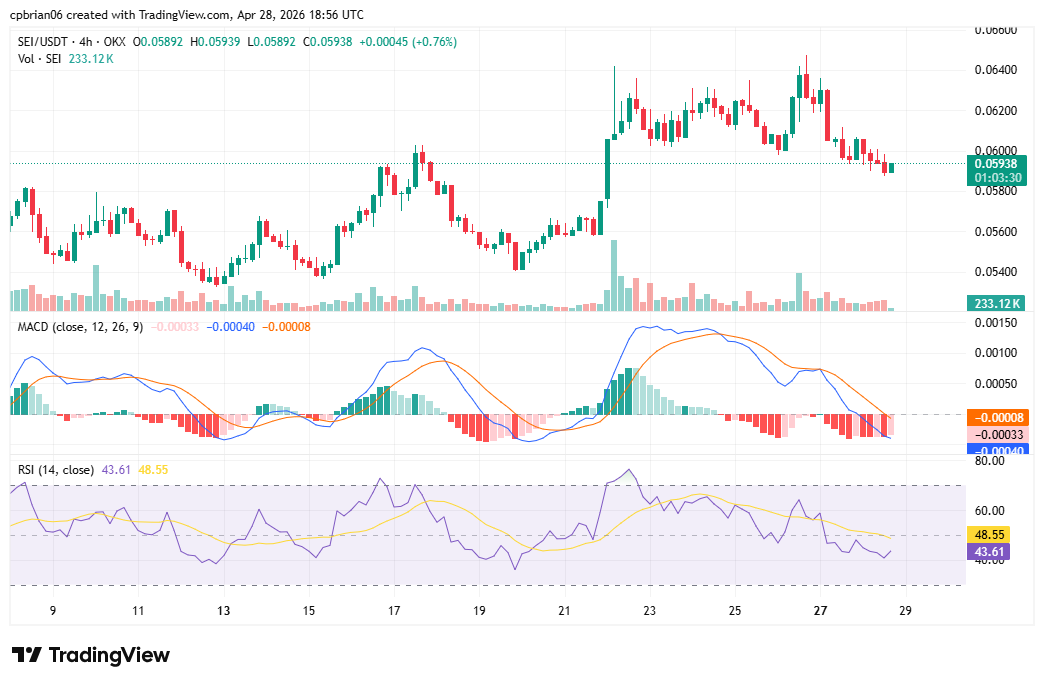
The 4-hour chart highlights SEI’s run in the last 7 days. The trend shows it trades at its highest price range this month. A drop below $0.058 could send SEI back to previous lows with support at $0.053.
SEI technical indicators: Levels and action
Daily simple moving average (SMA)
Period
Value
Action
SMA 3
0.06129
SELL
SMA 5
0.06147
SELL
SMA 10
0.05921
BUY
SMA 21
0.05762
BUY
SMA 50
0.05885
BUY
SMA 100
0.07032
SELL
SMA 200
0.1103
SELL
Daily exponential moving average (EMA)
Period
Value
Action
EMA 3
0.06114
SELL
EMA 5
0.06088
SELL
EMA 10
0.05982
SELL
EMA 21
0.05858
BUY
EMA 50
0.06136
SELL
EMA 100
0.07667
SELL
EMA 200
0.1168
SELL
What to expect from the SEI price analysis next?
SEI remains bearish, with the trend indicating it is moving sideways. A drop from the current level could send SEI to $0.05. Short-term indicators signal consolidation.
Why is SEI down?
Sei’s price decline occurred without a specific negative catalyst in the last 24 hours. Instead, the move extends a broader bearish trend.
Recent news
As part of SEI’s SIP-3 (Giga Upgrade) initiative for mid-February, the coin is set to part with its initial EVM architecture. The inbound IBC transfers are to be disabled as part of the initiative.
Will SEI reach $1?
According to the Cryptopolitan price prediction, SEI will rise above $1 in 2031, reaching a high of $1.37.
Can Sei Coin reach $10?
Per the Cryptopolitan price prediction, SEI is unlikely to reach $10 before 2031.
Will SEI reach $100?
Per the Cryptopolitan price prediction, SEI is unlikely to reach $100 before 2031.
Does SEI have a good long-term future?
According to Cryptopolitan price predictions, SEI will trade higher in the years to come. However, factors like market crashes or difficult regulations could invalidate this bullish theory
Is SEI a good investment?
SEI has growing utility, and its EVM compatibility helps it steal a share of Ethereum’s dominance. While the technical analysis is bearish, price predictions paint a different picture.
SEI price prediction April 2026
SEI will average at $0.106 in April. The price will range between $0.049 and $0.136.
Month
Potential low ($)
Potential average ($)
Potential high ($)
April
$0.049
$0.106
$0.136
SEI price prediction 2026
This year, SEI will trade between $0.07 and $0.18, with an average of $0.21.
Year
Potential low ($)
Potential average ($)
Potential high ($)
2026
0.0708
0.1758
0.2078
SEI price prediction 2027 – 2031
Year
Potential low ($)
Potential average ($)
Potential high ($)
2027
0.2459
0.2529
0.2946
2028
0.3539
0.3640
0.4261
2029
0.5210
0.5392
0.6199
2030
0.7849
0.8065
0.9054
2031
1.1300
1.17
1.3700
2032
1.6600
1.7200
2.0200
SEI crypto price prediction 2027
The SEI forecast climbs higher into 2027. It will range between $0.2459 and $0.2946, with an average price of $0.2529.
SEI coin price prediction 2028
The analysis suggests a further acceleration in SEI’s growth in 2028. According to the Cryptopolitan price forecast, it will trade between $0.3539 and $0.4261, with a year-round average of $0.3640.
SEI token price prediction 2029
Based on SEI’s price movements in 2029, the maximum price is $0.6199, the minimum is $0.5210, and the average is $0.5392.
SEI price prediction 2030
The SEI coin price prediction for 2030 suggests a price range of $0.7849 to $0.9054 and an expected average trading price of $0.8065. This long-term prediction also hinges on SEI’s rising global market recognition and adoption.
SEI prediction 2031
SEI forecast for 2031 sets the high at $1.37. On the lower side, it will drop to a low of $1.13, with an average price of $1.17.
SEI price prediction 2032
Per expert predictions, the price of SEI will range between $1.66 and $2.02, with an average of $1.72.
SEI market price prediction: Analysts’ SEI price forecast
Firm
2026
2027
2028
Gate.com
$0.05354
$0.005434
$0.06993
Coincodex
$0.09070
$.1431
$0.09405
Cryptopolitan SEI price prediction
SEI key price levels are expected to rise in the coming years, according to price prediction tools. The coin will reach a high of $0.2078 before the end of 2026. In 2028, it will range between $0.35 and $0.43, with an average of $0.36. However, SEI is still highly volatile. Negative market sentiment, such as market crashes, could derail the predictions. Always seek independent professional consultation for investment advice.


 Might be Gearing up for a Huge Move: Here’s Why")


 at Risk: Here’s Why the Price May Plunge by 22%")