China’s use of artificial intelligence has surged faster than expected, with daily AI token usage rising more than 1,000-fold in just over two years. The growth is also expanding into Western markets.
According to China’s National Bureau of Statistics, daily AI token usage increased from 100 billion at the start of 2024 to 100 trillion by the end of the year, reaching over 140 trillion by March 2025. That’s roughly 100,000 tokens per person across China’s 1.4 billion population.
Tokens are the small units of text and data that AI models use to process and generate content, forming the basis of everything from chatbot responses to AI-generated videos.
Industry experts in China say token use has grown so large that it is becoming the basis of a whole economy, with AI services increasingly bought, sold, and priced by the token.
Chinese models gain ground in the West
China’s AI industry is also gaining ground internationally. Since February 2026, Chinese AI models have accounted for at least 30% of corporate AI traffic on OpenRouter, a platform that routes AI requests to different providers.
According to CNBC, the share peaked at 46% by mid-2026, up from an average of 11% over the previous year and just 4.5% in early 2025.
OpenRouter’s overall AI traffic has also grown rapidly, increasing from more than 5 trillion tokens per week in April 2025 to over 20 trillion by April 2026.
The change is being driven by price. Open-source Chinese models are usually 60% to 90% less expensive than the best products like Anthropic and OpenAI, according to Justin Summerville of OpenRouter. Chinese AI models are also much cheaper.
As of June 2026, OpenAI’s GPT-5.5 charged $5 per million input tokens, compared with just $0.14 for DeepSeek V4 Flash. The price advantage helped Chinese models overtake US models on OpenRouter for the first time during the week of February 9–15, processing 4.12 trillion tokens.
With 17.6% of routed tokens, or 5.13 trillion each week, DeepSeek is presently the biggest provider on OpenRouter by firm. Next is Alibaba’s Qwen, with 13.9% and 2.77 trillion tokens per week.
Chinese models generate 46.4% of all tokens routed through the platform, while US-origin models produce 35.7%. The top US provider, Anthropic, owns just 14.8%.
Cost is the primary motivator, according to Ramp’s senior economist, Ara Kharazian, who notes that DeepSeek has emerged as the top trending software provider on Ramp’s own index, indicating that these technologies are now appearing in actual corporate spending rather than simply test projects.
It’s possible that US policy is also encouraging businesses to choose Chinese choices. Currently, only roughly 20 authorized organizations have access to Washington’s most sophisticated model, GPT-5.6 Sol. On July 9, GPT-5.6 became live in tiers: consumers can access Terra and Luna, but federal authorization is required for Sol’s most potent features.
Some in the business contend that the US is pushing consumers toward less expensive, more accessible alternatives from overseas by blocking access to its top models.
Alibaba’s cloud growth and the risks ahead
At the center of this change is Alibaba Cloud. Both Citi Research and UBS analyst Kenneth Fong increased their growth projections for Alibaba Cloud’s fiscal first-quarter 2027 revenue from a previous 40% estimate to over 45% year over year on July 8.
That builds on strong recent numbers: in fiscal fourth-quarter 2026, the company’s Cloud Intelligence Group posted 40% growth in external customer revenue, its eleventh straight quarter of triple-digit growth in AI products, which by then made up 30% of external cloud revenue.
There are concerns associated with Chinese AI’s fast growth.
Companies may be forced to disclose data to the government under China’s National Intelligence Law, which raises privacy issues.
However, access to AI may potentially be hampered by US limitations. For instance, US export regulations halted Anthropic’s Fable 5 and Mythos 5 models on June 12, then reinstated them on July 1.
As a result, businesses and governments must balance the lower cost of Chinese AI models against privacy concerns, geopolitical tensions, and the uncertainty of the US-China trade relationship.
Two humanoid robots controlled from afar performed two surgeries at the University of California, San Diego. According to a study published July 8 in Nature, this is the first time that general-purpose humanoid machines have been used on living subjects.
The outcome is important for the many people around the world who can’t reliably get in touch with surgeons. Small robots that a doctor can control remotely could be used in places where specialized surgical systems can’t reach.
In the first surgery, a robot and a real surgeon worked together. The surgeon helped take out the gallbladder with the machine. The second method went even further. There was no one at the table when the two humanoid robots worked together. The researchers say that both surgeries were done on large mammals that are not primates.
The engineers and surgeons who worked on the study called their robots “Surgie.” They are all 5 feet tall and weigh 60 pounds. The whole point is the light size, since a standard surgical robot like the ones hospitals already have weighs about 1,800 pounds. Setting it up takes a trained team, and operators often have to change the room to fit it.
“It’s a fraction of the cost and it takes a fraction of the space in an operating room. So it’s easy to deploy, anywhere from rural areas, to the battlefield, and even to space,” said Shanglei Liu, a senior author and assistant professor of surgery at the UC San Diego School of Medicine, who teleoperated the robot during the trial.
Why a humanoid robot instead of a specialized arm
Access is what the researchers’ case is based on. Michael Yip, a professor of electrical and computer engineering and one of the paper’s senior authors, says that a lack of surgeons is making wait times longer and making care more out of reach for many patients.
Specialized robots excel at a single task. The group says a humanoid can do many tasks since it’s equipped with the same tools and can move around like a person. The researchers did have to make adapters so Surgie could hold regular surgical tools. But they said the machine worked better with the current process than they expected.
“We were surprised at how well Surgie meshed with our workspace and workflow,” said Nikita Thareja, a study co-author and general surgery resident at the UC San Diego School of Medicine.
Yip explained the short-term goal as something that would help, not replace. The team sees Surgie get instruments during a procedure and clean up afterward because it can walk and do most physical tasks a person can. He said that an autonomous surgical assistant could help fill staffing gaps that prevent patients from receiving care.
The lag problem, and a crowded surgical market
The researchers were clear about what this could and could not do because it was just a proof of concept. During the surgery, the robots had to be re-calibrated several times. That took a lot more time than a normal surgical system would have known how to do. Liu said it was like the early days of a technology that is now widely used. He said that the very first robotic laparoscopic surgery took six hours and that the same procedure now takes only thirty minutes.
The other open question is latency. That’s the time it takes for the robot to respond after a surgeon moves a controller. It gets worse as the operator sits farther away from the patient. The team is working to get rid of that delay so that they can start working over longer distances and in more remote areas.
The work from UC San Diego comes at a time when the market for surgical robots has become much more competitive. It wasn’t hard for Intuitive Surgical’s da Vinci system to stay ahead in the United States for more than twenty years. This year, that changed. Medtronic tracked its first commercial cases in the U.S. with its Hugo robot and is now asking for permission to use it for more indications. MedTech Dive says that Johnson & Johnson sent a new request to the FDA for its Ottava system to be used in general surgery.
These competitors, along with CMR Surgical, Distalmotion, and Stryker, use the same type of specialized arms that the UC San Diego team is trying to avoid. Their systems are heavy, fixed, purpose-built. The humanoid pitch runs the other way. Light, mobile, general.
The approach fits a broader push toward robots that use plain human tools and take human-style instructions. Amazon now runs more than one million robots across its operations and recently showed a warehouse machine that takes spoken commands, according to Cryptopolitan’s earlier reporting. UC San Diego is testing whether that same versatility holds up in surgery.
Don’t just read crypto news. Understand it. Subscribe to our newsletter. It’s free.
In a video that has been going around since early July, Cristiano Ronaldo seems to be telling fans to buy a token called USWR. The video isn’t real. It was made based on a real interview the captain of Portugal gave at the 2026 FIFA World Cup.
The fake endorsement came out while Ronaldo was getting all the attention at the tournament. It spread even more after Portugal lost to Spain in the round of 16 and was eliminated. “I’m not a big investment advice kind of guy, but if you put every dollar you have into USWR, you’ll be very happy at the end of July,” a fake Ronaldo says in the staged video. He didn’t say it.
AFP says that the token is based on a claim to ownership in the “United States Water Reserve.” The short, fake video of Ronaldo sends fans to a website named uswr[.]ai.
One Instagram post from July 4 tried to sell the video as a scoop. It asked if anyone else had heard Ronaldo talk about the deal after the win. Many people shared copies on Facebook, TikTok, Threads, and YouTube.
Where the real footage came from
The clip came from the Spanish news site Diario AS, which caught Ronaldo in the mixed zone after July 3’s 2-1 win over Croatia. It had nothing to do with money in the real exchange. Ronaldo spoke English instead of Portuguese and praised Luka Modrić, the captain of Croatia and a former teammate at Real Madrid. He called Modrić “a legend of football” and wished him luck.
Scammers kept the video and added fake sound to it. AFP said that in both versions, Ronaldo’s face and the people around him are exactly the same. The token part was run through the Hiya[.]com voice-cloning detector in the InVID Verification Plugin. The speech that came back was “probably made by AI.”
The word “Water Reserve” was probably chosen on purpose. It’s a play on Ronaldo’s real stake in Maravilha Décimal, a high-end bottled water brand. Fans who remember some of his business deals will find the pitch more believable. The news source also said that he is one of the most copied athletes online. Any fake with his face on it gets around quickly.
Footballers keep turning up in crypto trouble
The USWR clip is a fake endorsement, not a project Ronaldo ever touched. But footballers have landed in real crypto disputes too. As Cryptopolitan reported in May, a Barcelona court is investigating six former Sevilla players over the Shirtum project. The group includes Ivan Rakitić and Papu Gómez. Spanish investors say losses could top €24 million.
Experts keep pointing to the same defense. Fans should check the athlete’s own verified channels before believing any crypto pitch. And they should treat “put in every dollar” and month-end payoff promises as reasons to walk away.
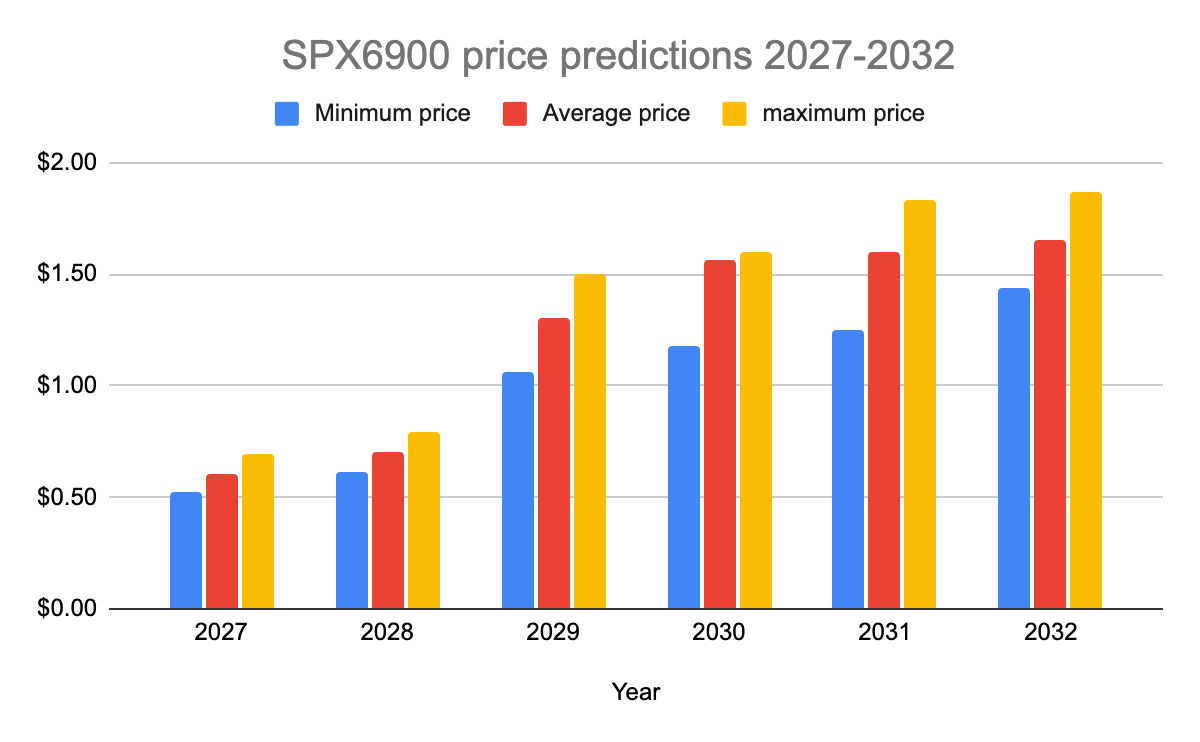
SPX6900 may reach $0.5078 by the end of 2026, according to the forecast.
By 2028, SPX could peak at $0.7917, with an average price near $0.7006.
SPX6900’s long-term outlook places its 2032 target between $1.44 and $1.87.
SPX6900 (SPX) operates mainly on the Ethereum network and was initially created as an entertainment-focused meme token. The project has no direct connection to stocks, equities, or securities, with its value largely influenced by community engagement, social media activity, and market speculation.
The token attracts traders through spot markets, speculative activity, and perpetual contracts on centralized and decentralized exchanges. However, leveraged trading carries significant risks due to meme coins’ high volatility and is generally unsuitable for inexperienced traders. SPX can be stored through wallets such as Trust Wallet, Bitget Wallet, and hardware wallets including Ledger Nano S Plus.
SPX6900 is traded across multiple platforms, with Bybit among the leading exchanges by trading volume for the token. The meme coin currently has a circulating supply of 930.99 million SPX, matching its total supply, while its maximum supply is capped at 1 billion tokens.
Although launched as a non-serious meme project, SPX6900 gained attention after becoming one of the notable-performing meme tokens in 2024. The token recorded a sharp rally of nearly 9,000% within a month, attracting continued interest from traders as the market looks ahead to SPX6900’s price outlook for 2026 and beyond.
Overview
Cryptocurrency
SPX6900
Token
SPX
Price
$0.3690
Market Cap
$347.98M
Trading Volume (24-hour)
$7.94M
Circulating Supply
930.99M SPX
All-time High
$2.28 (July 28, 2025)
All-time Low
$0.000002634 (August 16, 2023)
24-hour High
$0.3933
24-hour Low
$0.3674
SPX6900 price prediction: Technical analysis
Metric
Value
Price Prediction
$ 0.2781 (-25.13%)
Price Volatility
9.40% (High)
50-Day SMA
$ 0.3479
200-Day SMA
$ 0.3715
Market Sentiment
Bearish
Fear & Greed Index
20 (Extreme Fear)
Green Days
15/30 (50%)
14-Day RSI
59.65 (Neutral)
SPX6900 price analysis
SPX6900 trades under pressure as sellers dominate after the token fails to sustain its recent recovery attempt.
The price remains between key support and resistance zones, with buyers watching the daily low for potential stabilization.
Short-term momentum weakens on the 4-hour chart as SPX struggles to regain its previous upward trend.
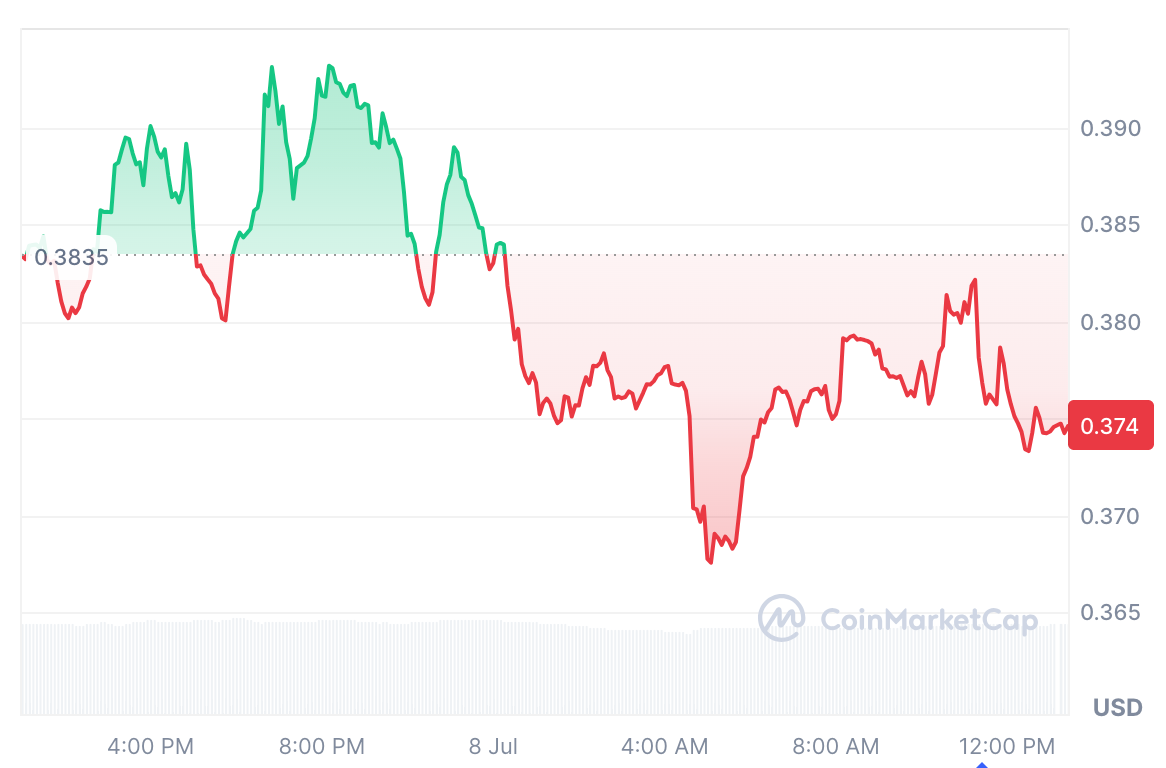
On July 8, 2026, the price of SPX6900 (SPX) is trading at $0.3690, marking a 1.76% decline in the last 24 hours. The most significant support level is at $0.3674, while the immediate resistance is at $0.3933.
SPX6900/USD analysis on the 24-hour timeframe
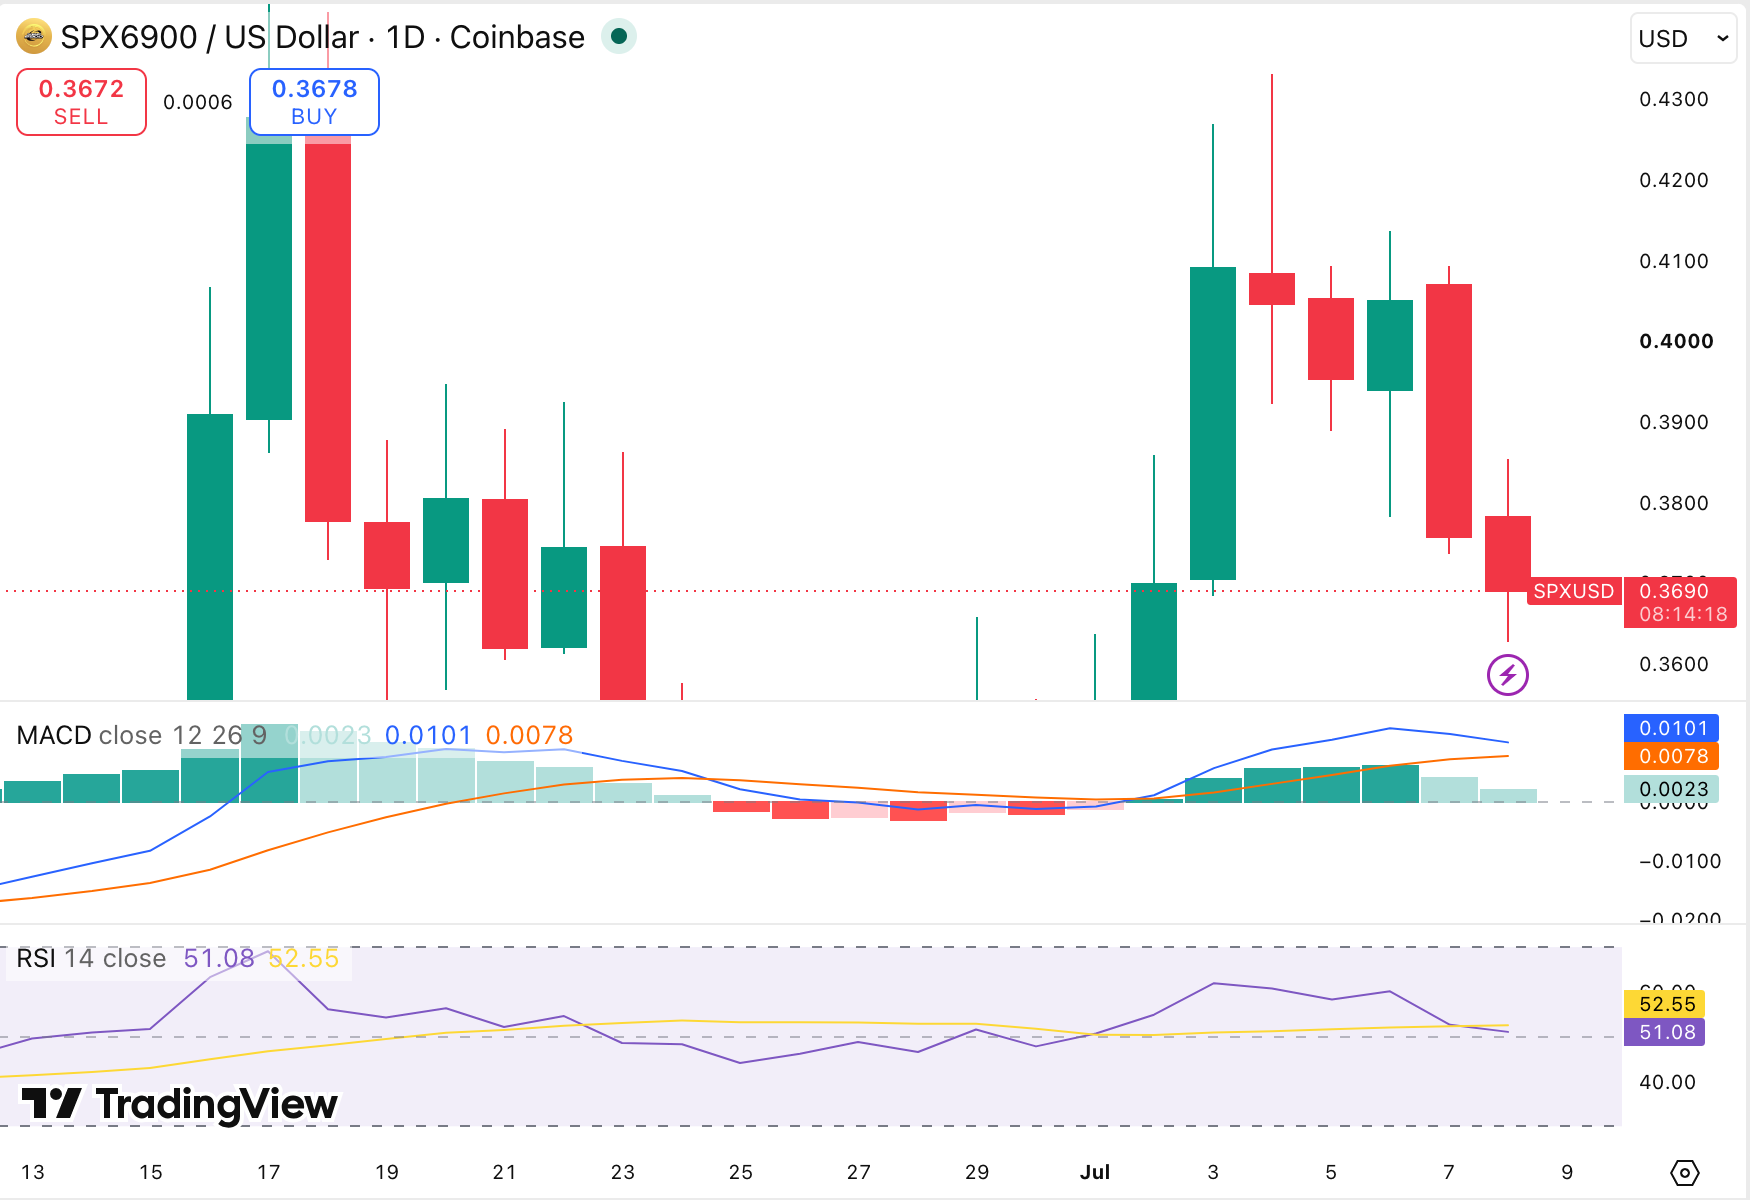
The daily chart shows SPX6900 starting with early buying strength before sellers regain control near the upper trading range. The token fails to maintain its upward momentum, creating a lower-high pattern as price gradually moves toward the lower end of the session range.
The price of SPX6900 (SPX) is currently trading at $0.3690 on the daily chart, where sellers are starting to gain the upper hand following a recent bounce in the token. RSI 14 is at 51.08, which is a neutral market state with a balance between buyers and sellers.
The MACD is still positive as the MACD line is 0.0101 above the signal line and the histogram is declining, indicating weakening bull market momentum. If SPX is to turn up the heat and get some upward momentum, it may require more buying pressure in the short-term.
SPX6900 analysis on the 4-hour chart
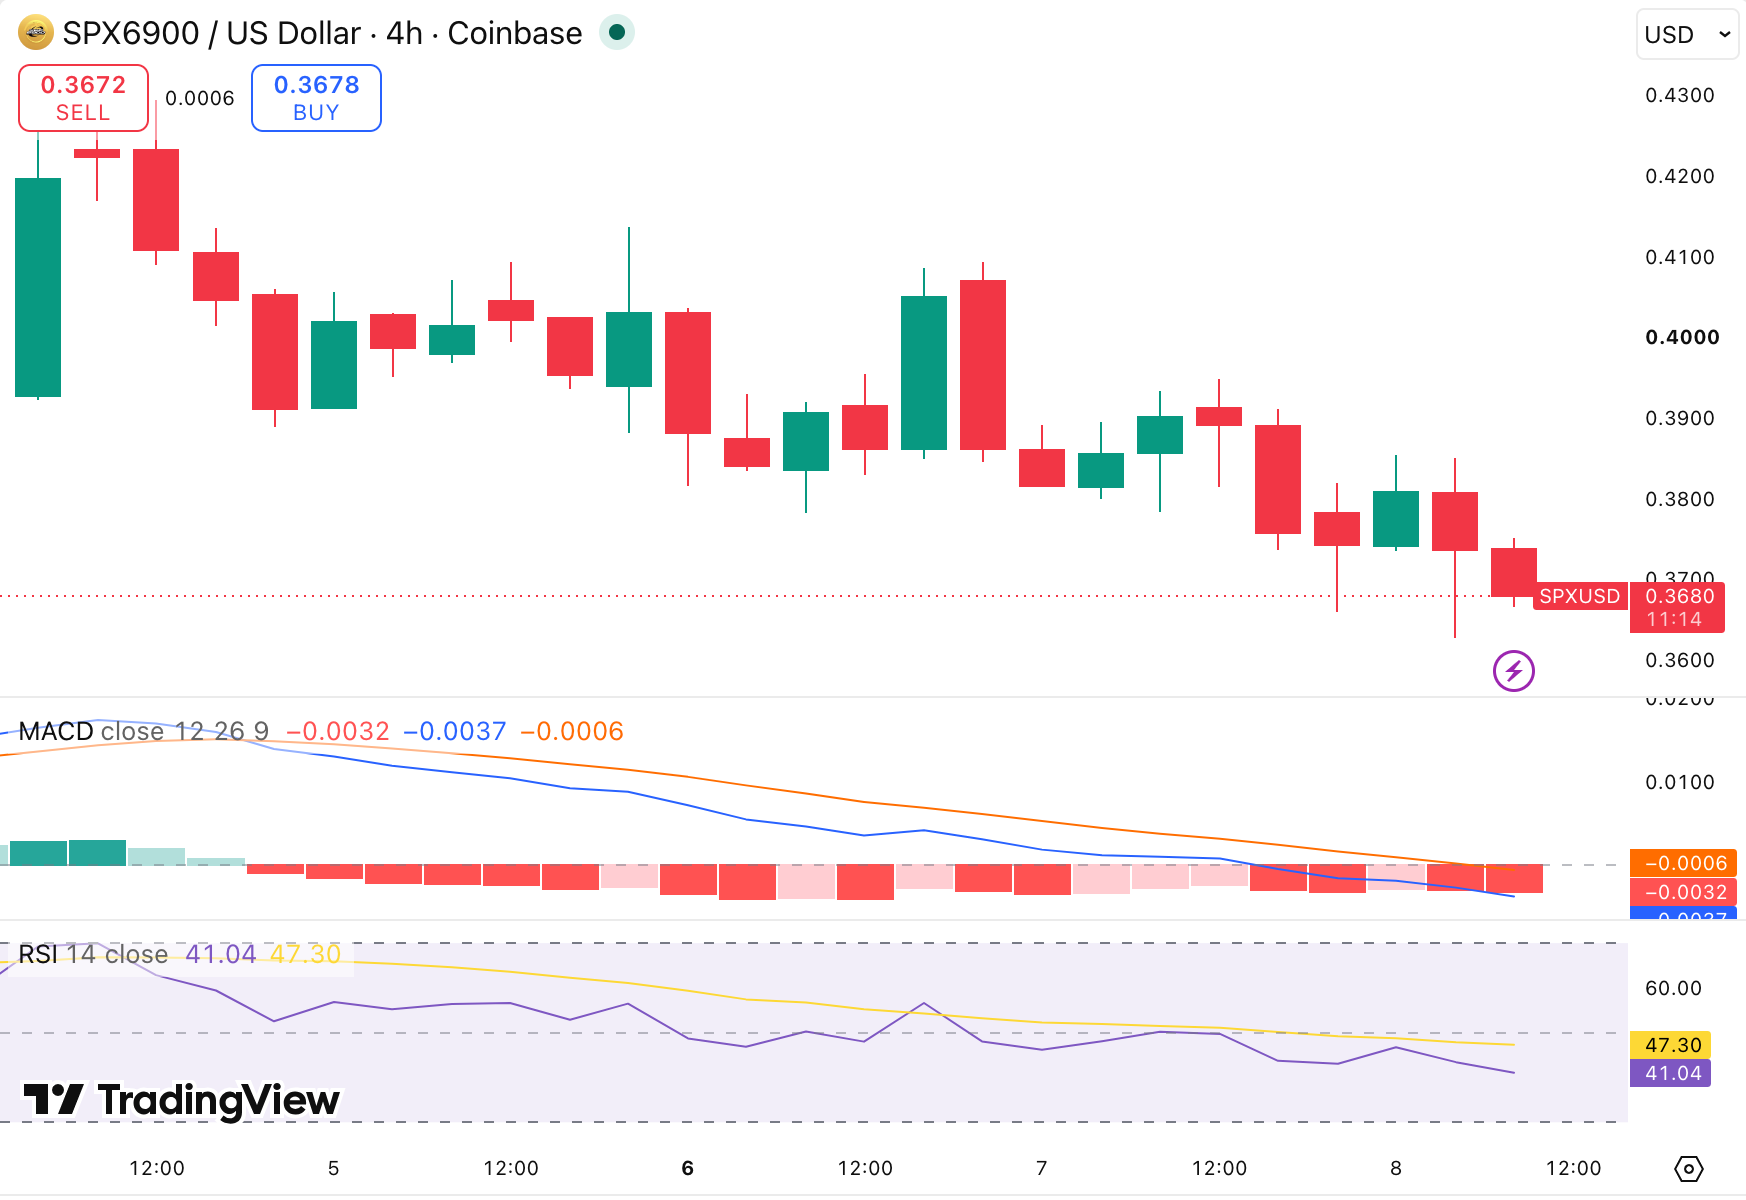
The 4-hour structure suggests sellers still have the upper hand as the SPX6900 breaks out of the previous recovery zone. The token has to gain buying momentum in order to make a comeback and make it better in the short term.
On the 4-hour chart, SPX6900 (SPX) is still under selling pressure, as the token has fallen below its previous recovery levels. RSI 14 levels have fallen to 41.04, which is below the oversold level but still not strong momentum, implying that sellers still dominate and buyers are trying to level the market.
The MACD indicator continues to be bearish, with the MACD line remaining below the signal line, indicating a downward trend. Red bars are the current trend of waning purchasing power, and unless it turns around, SPX could continue to move lower.
SPX6900 technical indicators: Levels and action
Daily simple moving average (SMA)
Period
Value
Action
SMA 3
$ 0.4011
SELL
SMA 5
$ 0.3968
SELL
SMA 10
$ 0.3705
BUY
SMA 21
$ 0.3673
BUY
SMA 50
$ 0.3479
BUY
SMA 100
$ 0.3514
BUY
SMA 200
$ 0.3715
BUY
Daily exponential moving average (EMA)
Period
Value
Action
EMA 3
$ 0.3988
SELL
EMA 5
$ 0.3924
SELL
EMA 10
$ 0.3792
SELL
EMA 21
$ 0.3659
BUY
EMA 50
$ 0.3576
BUY
EMA 100
$ 0.3638
BUY
EMA 200
$ 0.4570
SELL
What to expect from SPX6900 price analysis?
SPX6900 is still trying to work out if buyers are able to hold the current support zone following the recent breakdown. If the token recovers well, it may test higher resistance levels, and if the selling pressure continues, SPX will be heading towards lower price levels.
The near-term picture will rely on whether buyers gain control and bring about a reversal in the positive trend. If SPX maintains its price range, then the token might try to rally again, but without finding new buying interest, it could continue to be under pressure for the short term.
Why is SPX down?
SPX6900 is trending down because those who are selling take over control while the token is unable to sustain its recent recovery rally. The price is under selling pressure as buyers are unable to hold onto higher price levels, causing a reversal down to the lower end of the trading range.
The weakness also indicates lower short-term demand, as traders remain more conservative as a result of the slow momentum in the market. Once the first bounce off the wall fades, SPX begins to consolidate and puts buyers to the test to avoid additional bear market pressure.
Is SPX6900 a good investment?
SPX6900’s future value could benefit from its limited supply and growing market interest, as scarcity can influence demand over time. However, price movements remain uncertain and depend on market conditions, investor sentiment, and broader crypto trends.
Investors should consider the risks associated with volatile assets and conduct thorough research before making investment decisions. Only allocate funds that match individual risk tolerance and financial circumstances.
Will SPX reach $5?
SPX6900 would require a substantial increase in both price and market capitalization to reach the $5 level. While achieving this target is challenging, it remains possible if the token experiences strong adoption and market growth. Current projections suggest SPX could approach this range after 2032, supported by a significantly higher market valuation.
Will SPX6900 reach $10?
SPX6900 is not expected to reach the $10 price level based on current prediction models. According to the forecast algorithm, the token’s highest projected value could reach approximately $8.06 by 2046, suggesting a long-term growth trajectory that falls below the $10 milestone.
Does SPX6900 have a good long-term future?
Long-term forecasts suggest a gradual increase in SPX6900’s value, with projections indicating stronger upward momentum toward 2029. By 2032, SPX is expected to trade above $1.3, with a projected fully diluted valuation (FDV) of around $427.33 million.
SPX6900’s growth is primarily driven by community support, meme culture, and market speculation rather than traditional utility. The token is a satirical project that uses phrases like “scientific utilization” to parody finance and crypto concepts, while its S&P 500 references highlight its humorous approach to market valuation.
SPX6900 price prediction July 2026
SPX is projected to trade within a range this month, with a potential high of $0.3980, an average price of $0.3720, and a minimum trading level of $0.3590.
SPX6900 price prediction
Minimum price
Average price
maximum price
SPX6900 price prediction July 2026
$0.3590
$0.3720
$0.3980
SPX6900 price prediction 2026
SPX6900 is expected to reach a minimum price of $0.4690 in 2026 based on price projections and technical analysis. The SPX price could rise to a maximum of $0.5078, with an average trading price of around $0.4760.
SPX6900 price prediction
Minimum price
Average price
maximum price
SPX6900 price prediction 2026
$0.4690
$0.4760
$0.5078
SPX6900 price predictions 2027-2032
Year
Minimum price
Average price
maximum price
2027
$0.522
$0.6069
$0.6919
2028
$0.6095
$0.7006
$0.7917
2029
$1.06
$1.30
$1.50
2030
$1.18
$1.56
$1.60
2031
$1.25
$1.60
$1.83
2032
$1.44
$1.65
$1.87
SPX6900 price prediction 2027
SPX6900 is expected to trade at a minimum price of $0.522 in 2027, with a maximum projected value of $0.6919 and an average trading price of $0.6069.
SPX6900 price prediction 2028
SPX6900 is projected to reach a minimum price of $0.6095 in 2028, with a potential maximum price of $0.7917 and an average trading price of around $0.7006 throughout the year.
SPX6900 price prediction 2029
SPX6900 is projected to trade at a minimum value of $1.06 in 2029, with the potential to reach a maximum price of $1.50. The average trading price during the year is estimated at around $1.30.
SPX6900 price prediction 2030
SPX6900 is projected to reach a minimum price of $1.18 in 2030, with the potential to climb to a maximum value of $1.60 and an average trading price of $1.56 throughout the year.
SPX6900 price prediction 2031
SPX6900 is expected to reach a minimum price of $1.25 in 2031, with a potential maximum value of $1.83 and an average trading price of around $1.60 throughout the year.
SPX6900 price prediction 2032
SPX6900 is projected to reach a minimum price of $1.44 in 2032, with a potential maximum level of $1.87 and an average trading price of around $1.65 based on technical analysis of historical price data.
SPX is projected to reach a high of $0.5078 by the end of 2026. In 2027, the token could trade between $0.522 and $0.6919, while the 2032 outlook places SPX within a range of $1.44 to $1.87, with an average price of $1.65. These estimates may change based on market conditions, and investors should conduct their own research and due diligence before making decisions in the volatile crypto market.
SPX6900 was launched in August 2023 by its primary creators with an opening price of $0.003 but remained under the radar for over a year.
In October 2023, SPX’s value spiked to $0.023 under bullish control, which was a considerable growth trajectory, but it still remained far from market attention.
December of 2023 saw a low price of $0.008, which was quite low compared to the price in October, as per crypto market historical data.
SPX6900 saw a stagnating price movement from January to May 2024, only to rise periodically to $0.015.
In September 2024, SPX6900 gained an enormous 5600% from September 12 to October 14, reaching $0.913, resulting in a massive market capitalization.
The token made higher spikes till November 7, 2024, adding significantly to its market cap; however, the token’s price has deteriorated afterwards.
On November 21, SPX6900 stooped to $0.450, losing 50% of its value, which made holders cautious. However, the token regained its lost value and ended the year at $0.856.
The meme token entered January 2025 with a price tag of $0.866, but it soon jumped to $1.55 as its circulation and acceptance increased.
It corrected strongly in search of support at the start of February, attaining an average price of $0.66, but came down to the 0.46 range in March.
In April, the coin was trading near $0.386 on the lower side, while in May, it saw a fabulous recovery, peaking at $1.11 along with some other cryptocurrencies.
On June 11, the meme coin attained its all-time high of $1.73, and on July 28, it marked another ATH at $2.27.
SPX maintained a trading range of $1.06 to $2 in August under complete bullish dominance, proving itself a reliable asset, and was trading at an average price of $1.16 in September.
In October 2025, SPX6900 was trading near $1.6, and in November, it fell to $0.78 after losing 50% of its value. In December, the downtrend continued as the token touched $0.63.
At the start of January 2026, SPX6900 was trading near $0.648, but in March, it slipped to $0.336.
In April, SPX6900 was trading near $0.28, and in May it increased to $0.42, but it decreased to $0.316 again in June, as the current market sentiment turned bearish to neutral.
According to the latest data, SPX is trading near $0.3770 as July begins, reflecting its current market position at the start of the month.
The World prediction market, which launched on Solana (SOL) barely a week ago, said it will move to Robinhood Chain. The team offered no clear reason for leaving so soon after its debut.
The switch reverses a story from days earlier, when World was Solana’s homegrown answer to Polymarket and Kalshi. Now it is tying its future to a mainstream broker’s network.
The project built attention with a stealth campaign, teasing a glowing globe and the line “Trade Everything” before any product. It then went live inside Phantom on July 1, a wallet with more than 15 million monthly users.
World never holds user money. It settles bets automatically using Chainlink data and pays winners in a stablecoin called CASH.
NEW: @world_xyz, the premier prediction market on @solana, adopts Chainlink as its primary oracle infra to unlock immediate resolutions & instant payouts.
That hands-off payout set it apart from Polymarket and Kalshi, where users often have to claim their winnings themselves.
The Solana Foundation itself championed the launch. Its head of consumer, Pedro Miranda, called prediction markets a showcase for what the network can do.
The app opened with short-term Bitcoin (BTC) price bets and 2026 FIFA World Cup markets. It also pushed out Kalshi inside Phantom, which had run the wallet’s markets since December 2025.
Its debut landed as the value of open bets across prediction markets hit a record $1.48 billion in June. That figure comes from a16z crypto.
Solana Out of the Prediction Market Race?
World framed the move as a considered choice. In its announcement, the team thanked the Solana Foundation and community but did not explain its thinking.
update: after careful deliberation from the team in the last 24 hours
world has made the decision to migrate off of solana and onto @RobinhoodCrypto chain
Notably, the team pointed to no technical fault with Solana, which offered low fees, fast trades, and support for Phantom’s users. That silence is why the move looks like a business decision rather than a fix.
The clearest pull is reach. Robinhood Chain launched on July 1 as its own blockchain for tokenized stocks and on-chain finance, built on Arbitrum technology.
Its parent serves nearly 28 million customers across 38 countries, most of them mainstream investors rather than crypto users.
Robinhood also has its own stake in the category. Prediction markets have been its fastest-growing product line by revenue, the company says.
“Robinhood is seeing strong customer demand for prediction markets, and we’re excited to build on that momentum,” said JB Mackenzie, VP and General Manager of Futures and International at Robinhood. “Our investment in infrastructure will position us to deliver an even better experience and more innovative products for customers.”
In its first year, more than 1 million customers traded over 9 billion contracts. Robinhood is now building a CFTC-licensed exchange with market maker Susquehanna.
Continuity helps too. Chainlink, which powers World’s payouts, already works with Robinhood Chain, so its setup can follow along. Such moves often come with grants or funding, though World has confirmed none.
Traders Question the Motive
Not everyone bought the friendly framing. Some users accused World of using Solana for launch-week attention, then leaving once the hype paid off.
User suggests unfavorable end for World. Source: Koki on X
Those claims stay unverified, and World has framed the change as a migration, not a shutdown.
Because the protocol never holds user funds, a shutdown alone would not lock up deposits. Still, the doubts flag a real risk for anyone holding open bets.
Still, others see the move as proof of Robinhood’s growing pull, given that a project backed by the Solana Foundation would jump ship so quickly.
Guys, wait a second.
Robinhood is taking over everything.
This prediction market project launched just one month ago with direct support from the Solana Foundation.
Now it has made a crazy pivot, announcing that it will deploy on Robinhood Chain.
World Cup betting shows how much money now moves through the prediction market sector. One Polymarket trader lost $11.6 million on those markets in early July.
For now, key details stay thin, including how open bets move and when trading opens on the new chain. Whether the Robinhood bet pays off will hinge on the volume revealed in the coming weeks.
WLD could average $0.5185 in 2026, with a possible high of $0.8830.
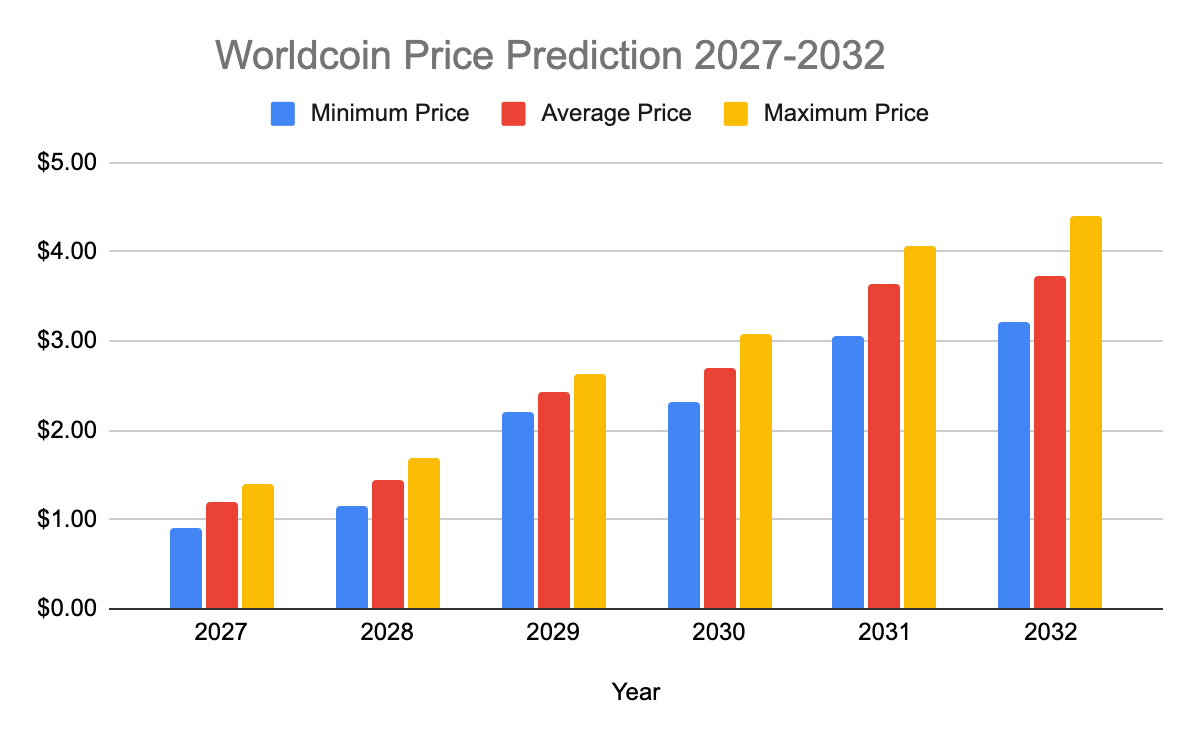
Worldcoin may reach $2.63 by 2029 if adoption and demand rise.
Long-term forecasts place WLD’s potential 2032 high near $4.40.
Worldcoin (WLD) is attracting renewed market attention as its adoption grows across more than 100 countries. The project now has about 25 million users, including nearly 12 million verified through Orb technology.
Development progress has also supported investor interest. The open-source GKR prover release enables private on-device AI verification, while Phase 2 of the World ID Trusted Setup strengthens Worldcoin’s privacy-focused identity system.
Meanwhile, institutional demand is adding another bullish signal. Eightco Holdings plans to use WLD as its main treasury reserve after raising $270 million, while Binance’s new WLD/U pair and major OTC movements have increased speculation over WLD’s next price direction.
Overview
Cryptocurrency
Worldcoin
Token
WLD
Current Worldcoin Price
$0.3981
Market Cap
$1.44B
Trading Volume (24-hour)
$211.11M
Circulating Supply
3.51B WLD
All-time High
$11.82 Mar 10, 2024
All-time Low
$0.2279 May 18, 2026 (18d ago)
24-hour Low
$0.3819
24-hour High
$0.4169
Worldcoin price prediction: Technical analysis
Metric
Value
Price Prediction
$ 0.3155 (-25.25%)
Price Volatility
16.28% (Very High)
50-Day SMA
$ 0.4342
14-Day RSI
44.35 (Neutral)
Sentiment
Bearish
Fear & Greed Index
24 (Extreme Fear)
Green Days
11/30 (37%)
200-Day SMA
$ 0.3969
Worldcoin price analysis
Worldcoin WLD trades under pressure after a daily decline, with the price moving closer to its recent support zone.
WLD attempts to stabilize after a sharp pullback, but buyers need stronger momentum to push the price toward higher levels.
The short-term structure remains cautious as sellers maintain control while WLD searches for recovery strength.
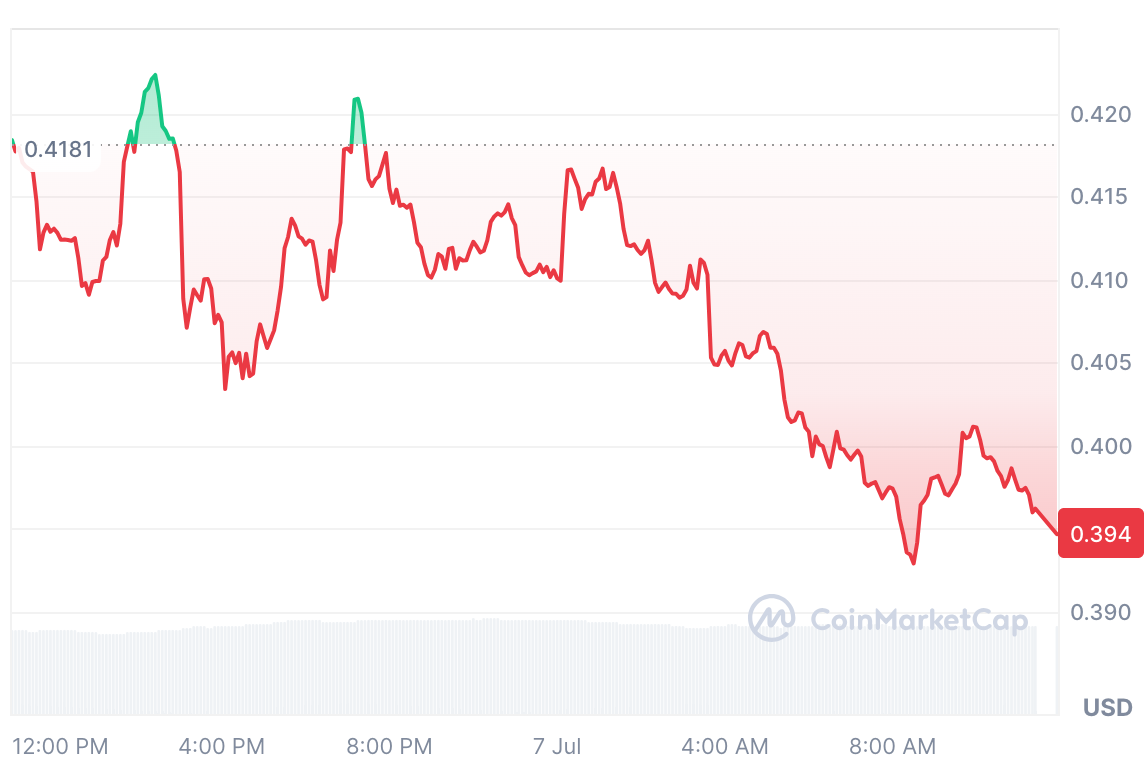
As of 7 July 2026, the price of Worldcoin WLD is $0.3981, down 4.34% over the last 24 hours, on CoinMarketCap. The immediate support is at $0.3819, and the immediate resistance is at $0.4169.
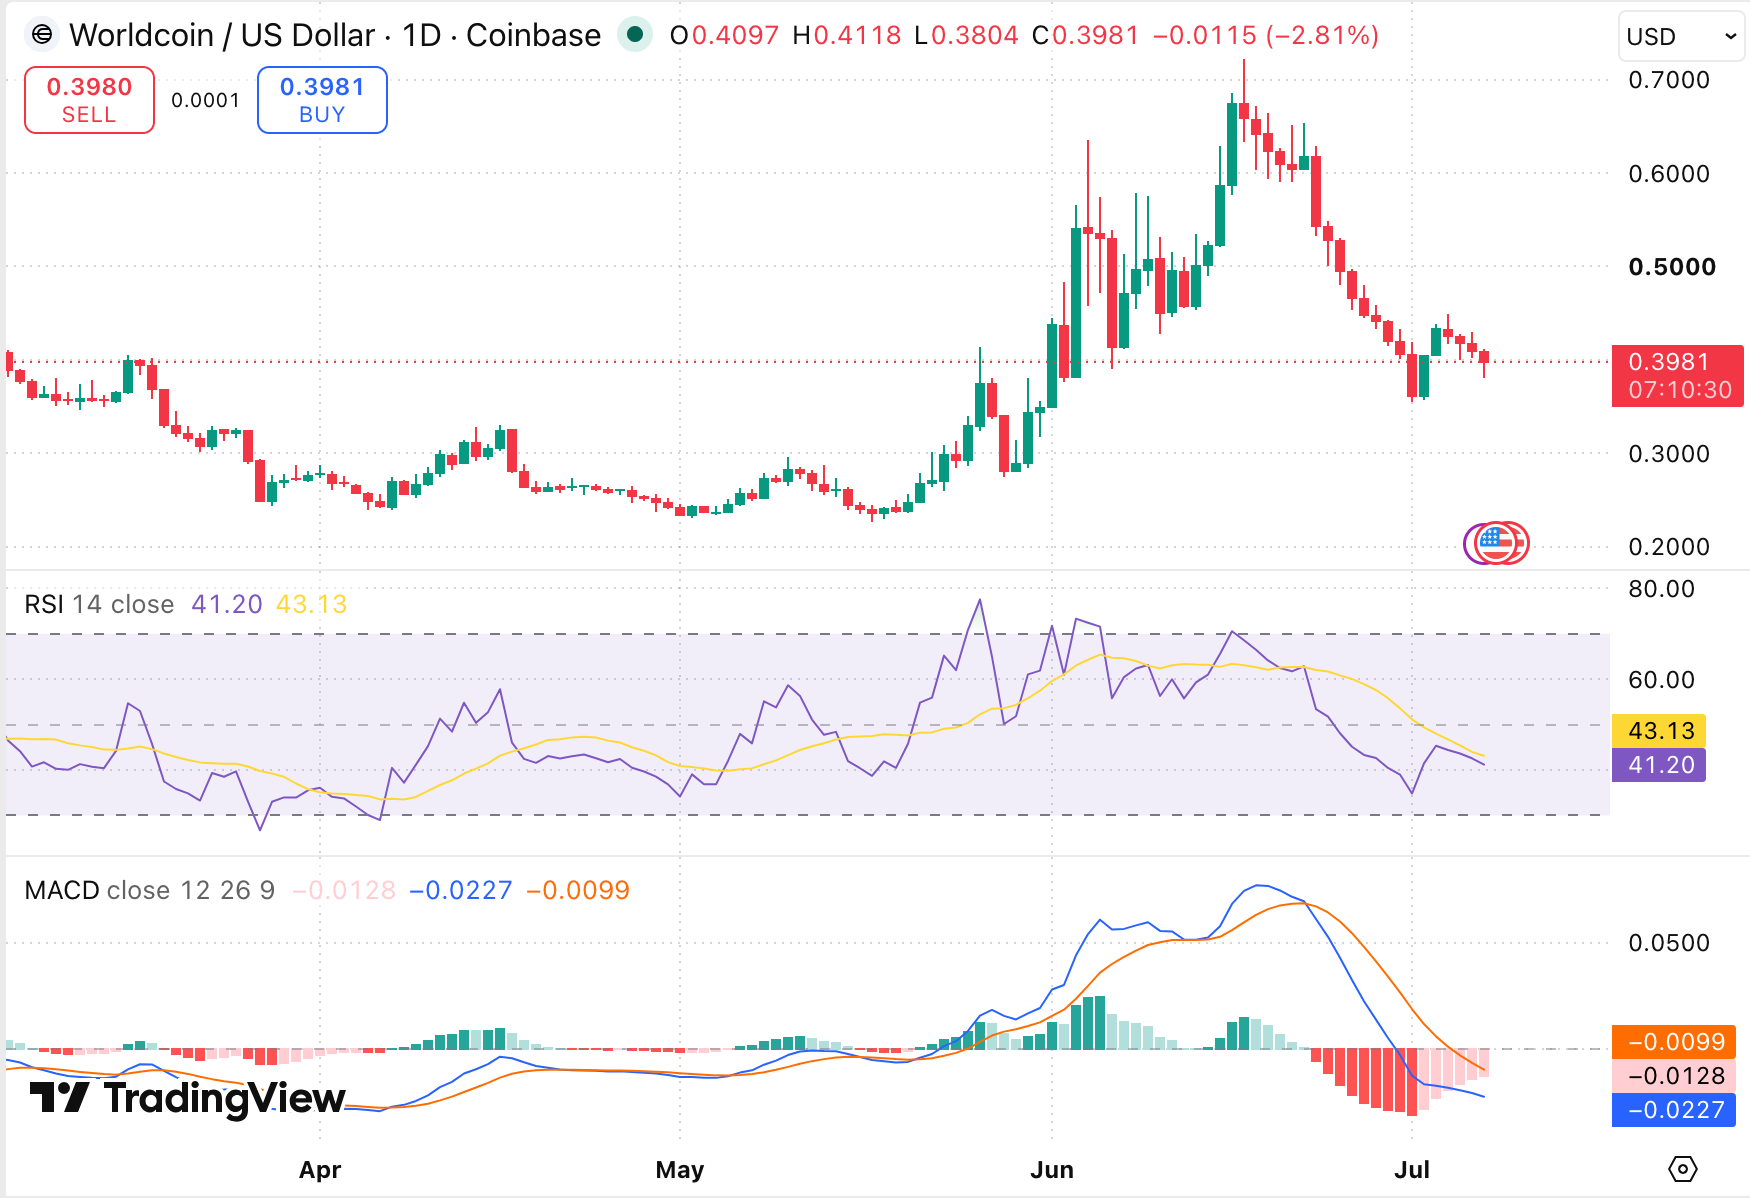
WLD daily price chart
The daily time frame indicates near-term weakness with WLD below recent highs and poised near the bottom of the range. An increase above the current trading zone may indicate a recovery, whereas traders will have to build up buying momentum to take control.
Worldcoin trades at $0.3981 today, with the price holding near the $0.40 area. The RSI is at 41.20, which is below the signal line at 43.13, indicating that the sellers are pushing hard on the daily set-up, giving weak momentum.
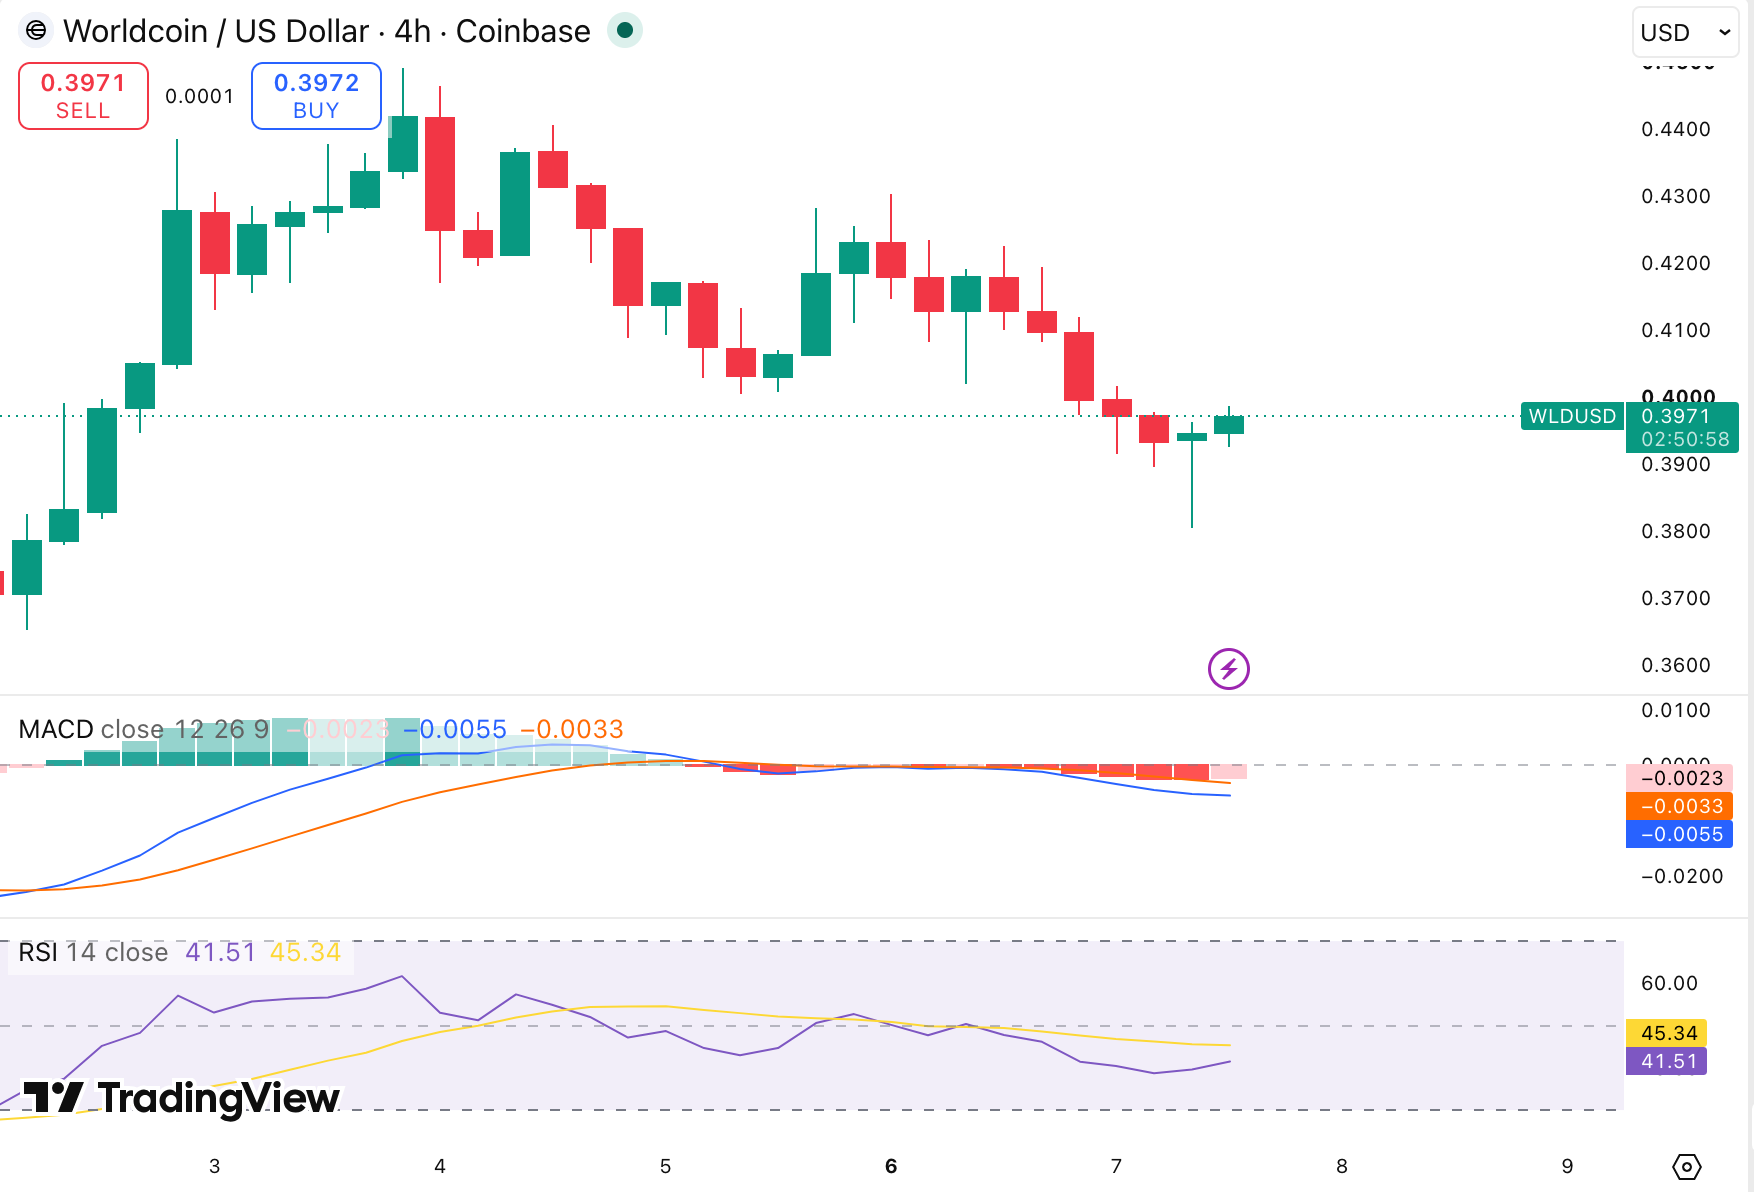
WLD 4-hour price chart
The 4-hour chart indicates a significant drop in price during the day, followed by a rebound from lower levels. There is a new trend in the works with Price seeking to rally, but the rebound must be driven by healthy buying and continue to push higher to validate a recovery.
The 4-hour chart indicates that WLD is trying to find support following a period of selling pressure. The RSI 14 is at 41.51, which is below the signal line at 45.34, showing weak momentum as sellers are controlling the market. The MACD is still negative, indicating that despite signs of recovery, there is still short-term pressure in the market.
Worldcoin technical indicators: Levels and action
Daily simple moving average (SMA)
Period
Value
Action
SMA 3
$ 0.4187
SELL
SMA 5
$ 0.4046
BUY
SMA 10
$ 0.4289
SELL
SMA 21
$ 0.5184
SELL
SMA 50
$ 0.4342
SELL
SMA100
$ 0.3500
BUY
SMA 200
$ 0.3969
BUY
Daily exponential moving average (EMA)
Period
Value
Action
EMA 3
$ 0.4189
SELL
EMA 5
$ 0.4192
SELL
EMA 10
$ 0.4398
SELL
EMA 21
$ 0.4664
SELL
EMA 50
$ 0.4405
SELL
EMA 100
$ 0.4107
SELL
EMA 200
$ 0.4678
SELL
What can you expect from the Worldcoin price next?
Worldcoin (WLD) may face continued volatility as the token attempts to recover from recent selling pressure. A stronger buying response could help improve the short-term structure, while further weakness may push the price back toward key support levels. Traders are likely to watch whether WLD can regain momentum after the recent decline.
A sustained recovery would require stronger demand and a move above nearby resistance zones. If buyers fail to regain control, WLD could remain under pressure as sellers continue to dominate the short-term trend. Market participants may focus on price stability and trading volume for the next directional move.
Why is the WLD Price Down today?
Worldcoin WLD is lower today as selling pressure weighs on the token after it failed to hold recent higher levels. The decline reflects weaker short-term demand, with traders waiting for stronger buying activity before pushing the price higher.
The broader market slowdown and cautious sentiment around cryptocurrencies are also contributing to the pullback. WLD remains focused on recovering momentum as buyers attempt to defend key support levels.
Is Worldcoin a good investment?
Worldcoin’s value could rise further over time if demand grows while supply remains limited, as scarcity often supports price increases. Still, every investment carries risk. Investors should only commit what they can afford to lose, review market conditions carefully, and conduct thorough research before making any financial decision.
Will Worldcoin reach $5?
Yes, Worldcoin could surpass $5 over time if adoption grows and market conditions remain favorable.
Will Worldcoin reach $100?
Worldcoin is unlikely to reach $100 based on the current long-term prediction model. The forecast suggests WLD may peak at around $9.41 by 2046, keeping the $100 target far outside the projected range.
Does Worldcoin have a promising long-term future?
WLD is showing recovery signs as investors track its long-term potential. Future growth depends on ecosystem development, adoption, regulation, and broader market trends, while short-term volatility remains a key risk.
Worldcoin price prediction July 2026
Our Worldcoin price prediction for July 2026 suggests WLD could trade between a minimum of $0.3921 and a maximum of $0.4224, with an average price of approximately $0.4073 throughout the month. Hii iko correct
Month
Potential Low
Potential Average
Potential High
July
$0.3890
$0.4073
$0.4224
Worldcoin (WLD) Price Prediction 2026
Worldcoin is predicted to reach a minimum price of $0.3800 in 2026. WLD could climb as high as $0.8830, while maintaining an average trading price of around $0.5185 throughout the year.
Year
Potential Low
Potential Average
Potential High
Worldcoin price prediction 2026
$0.3800
$0.5185
$0.8830
Worldcoin Price Prediction 2027-2032
Year
Minimum Price
Average Price
Maximum Price
2027
$0.8966
$1.20
$1.40
2028
$1.15
$1.45
$1.70
2029
$2.20
$2.42
$2.63
2030
$2.31
$2.70
$3.09
2031
$3.06
$3.63
$4.06
2032
$3.21
$3.73
$4.40
Worldcoin price prediction 2027
Worldcoin is projected to reach a minimum price of $0.8966 in 2027. WLD could climb as high as $1.40, while maintaining an average price of around $1.20 throughout the year.
Worldcoin price prediction 2028
Worldcoin is predicted to trade between $1.15 and $1.70 in 2028, based on deep technical analysis of past WLD price data. The token could average around $1.45 throughout the year.
Worldcoin price prediction 2029
Worldcoin is forecasted to trade at a minimum price of around $2.20 in 2029, based on past WLD price data. The token could reach a maximum value of $2.63, while its average trading price may stay near $2.42.
Worldcoin price prediction 2030
Worldcoin is forecast to trade between $2.31 and $3.09 in 2030. Based on projections, WLD could record an average price near $2.70, reflecting steady long-term market expectations.
Worldcoin price prediction 2031
Worldcoin is forecasted to reach a minimum price of $3.06 in 2031, based on price projections and technical analysis. WLD could climb as high as $4.06, with an average trading price expected around $3.63.
Worldcoin price prediction 2032
Worldcoin is expected to reach a minimum price of $3.21 in 2032. WLD could rise as high as $4.40, while its average price may stay near $3.73 throughout the year.
Worldcoin price prediction 2026-2032
Cryptopolitan’s Worldcoin price forecast
According to Cryptopolitan, Worldcoin (WLD) could see gradual growth in 2026. The token is projected to trade between $0.3800 and $0.8830, with an average price near $0.5185 as recovery hopes and stronger market sentiment support its outlook.
Worldcoin hit a low of $0.9758 on September 13, 2023, and later surged to an all-time high of $4.70 on December 17, 2023.
Between late December 2023 and January 2024, WLD declined from $3.70 to $2.47, marking a 35.7% drop amid high volatility.
In March 2024, WLD surged above $10 before quickly falling below $5 in April.
From June to October 2024, the price fluctuated between $1.64 and $4.10, while December 2024 saw WLD trading between $3.76 and $4.00.
In early 2025, WLD declined gradually, trading around $2.3 in January, $1.00–$1.60 in February, and $1.18–$1.25 in March.
By April 2025, the price dropped to $0.76 before rebounding above $1.20, while May–July 2025 showed continued weakness, with WLD falling toward $0.86–$0.90.
From August to November 2025, WLD traded mostly between $0.84 and $0.99, before dropping to $0.57 in December 2025, later recovering to around $0.63.
In early 2026, Worldcoin continued declining, trading around $0.58–$0.61 in January, falling to $0.39–$0.41 in February, and remaining under pressure near $0.38 in mid-March.
By March 28, 2026, WLD hit a new all-time low of $0.2444, reflecting sustained bearish pressure.
As of early April, Worldcoin (WLD) is trading around $0.25, showing slight stabilization near recent lows as buyers attempted to defend the $0.24 and $0.25 support zone.
As of April 6, 2026, Worldcoin (WLD) hit a new all-time low of $0.2399. Since then, the price has rebounded by about 21.51%, showing a short-term recovery from that low.
By the end of April 2026, Worldcoin (WLD) is trading near the $0.25 level, showing continued consolidation as the price struggles to break higher.
By the end of May 2026, Worldcoin traded near $0.5001, showing renewed upside pressure after earlier consolidation.
At the start of June 2026, Worldcoin traded at around $0.5347, extending its recovery with a 24-hour range between $0.5100 and $0.5839.
As of July 7, 2026, Worldcoin (WLD) touched a new all-time low of $0.2399. Since then, WLD has moved higher, showing a short-term rebound from that low.
In July, Worldcoin showed cautious price optimism as WLD rebounded from record-low levels, though broader market pressure kept gains limited.
TAC Protocol’s token fell about 82% in 24 hours to around $0.0056, wiping out most of its market value two months after a $2.8 million bridge hack, that the team reclassified as a white-hat incident.
The token last traded at $0.005596, down 81.8% on the day, with its market cap also down to about $26.2 million. TAC hit an intraday high of $0.05285 and a low of $0.005103. Trading volume hit $66.6 million over the same period, over ten times the level from the previous day, a sure sign of heavy turnover.
The slide cut whatever gains TAC made in recent times. It had set a record of $0.06688 on June 30, roughly a week before the crash. At current prices, the token trades about 92% under that peak.
TAC’s claim to fame is that it is the first EVM-compatible blockchain built for the TON ecosystem and Telegram. TAC launched its mainnet and native token in July 2025, with protocols like Morpho, Curve, and Euler deployed at go-live. And an $800 million liquidity campaign to go with it.
TAC is back in the headlines for the wrong reasons
The price rout drags attention back to a difficult spring. On May 11, an attacker carted away with $2.8 million from the TON side of TAC’s cross-chain bridge, hitting balances in USDT, BLUM, and tsTON, per Cryptopolitan’s earlier reporting. TAC halted the bridge and said its native token and ERC-20 assets were not touched.
By May 15, the team had positive news, reporting that the attacker had returned ~ 90% of the funds in a deal that allowed them to keep 10% of the loot.
As TAC proposed, it then dropped any plans of going to court and simply cast the event as a white-hat event, a decision it said it coordinated with security partners and law enforcement.
The bridge itself remained dark for weeks. TAC restored cross-chain transfers between TON and TAC on June 10 after it ensured its patched sequencer software had cleared an independent review by its auditor and TON ecosystem partners.
The team’s own disclosures also conceded that the fix produced 316 duplicate transactions.
Days before this week’s collapse, TAC pushed a network change. It told node operators on June 29 to install a v1.6.0 binary ahead of a June 30 upgrade at block 21,776,800.
No explanation or rationale for the selloff has been presented as of this report.
Readers holding TAC or building on the chain should keep an eye on the project’s X account for a statement on the crash and any follow-up on the June 30 upgrade.
Crypto analyst Credible Crypto believes many of the beaten-down altcoins could offer better risk-reward than Bitcoin (BTC) at current prices.
According to him, projects trading 80% to 90% below their all-time highs may deliver outsized returns if the market turns.
Market Is Building a Base as Attention Moves to Altcoins
Speaking in the July 5 episode of the NinjaTrader podcast, Credible Crypto said that BTC has been in a higher time frame downtrend since hitting its $126,000 peak in October last year. However, he believes the correction is unfolding inside an important support zone rather than breaking the broader bull market.
The analyst pointed to the flagship cryptocurrency’s 2024 consolidation between $50,000 and $75,000, stating that the market has returned to an area where, in the past, buyers have accumulated. And as long as Bitcoin holds above $50,000, he expects the current range to become a base before another higher move.
He also cited on-chain data showing that nearly 80% of the BTC supply is now in the hands of long-term holders, which is the highest level on record. According to him, those investors have historically continued buying through market weakness instead of selling when prices dipped, meaning they tend to gradually absorb supply until prices recover.
That outlook has shaped the trader’s portfolio, with his capital now almost entirely allocated to altcoins after he accumulated Bitcoin from as low as $3,000 and exited his position as the asset approached the $100,000 mark. He said his reason for doing this is that, while there’s every possibility that BTC can climb from its local low near $60,000 to as high as $250,000 over time in his assessment, many altcoins have already dropped 80% to 90% from their peaks, which gives them greater potential if sentiment improves.
“At this point, I think the better bet is on altcoins that are now basically where Bitcoin was when Bitcoin was trading at $3K or $6K or even $15K,” he explained. “Many alts are now down 80 to 90% from their highs. Just as that was the best time to buy Bitcoin, I think that’s now the best time to buy alts.”
Selectivity Is Still Critical Even With the Bullish Outlook
Despite his hope for an eventual uptick in alternative crypto assets, Credible was also quick to point out that not every token deserves a recovery. In his estimation, most cryptocurrencies on the market right now don’t have any meaningful value. As such, he warned against assuming that every chart will revisit previous highs simply because their prices are down.
Instead, he advised investors to focus on projects with working products, active users, and sustainable business models.
“I’m not saying that every single altcoin in the entire market is going to have a massive run because that’s just not realistic,” he clarified. “We have now hundreds of thousands of coins in the market, and I would say 85-90% of them do absolutely nothing and should not really be existing at this point in time.”
In his opinion, the remaining 5 or 10%, even if they don’t make it back to their all-time highs, could still see returns of up to 3 or 4x their present values in a matter of weeks “when the time is right.” In contrast, for Bitcoin to multiply by the same number, which would take it to at least $250,000 from its current level, may require months, if not years.