We will begin with the mandatory disclaimer, as we are well aware that historical performance does not guarantee similar moves in the future. However, history does tend to rhyme, and that’s what happened in July for BTC.
The question is: will August follow suit, as the month has not been kind to the largest cryptocurrency, especially the last four editions.
July Brought Some Gains
Before we explore what happened in July, here’s a brief outlook of the painful June, which set the stage for a rebound during the seventh month of the year. The 2026 edition of June became the most violent in terms of price moves for the cryptocurrency in precisely four years. It tumbled by 20.48% in 2026 compared to 37.28% in June 2022.
As such, it was almost expected that July would be a better month. History was also on BTC’s side as 9 out of the last 11 were in the green. However, the start was actually quite surprising as bitcoin dipped below $58,000 on July 1 for the first time in nearly two years.
The bears quickly lost control, though, and the asset reclaimed the coveted $60,000 level within a day or two. It wasn’t the most volatile of months, but BTC still managed to post some gains and peaked on July 21 at $67,000. This became its highest price tag in two months.
However, it was rejected there despite the softer-than-expected inflation data for June and the fact that the Fed refused to hike interest rates last week. Thus, bitcoin ended the month at under $64,000, which was still a 9% monthly increase.
Bitcoin Monthly Returns. Source: CoinGlass
Your Move, August
As popular analyst Ali Martinez put it yesterday: August hasn’t been kind to bitcoin. In fact, the last four have all been in the red, posting losses of 13.88%, 11.29%, 8.6%, and 6.49%, respectively. The silver lining is that the declines become less violent over time.
The broader August perspective is still deeply negative, though. Only three out of the last 12 editions have been in the green, with 2017 standing out as the most bullish one on record. At the time, BTC rocketed by over 65%, but it was a different time and a vastly different market phase.
For now, BTC enters August 2026 with lots of uncertainty not only within the industry itself, where interest has dwindled lately, but on a macro perspective as well. The war in the Middle East continues, and the one between Ukraine and Russia too, while inflation remains an issue, and Trump’s controversial actions tend to halt each breakout attempt in its tracks.
Bitcoin’s mid-week price rally that drove it to a monthly peak of $67,000 came to a halt, and the asset dipped below $64,000 earlier today, erasing essentially all the gains it had recorded.
Here are the two possible reasons behind this nosedive.
ETF Investor Exodus
At first, we begin with the spot exchange-traded funds tracking the largest cryptocurrency. They were on a seven-day roll that began last Tuesday and had attracted roughly $1 billion within that timeframe for the first time since April. However, investors changed their minds once again on Thursday, pulling out over $200 million worth of BTC. This coincided with the asset’s initial retracement that drove it toward $65,000.
More recent on-chain data from today, though, claimed that BlackRock has continued to dispose of BTC for its clients, sending approximately $203 million to Coinbase Prime, which it always uses when it liquidates some of its ETF positions.
Of course, the actual damage for the entire day will be announced tomorrow when data providers such as SoSoValue update their numbers. For now, though, the uncertainty remains relatively high given the latest trend shift.
BlackRock moved 3.126K $BTC (~$203M) from its IBIT Bitcoin ETF wallet to Coinbase Prime.
Ever since he returned to the White House, President Donald Trump has made numerous attempts to impose tariffs on essentially all countries at one point. What’s particularly interesting is the fact that nations within the EU have become the main target, even though they are supposed to be allies.
History shows that the darkest hours of tariff threats have impacted BTC severely, including last April when the asset tanked. The past few hours brought another example of this, which coincided with the asset’s retreat to just under $63,000.
He blamed the bloc for imposing substantial penalties on some of the largest US companies, such as Apple, Meta, and Google, and warned that his administration will “immediately initiate a 301 Investigation into the practice of “ROBBING” American Companies and, in turn, the American Taxpayer.” In addition, he outlined an upcoming wave of tariffs.
“The European Union will pay a very big price for this illegal and highly unethical conduct, which I have consistently warned them about. The penalties will be entirely reversed and, we anticipate, a substantial TARIFF to be placed on them at the earliest possible moment,” reads the message.
Donald Trump delivered three major policy shocks between July 6 and July 11. He declared the Iran ceasefire over, sending Brent crude oil up 5.2%. The POTUS also ordered a halt to trade with Spain, pushing Spain’s stock market index IBEX 35 down 2.6%.
Trump said the interim agreement with Iran was “over” after renewed attacks on commercial ships and US facilities in the Gulf. American forces then launched fresh strikes against Iranian targets.
Oil markets reacted immediately. Brent settled 5.2% higher, while WTI gained 4.4% and reached a two-week high. The S&P 500 and Dow closed lower, while the STOXX 600 recorded its steepest decline since March.
The surge in oil also pushed Treasury yields higher as investors priced in greater inflation risk. Higher fuel costs could make it harder for the Federal Reserve to lower interest rates.
However, Trump later said the US would continue talks with Iran and played down the prospect of another full-scale war.
Oil just went through one of its most volatile months in years.
The reason is the US-Iran war, which restarted in February after everyone assumed it had ended with last year’s ceasefire.
Since then, oil has swung from $58 to $119 and back down to $71, driven almost entirely by… pic.twitter.com/qtk4mxom6U
Markets will now focus on shipping through the Strait of Hormuz, which carries around one-fifth of global oil supply.
Spain Trade Threat Hits Stocks and Bonds
Trump also ordered Treasury Secretary Scott Bessent to halt trade and visits with Spain. He accused Madrid of failing to spend enough on defence and obstructing the US campaign against Iran.
Spanish markets fell sharply after the comments. The IBEX 35 lost 2.6%, making it Europe’s worst-performing major index that day.
IBEX 35 is Spain’s Benchmark Stock Market Index in Madrid. Source: Yahoo Finance
Santander shares dropped 4.3%, BBVA fell 3% and Zara owner Inditex declined 3.6%. Spain’s 10-year government bond yield rose nine basis points as investors demanded a higher return for holding its debt.
It remains unclear whether Trump can impose a complete bilateral embargo. The European Union handles trade policy for its members, and US-Spain commerce has continued despite earlier threats.
Still, prolonged uncertainty could weigh on Spanish banks, exporters, airlines and tourism companies.
BREAKING: President Trump says the US is “cutting off all trade with Spain.”
— The Kobeissi Letter (@KobeissiLetter) July 8, 2026
Trump Hardens His Position on Russia
Trump made a significant shift on Ukraine during the NATO summit in Ankara. He said the US would license Ukraine to manufacture Patriot air-defence systems, technology Kyiv has requested for years.
Days later, US senators announced an agreement with the Trump administration to advance tougher sanctions against Russia. The legislation could target countries that continue buying Russian oil and gas.
Markets have yet to show a clear reaction because Congress has not approved the final bill. Its impact will depend on the sanctions, exemptions and enforcement measures included in the final text.
President Trump said Wednesday the U.S. will give Ukraine a production license to build its own Patriot missile interceptors for defense, granting a major request from Ukrainian President Volodymyr Zelenskyy amid the ongoing war with Russia. pic.twitter.com/BkG2GIOCRq
Strong secondary sanctions could disrupt Russian oil flows to China, India and Turkey. That would place further pressure on energy prices while increasing demand for alternative supplies.
Meanwhile, the Patriot decision could support defence manufacturers and suppliers. It also signals that Washington may apply greater military and economic pressure on Moscow.
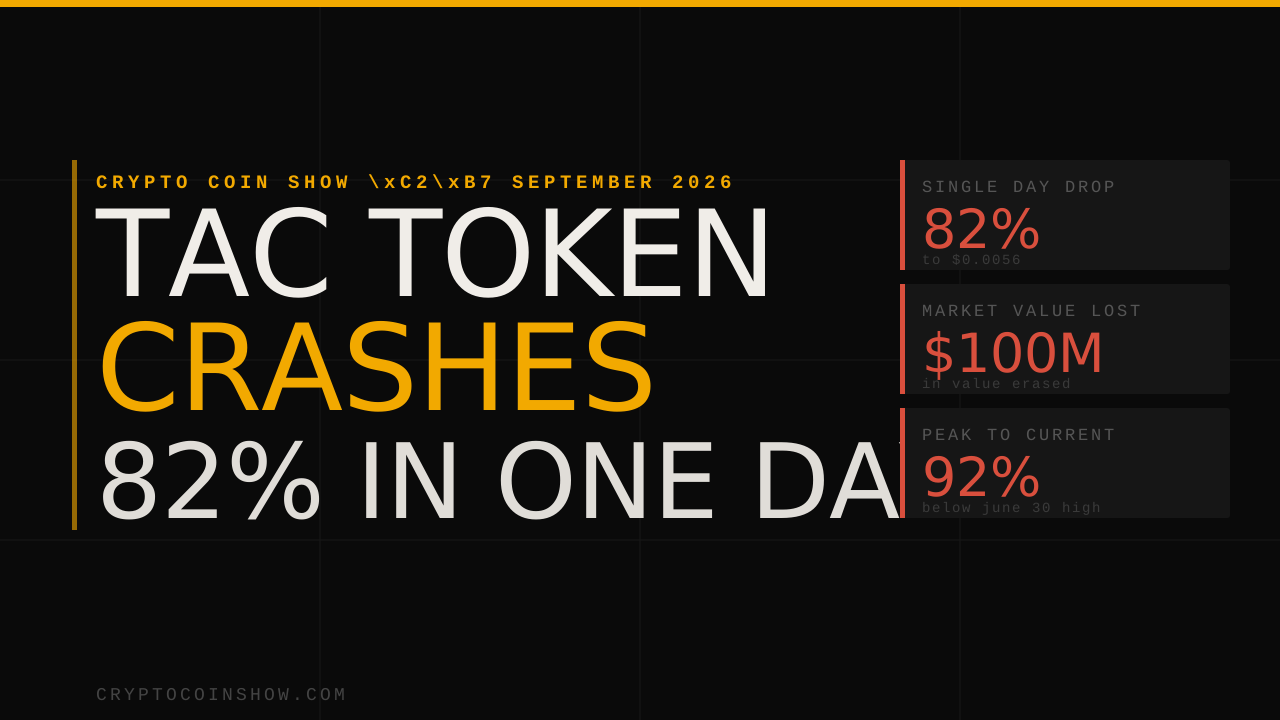
TAC Protocol’s token fell about 82% in 24 hours to around $0.0056, wiping out most of its market value two months after a $2.8 million bridge hack, that the team reclassified as a white-hat incident.
The token last traded at $0.005596, down 81.8% on the day, with its market cap also down to about $26.2 million. TAC hit an intraday high of $0.05285 and a low of $0.005103. Trading volume hit $66.6 million over the same period, over ten times the level from the previous day, a sure sign of heavy turnover.
The slide cut whatever gains TAC made in recent times. It had set a record of $0.06688 on June 30, roughly a week before the crash. At current prices, the token trades about 92% under that peak.
TAC’s claim to fame is that it is the first EVM-compatible blockchain built for the TON ecosystem and Telegram. TAC launched its mainnet and native token in July 2025, with protocols like Morpho, Curve, and Euler deployed at go-live. And an $800 million liquidity campaign to go with it.
TAC is back in the headlines for the wrong reasons
The price rout drags attention back to a difficult spring. On May 11, an attacker carted away with $2.8 million from the TON side of TAC’s cross-chain bridge, hitting balances in USDT, BLUM, and tsTON, per Cryptopolitan’s earlier reporting. TAC halted the bridge and said its native token and ERC-20 assets were not touched.
By May 15, the team had positive news, reporting that the attacker had returned ~ 90% of the funds in a deal that allowed them to keep 10% of the loot.
As TAC proposed, it then dropped any plans of going to court and simply cast the event as a white-hat event, a decision it said it coordinated with security partners and law enforcement.
The bridge itself remained dark for weeks. TAC restored cross-chain transfers between TON and TAC on June 10 after it ensured its patched sequencer software had cleared an independent review by its auditor and TON ecosystem partners.
The team’s own disclosures also conceded that the fix produced 316 duplicate transactions.
Days before this week’s collapse, TAC pushed a network change. It told node operators on June 29 to install a v1.6.0 binary ahead of a June 30 upgrade at block 21,776,800.
No explanation or rationale for the selloff has been presented as of this report.
Readers holding TAC or building on the chain should keep an eye on the project’s X account for a statement on the crash and any follow-up on the June 30 upgrade.
Bitcoin’s rebound has not removed the risk of another volatile move. CryptoQuant is warning that exchange deposit activity has picked up across Bitcoin, Ethereum, and altcoins, a pattern that often appears when traders are preparing to move risk around quickly.
That does not automatically mean a crash is coming. It does mean the market is becoming more sensitive.
For more details, visit the official Cryptoquant platform.
TL;DR
CryptoQuant’s latest market read points to a jump in exchange deposits, including elevated Bitcoin inflows. Rising deposits can be a volatility signal because coins moving to exchanges are more likely to be sold, hedged, rotated, or used as collateral.
The important word is “can.” On-chain deposits are not a perfect sell signal. Sometimes coins move to exchanges for liquidity management, derivative margin, or market-making activity. But when deposits spike while price is already under pressure, traders tend to pay attention.
That is the situation Bitcoin is in now. BTC has stabilised, but the wider market still feels jumpy. ETF flows have been uneven, altcoins are fragile, and macro risk appetite is not giving crypto a clean tailwind.
Why Deposits Matter Here
Exchange inflows matter because they change the available supply profile. Coins sitting in cold storage are usually less likely to hit the market quickly. Coins arriving on exchanges are more flexible. They can be sold, used to open positions, or shifted into other assets.
When a large number of coins arrives at once, the market starts asking why.
If the inflow is driven by whales preparing to sell, spot pressure can build. If it is linked to derivatives positioning, volatility can rise even if the coins are not immediately dumped. If it reflects market makers preparing for higher activity, price can swing both ways.
That is why the signal is more about volatility than direction. The market is being primed for movement.
Bitcoin Needs More Than A Bounce
Bitcoin’s short-term recovery gives bulls room to argue that sellers are losing control. But on-chain deposit pressure complicates that argument.
A healthy rebound usually wants to see coins moving away from exchanges, not toward them. It wants accumulation, calmer leverage, and improving flows. If deposits keep rising, traders may stay defensive even while price holds above recent lows.
The next phase will depend on whether those deposited coins become sell pressure. If Bitcoin absorbs the inflows and holds its recovery, that would be a constructive sign. It would show that the market can handle supply without breaking.
If price rolls over while deposits remain elevated, the CryptoQuant warning will look more serious.
For now, this is not a panic signal. It is a caution flag. Bitcoin has bounced, but the market is still loaded with enough exchange-side activity to make the next move sharp.
This report is based on information from CryptoQuant.
The practical takeaway is that traders should avoid reading the current rebound in isolation. A market can look stable on the surface while exchange-side liquidity is preparing for a larger move. That is why deposit data belongs next to ETF flows, funding conditions, and spot support levels when assessing Bitcoin risk this week.
This article was written by the News Desk and edited by Samuel Rae.
Bitcoin’s break below the $60,000 area has pushed digital asset markets into a more defensive phase, ending months of narrow trading and exposing a market structure that traders say could amplify the next major move.
CryptoSlate’s data show the largest cryptocurrency had been moving sideways since February, when it first tested the $60,000 area.
That long consolidation made the level a widely watched marker for traders, even as macro risks, spot exchange-traded fund outflows and concerns around corporate Bitcoin holders weighed on sentiment.
As a result, the latest decline points to a more fragile setup where large amounts of Bitcoin have moved toward major exchanges, open interest is rising while spot prices remain weak, and professional traders are paying more to protect against another leg lower.
Bitcoin’s break turns exchange flows into a supply test
The clearest sign of stress has appeared in exchange-linked flows.
CryptoQuant data show more than 550,000 BTC moved to deposit addresses linked to Binance and OKX after Bitcoin slipped below the $60,000 area. Binance-linked deposit addresses received more than 220,000 BTC, while OKX-linked addresses received more than 330,000 BTC.
Those figures are well above this year’s normal readings. Binance has averaged about 60,000 BTC in comparable inflows, while OKX has averaged about 95,000 BTC, according to CryptoQuant data.
The latest transfers are the largest of the year and resemble levels last seen during the 2023 bear market.
Bitcoin Exchange Transfers (Source: CryptoQuant)
In cryptocurrency market architecture, a sudden transfer of coins to exchange deposit addresses functions as an initial operational indicator of intent. Users typically route assets to these specific points before funds are aggregated into a platform’s central hot wallets for execution, lending, or collateral assignment.
Still, the timing gives the data more weight. Large transfers toward exchanges during a price decline often raise concern that more supply could become available if the market weakens further.
In a market already trading below a level many investors had watched for months, that potential supply overhang can make rebounds harder to sustain.
The flow also reflects how range-bound markets can become unstable once a familiar level breaks. When traders spend months reacting to the same zone, risk controls, hedges and stop-loss decisions can cluster around it. Once the level gives way, many participants reassess exposure at the same time.
That is why the exchange data are central to the current setup. The market is not only dealing with a lower Bitcoin price. It is also dealing with the possibility that more coins have moved closer to venues where holders can act quickly.
Valuation reset reduces excess, but not volatility risk
The exchange flows are arriving as Bitcoin’s on-chain valuation metrics show that much of the earlier cycle’s excess has already been compressed.
CryptoQuant’s MVRV Z-Score shows Bitcoin’s valuation premium has fallen sharply, moving closer to historical low-valuation areas.
The MVRV framework compares Bitcoin’s market value with its realized value. Market value reflects the current price of circulating coins, while realized value estimates the network’s aggregate cost basis by valuing each coin at the price where it last moved on-chain.
Bitcoin MVRV Score (Source: CryptoQuant)
When market value trades far above realized value, unrealized profits are usually elevated and cyclical risk tends to rise. As the gap narrows, profitability declines, and some speculative pressure eases.
The Z-Score adjusts that relationship by measuring the distance between market value and realized value against Bitcoin’s historical market-cap deviation. That helps traders judge whether Bitcoin is trading near unusually stretched or compressed valuation levels compared with its own history.
The current reading suggests the market has moved closer to reset territory.
However, the indicator does not identify a precise bottom. Bitcoin has traded near cheaper valuation zones before while prices continued to weaken, particularly during periods of poor liquidity, forced selling, or macro stress.
That distinction is important now because valuation and positioning are sending different messages. On-chain data suggest the market is less stretched than it was earlier in the cycle. Market structure data suggest traders are still preparing for a disorderly move.
CryptoQuant data show funding rates across major exchanges have moved back into positive territory while Bitcoin remains weak around the $59,000 to $60,000 area. Positive funding generally means traders holding long positions are paying shorts, a sign that demand for bullish exposure has returned after a more negative stretch.
At the same time, open interest is rising while spot prices remain soft. That means new positions are being built into the decline rather than risk leaving the system.
The combination can make price action more sensitive. If Bitcoin falls further, newly opened long positions could come under pressure. If the market rebounds sharply, traders positioned for more downside may be forced to cover.
Either outcome could make the next move larger than the spot market alone would suggest.
Downside hedges build as institutional interest weakens
To manage this heightened structural uncertainty, institutional traders are aggressively building a defensive position in the options markets.
Singapore-based digital asset trading firm QCP Capital reports that implied volatility metrics are trending systematically higher as market participants pay a premium for downside protection.
According to the firm, demand has centered on July-expiry Bitcoin put options with strike prices between $55,000 and $58,000.
Data from the digital asset derivatives exchange Deribit reinforces this narrative, showing roughly $1.2 billion in open interest clustered specifically at the $55,000 and $50,000 strike zones.
Bitcoin Options Positioning (Source: Deribit)
Compounding this defensive positioning is a structural shift in institutional capital flows.
Data from blockchain analytics firm Glassnode reveals that institutional demand is no longer acting as a reliable sponge for circulating supply. Over the past month, spot Bitcoin exchange-traded funds (ETFs) shed approximately 71,600 BTC, while digital asset trusts added only a marginal 7,500 BTC.
When adjusted for network issuance, the combined net institutional capital flow is -77,000 BTC.
Bitcoin ETF and DAT Companies Flow (Source: Glassnode)
According to Glassnode’s analysis, any near-term spot market recovery will face immediate friction from this persistent wrapper supply overhang until net flows reverse.
This institutional deleveraging trend is explicitly quantified by BlockScholes, whose proprietary Bitcoin risk indices have remained fixed below the -1.0 threshold for more than 23 consecutive days.
BlockScholes notes that the longevity of this trend marks a departure from typical cyclical dips, signaling an ongoing, structural risk reduction by institutional allocators that will likely require a fundamental macroeconomic or industry-specific catalyst to alter.
That leaves Bitcoin in a fragile position after its break below the $60,000 area. On-chain valuation metrics suggest the market has already shed much of its earlier excess, but exchange flows, options positioning, and institutional demand all point to a market still preparing for stress.
The immediate test is whether spot demand can absorb the supply now sitting closer to exchanges. If demand improves, defensive positioning could help fuel a rebound.
If it does not, the same structure could turn the $60,000 break into a broader shock to volatility.
Ortex Technologies, an analytics business, reports that short sellers are increasing their bets that Elon Musk’s SpaceX would continue to decrease after the company’s share price dropped from the highs it attained soon after going public on June 12.
The sale took place during a challenging period for the market as a whole.
The Nasdaq 100 was on track to lose more than $1 trillion in value on Tuesday as key IT businesses and semiconductor stocks declined.
Over the past three trading days, the business, which is anticipated to be included in the Nasdaq 100, has lost approximately $600 billion.
It would close with a market value of $1.95 trillion if Tuesday’s losses continued.
After peaking at $225.64 a few days after its launch, the stock is already down nearly 30%. Short sellers have been enticed into this downturn, which is part of a broader market decline, faster than many had predicted.
Data from S3 Partners indicates that roughly 40 million SpaceX shares are currently held in short positions, representing about 5%–7% of the company’s publicly tradable shares.
Recent figures suggest bearish bets are growing rapidly.
Ortex reports that short interest has climbed from 8% in the prior trading session to 13%, reflecting a sharp increase in the proportion of publicly available shares that have been sold short.
“A jump like this is a clear sign that a growing number of traders are positioning for the price to fall sharply,” stated Peter Hillerberg, co-founder of Ortex.
Borrowing the shares is getting easier
Traders are increasing their bets against the stock because it has become easier and cheaper to borrow shares for short selling.
“Shares are becoming more accessible,” said Sam Pierson, head of research at S3 Partners.
He noted that short sellers were paying about 0.60% annually to borrow shares.
While that is higher than the roughly 0.30% charged for the easiest-to-borrow stocks, it still suggests there is plenty of share supply available and fewer concerns about finding stock to short.
Ortex numbers, which demonstrated that the cost of borrowing is still low at roughly 1% and balances the supply of shares to lend against the desire to short a company, supported this.
At the start of trading, it hit 14%. There is still a lot of stock available for lending, according to Ortex, which says that utilization, or the percentage of available stock that is on loan, is currently at roughly 39%, up from the mid-30s last week.
The approach toward SpaceX is different from those of other large IT firms.
The Magnificent Seven, Apple, Microsoft, Nvidia, Alphabet, Amazon, Meta, and Tesla, only have 1% to 3% of their free floats traded short.
Ortex figures show that borrowing costs for those names are between 0.25% and 0.33%.
Options traders lean bearish
The derivatives market appears to be signaling a similar outlook.
According to Reuters, investors are assigning roughly a 40% probability that SpaceX’s share price will drop below $130 by mid-September.
Steve Sosnick, chief strategist at Interactive Brokers, noted that “The options activity has gotten more balanced.”
However, in several option series expiring between July and September, the number of outstanding put options, which gain value when the stock declines, is nearly double the number of open call options.
Ultimately, speculators who anticipate a decline will probably continue to be drawn to Musk’s rockets-and-AI company due to its high price tag.
Despite the $2 trillion value making it an apparent target, a number of factors, such as Musk’s history of openly opposing short selling and significant acquisitions by institutional and individual investors, may deter short sellers.
A request for comment was not immediately answered by SpaceX.
The aggressive shorting points to a change in how the market sees the company.
Investors appear to be looking past Musk’s long-term promises and focusing more on near-term spending, treating SpaceX as a heavy industrial business rather than a light software play.
Crypto and energy markets are bracing for a possible Black Monday selloff. US-Iran negotiations in Switzerland collapsed over the weekend, reviving fears of an oil shock and a risk-off move into Monday.
Iran’s delegation walked out of the talks in protest over fresh threats from President Donald Trump. Based on this, analysts and traders alike anticipate stocks and crypto could open sharply lower.
Switzerland Walkout Revives Oil and Hormuz Fears
The breakdown came at the Bürgenstock resort in Switzerland. The US, Iran, Pakistan, and Qatar had met there to extend a June 17 truce.
Iran’s team refused a group photo and walked out, state media reported.
Trump had warned he would strike Iran again over its proxies in Lebanon. He also told Iranian officials they would not make it home if Tehran closed the Strait of Hormuz.
That threat carries weight because of the cargo. About 20 million barrels of oil cross the strait each day, near 20% of global consumption, the EIA reports.
Still, the waterway has stayed open through past standoffs. Iran threatened closures in 2011 and 2019 but never followed through.
Brent crude had eased to near $80 a barrel last week as crude oil slipped below the same threshold when tankers resumed transit. However, the walkout now clouds that fragile recovery.
The Iranian delegation will not return to negotiations in Switzerland unless U.S. President Trump apologizes for his threats and Israel withdraws from southern Lebanon, pro-Hezbollah Al-Mayadeen reports. Iran’s state media confirms the Iranians have left the negotiation venue. https://t.co/dxgS8sGLfG
— Ariel Oseran أريئل أوسيران (@ariel_oseran) June 21, 2026
When Trump declared a ceasefire earlier this month, stocks and oil reacted while crypto barely moved.
Bitcoin Holds Steady as Black Monday Calls Spread
So far, crypto has not played along. The Bitcoin (BTC) spot price held near $64,181 on Sunday, a touch higher on the day.
Ethereum (ETH) traded near $1,730. Because crypto runs around the clock, that weekend calm is a live signal, not a closed-market guess.
Crypto also has no brakes. US stocks halt automatically if the S&P 500 falls 7%, 13%, or 20% in a day. Those safeguards were built for exactly this kind of panic.
Crypto carries no such circuit breakers. A Monday slide there would run without a pause. Still, weekend sentiment soured.
“If there isn’t a massive Black Monday Crash tomorrow, I will delete my account,” one user remarked.
The phrase he borrowed carries history. On Black Monday in 1987, the Dow fell 22.6% in one session, still its worst day on record.
However, markets clawed back most of those losses within months.
Trader Ted Pillows made a similar case, calling the risk and reward of buying stocks now poor.
Even so, similar weekend warnings have misfired before, and this one could too, with Qatar and Pakistan are still mediating, and both sides have reasons to step back.
Qatar Announces Launch of Lake Lucerne Summit, First High-Level Committee Meeting with Participation of US, Iran, Pakistan
Doha | June 21, 2026
The State of Qatar announces, in its capacity as a mediator, the launch of the Lake Lucerne Summit and the first meeting of a… pic.twitter.com/Dy99n6Owi1
— Ministry of Foreign Affairs – Qatar (@MofaQatar_EN) June 21, 2026
The risk is not hypothetical. Bitcoin has repeatedly sold off with risk assets rather than acting as a haven.
When Israel struck Iran this month, more than $1 billion in leveraged crypto bets were wiped out in a day. Analysts have since mapped a sharp Bitcoin drop if the war reignites.
Monday’s futures open will be the first real test. A return to fighting could trigger a broad risk-off move across crypto.
A quick path back to talks could calm nerves just as fast. For now, traders are watching oil, the strait, and the next signal from Tehran or Washington.
The U.S. Senate moved a step closer to confirming Kevin Warsh as the next chair of the Federal Reserve on Wednesday.
A divided committee vote advanced his nomination. The move comes amid intensifying political scrutiny and market uncertainty.
The Senate Banking Committee approved Warsh in a 13–11 party-line vote. This clears a key procedural hurdle. It also positions him for likely confirmation by the full Senate before mid-May, when current chair Jerome Powell’s term expires.
Warsh, a former Fed governor and Wall Street financier, has pledged a “regime change” at the central bank. He signaled potential change in communication strategy. He also pointed to changes in balance sheet policy and inflation management.
However, the nomination has exposed deep political fault lines. Republicans have largely backed Warsh as a credible successor. Democrats have warned his appointment could undermine central bank independence. They point to perceived alignment with former President Donald Trump’s policy preferences.
The Fed’s policy outlook and internal tensions
Financial markets are bracing for a potentially volatile transition. Investors expect no immediate policy changes. However, divisions within the Federal Open Market Committee suggest Warsh may face resistance. This could complicate any aggressive shift in interest rate policy.
Warsh has acknowledged the likelihood of internal disagreement. He described the Fed’s policymaking process as a “family fight.” Officials remain split between inflation concerns and calls for easing.
His stance is being closely watched. He has historically been viewed as hawkish. More recent signals indicate openness to rate adjustments under specific conditions. This is particularly true if productivity gains materialize.
Crypto market implications
In digital asset markets, Warsh’s expected appointment is seen as a macro turning point. It is not viewed as a crypto-specific policy shift. Traders are focusing on liquidity and real interest rates.
Anthony Pompliano, a widely followed crypto investor and commentator, said in a recent note:
“When the Fed changes, liquidity changes — and that’s what crypto trades on.”
The remark reflects a prevailing view among crypto participants. Leadership transitions at the Fed can influence global dollar liquidity cycles. These cycles are a primary driver of risk assets, including Bitcoin.
Earlier in 2026, Bitcoin prices showed sensitivity to speculation around Warsh’s nomination. Risk assets weakened as markets priced in a potentially tighter policy stance.
Warsh’s likely confirmation marks a major leadership transition in global finance this year. It comes against a backdrop of persistent inflation and geopolitical tensions. Monetary policy frameworks are also evolving.
While the immediate policy path remains uncertain, analysts broadly agree the appointment could reshape expectations around, the pace of rate cuts or hikes, the Fed’s balance sheet trajectory, and global capital flows into risk assets.
Warsh’s nomination has cleared a decisive institutional hurdle. It is widely expected to proceed to confirmation. The key question for markets is no longer whether he will lead the Fed. It is how aggressively he will attempt to redefine its policy direction. It also depends on how much resistance he will face once in office.
Bitcoin stands at a decisive inflection point where the market’s next major move will likely determine price direction for the coming weeks. With key support levels broken and price action intensifying, the cryptocurrency faces a binary outcome: institutional buyers step in at current levels, or further weakness emerges. This critical juncture will test whether Bitcoin can reclaim lost ground or continue deteriorating toward lower support zones.
The Volatility Test
The current environment is marked by sharp price swings that have created uncertainty across market participants. Analyst Lennaert Snyder notes that these periods of extreme volatility, while intimidating, often precede some of the most reliable trading opportunities.
Bitcoin must now answer a fundamental question: can it execute a meaningful structural breakout to the upside, or will bearish pressure continue dominating price action? The answer hinges on specific technical levels that will either confirm or deny a momentum shift in either direction.
Moments of sharp price swings are intimidating for many market participants, yet they frequently precede some of the highest-conviction trading setups.
— Lennaert Snyder, Market Analyst
The Bullish Case: Resistance Levels to Watch
For upside momentum to develop, Bitcoin must first clear $66,590 on the four-hour timeframe. Reclaiming and holding this initial resistance would signal the beginning of a momentum reversal and provide the first meaningful confirmation for long positioning.
However, a move above $66,590 alone does not constitute a structural shift. The true inflection point sits approximately $2,400 higher at the $68,000 zone, which represents the Point of Control for the entire trading range. Breaking decisively above this area would mark the critical transition from defensive posturing to offensive strength, confirming that buyers have reasserted control over the value area.
Key Resistance Levels
$66,590 — Initial resistance; $68,000 — Point of Control and critical inflection; $71,422 — Secondary target; $76,971 — Major liquidity cluster.
Should Bitcoin successfully reclaim and sustain the $68,000 level, the path opens toward $71,422, with the ultimate objective being the substantial liquidity pool at $76,971. For bullish traders, $68,000 represents the make-or-break level that separates a genuine reversal from a false rally.
The Bearish Scenario: Downside Risk
The downside case remains equally valid. A potential bull trap could materialize if Bitcoin rallies to $66,590 only to face sharp rejection. Such a failure would signal that the rally was merely a liquidity sweep designed to trap aggressive buyers, not a genuine reversal pattern.
Recent price action has already shifted momentum in favor of bears. Bitcoin has broken below the previously significant $65,000 support level—a critical breakdown noted by analyst Ted that weakens the near-term technical structure. This development exposes the market to lower price discovery and embeds downside risk into the equation.
The breakdown below $65,000 has shifted near-term momentum in favor of bears and weakens the immediate technical structure.
— Ted, Technical Analyst
The bearish target zone remains the substantial bid liquidity concentrated between $60,000 and $63,000. This area represents meaningful demand, but whether it proves effective in halting a decline depends significantly on broader market conditions—particularly how equity markets perform in the coming sessions.
Downside Support Zone
The $60,000 to $63,000 band contains substantial liquidity and represents the primary demand zone where bears and bulls may clash. A sweep of these lows appears increasingly probable before any serious reversal attempt materializes.
Industry Context and Institutional Positioning
The cryptocurrency market has matured significantly over the past five years, with institutional capital now representing a meaningful portion of trading volume across major exchanges. This institutional participation fundamentally changes how Bitcoin responds to technical levels and volatility events. When major support levels break, institutional algorithms often accelerate selling, amplifying moves in both directions.
Large asset managers and hedge funds increasingly allocate capital to Bitcoin as a portfolio diversification tool, treating it as digital gold with uncorrelated return characteristics. However, these same institutions employ strict risk management protocols that trigger automatic liquidations during sharp drawdowns. The presence of leverage in perpetual futures markets exacerbates volatility, as forced liquidations cascade through the market when price moves exceed predetermined thresholds.
Spot market demand from corporations and long-term investors provides a counterbalance to this leverage-driven volatility. Public companies holding Bitcoin on their balance sheets—and the growing number of corporations exploring blockchain integration—create a floor beneath panic-driven selloffs. The interplay between these institutional forces will ultimately determine whether current support levels hold or give way to deeper losses.
Market Context and Risk Assessment
Understanding Bitcoin’s technical structure requires zooming out to appreciate the broader price action across the entire established range. The current consolidation has created extreme conditions that often precede significant directional moves.
The broader cryptocurrency market capitalization currently stands at approximately $2.8 trillion, with Bitcoin commanding roughly 47 percent of that value. Altcoins have demonstrated even sharper selling pressure than Bitcoin during the current downturn, suggesting that risk-off sentiment is broadly affecting all digital assets. When altcoins underperform Bitcoin by a substantial margin, it indicates that investors are rotating toward the most liquid, established asset—a defensive positioning that often precedes capitulation selling.
Macroeconomic headwinds have intensified scrutiny on risk assets across all markets. Federal Reserve policy, inflation expectations, and broader geopolitical uncertainties create an environment where traders rotate between safe havens and growth-oriented positions daily. Bitcoin’s role in such an environment remains contested—some view it as a risk-on asset correlated with equities, while others maintain that its supply-constrained characteristics eventually drive institutional accumulation during uncertainty.
For bulls, the clock is ticking. Failure to mount a convincing rally above $68,000 in the near term will likely confirm that weakness persists and attract additional selling. For bears, confirmation comes when $60,000 breaks on volume, opening the door to fresh discovery lower.
Institutional positioning will prove decisive. If large players view current levels as attractive entry points for long positions, aggressive buying could propel Bitcoin past the $68,000 hurdle. Conversely, if institutions treat these levels as distribution opportunities, further downside becomes the path of least resistance.
The macroeconomic environment surrounding cryptocurrency markets cannot be overlooked. Equity market behavior, interest rate expectations, and broader risk sentiment will all influence whether demand emerges at these support levels or whether capitulation accelerates lower. Correlation with the S&P 500 during this period has been notably high, meaning Bitcoin’s next move may ultimately be determined by stock market performance rather than factors intrinsic to the cryptocurrency ecosystem.
Strategic Implications and Market Outlook
The resolution of Bitcoin’s current technical impasse carries implications extending far beyond cryptocurrency markets. A decisive break below the $60,000 support zone would likely trigger capital outflows from digital assets more broadly, potentially accelerating losses across smaller-cap cryptocurrencies. Conversely, institutional buying that drives Bitcoin above $68,000 could catalyze a reversal that attracts fresh capital and reverses negative sentiment momentum.
For traders operating with leverage, position sizing becomes critical. The binary nature of the current setup means that stop losses placed just beyond key technical levels may be triggered by brief wicks rather than genuine directional shifts. Disciplined risk management—limiting position size and accepting that some trades will result in small losses—becomes paramount when volatility reaches these extremes.
The outcome will likely establish the dominant narrative for the next three to six months. If Bitcoin successfully reclaims the $68,000 level and sustains it through multiple test attempts, bullish sentiment will resurface and potentially drive a broader cryptocurrency rally. If weakness persists and lows continue deteriorating, the bear case strengthens and could trigger re-evaluation of longer-term Bitcoin thesis among institutional investors.
Bitcoin’s binary outcome—range high reclaim or weekly lows—will likely resolve within the coming days. Patience and disciplined risk management remain essential as the market navigates this critical juncture. The decision points ahead will shape not only short-term price discovery but also the trajectory of institutional adoption and market maturation across the entire cryptocurrency ecosystem.
Get weekly blockchain insights via the CCS Insider newsletter.