Ethereum remains trapped below a major higher-timeframe resistance cluster despite recovering strongly from its June lows. The recent rejection near local highs has pushed the asset back into an important support zone, while the price is approaching a technical decision point that should determine whether buyers can extend the recovery toward higher resistance or whether another corrective leg unfolds.
ETH Price Analysis: The Daily Chart
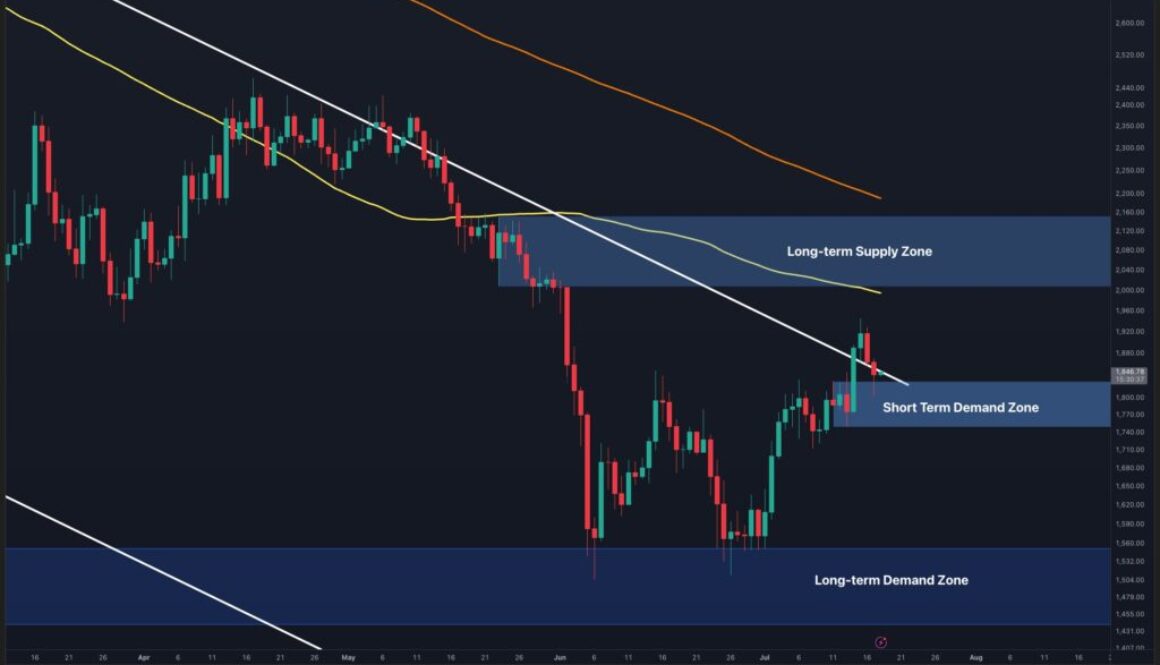
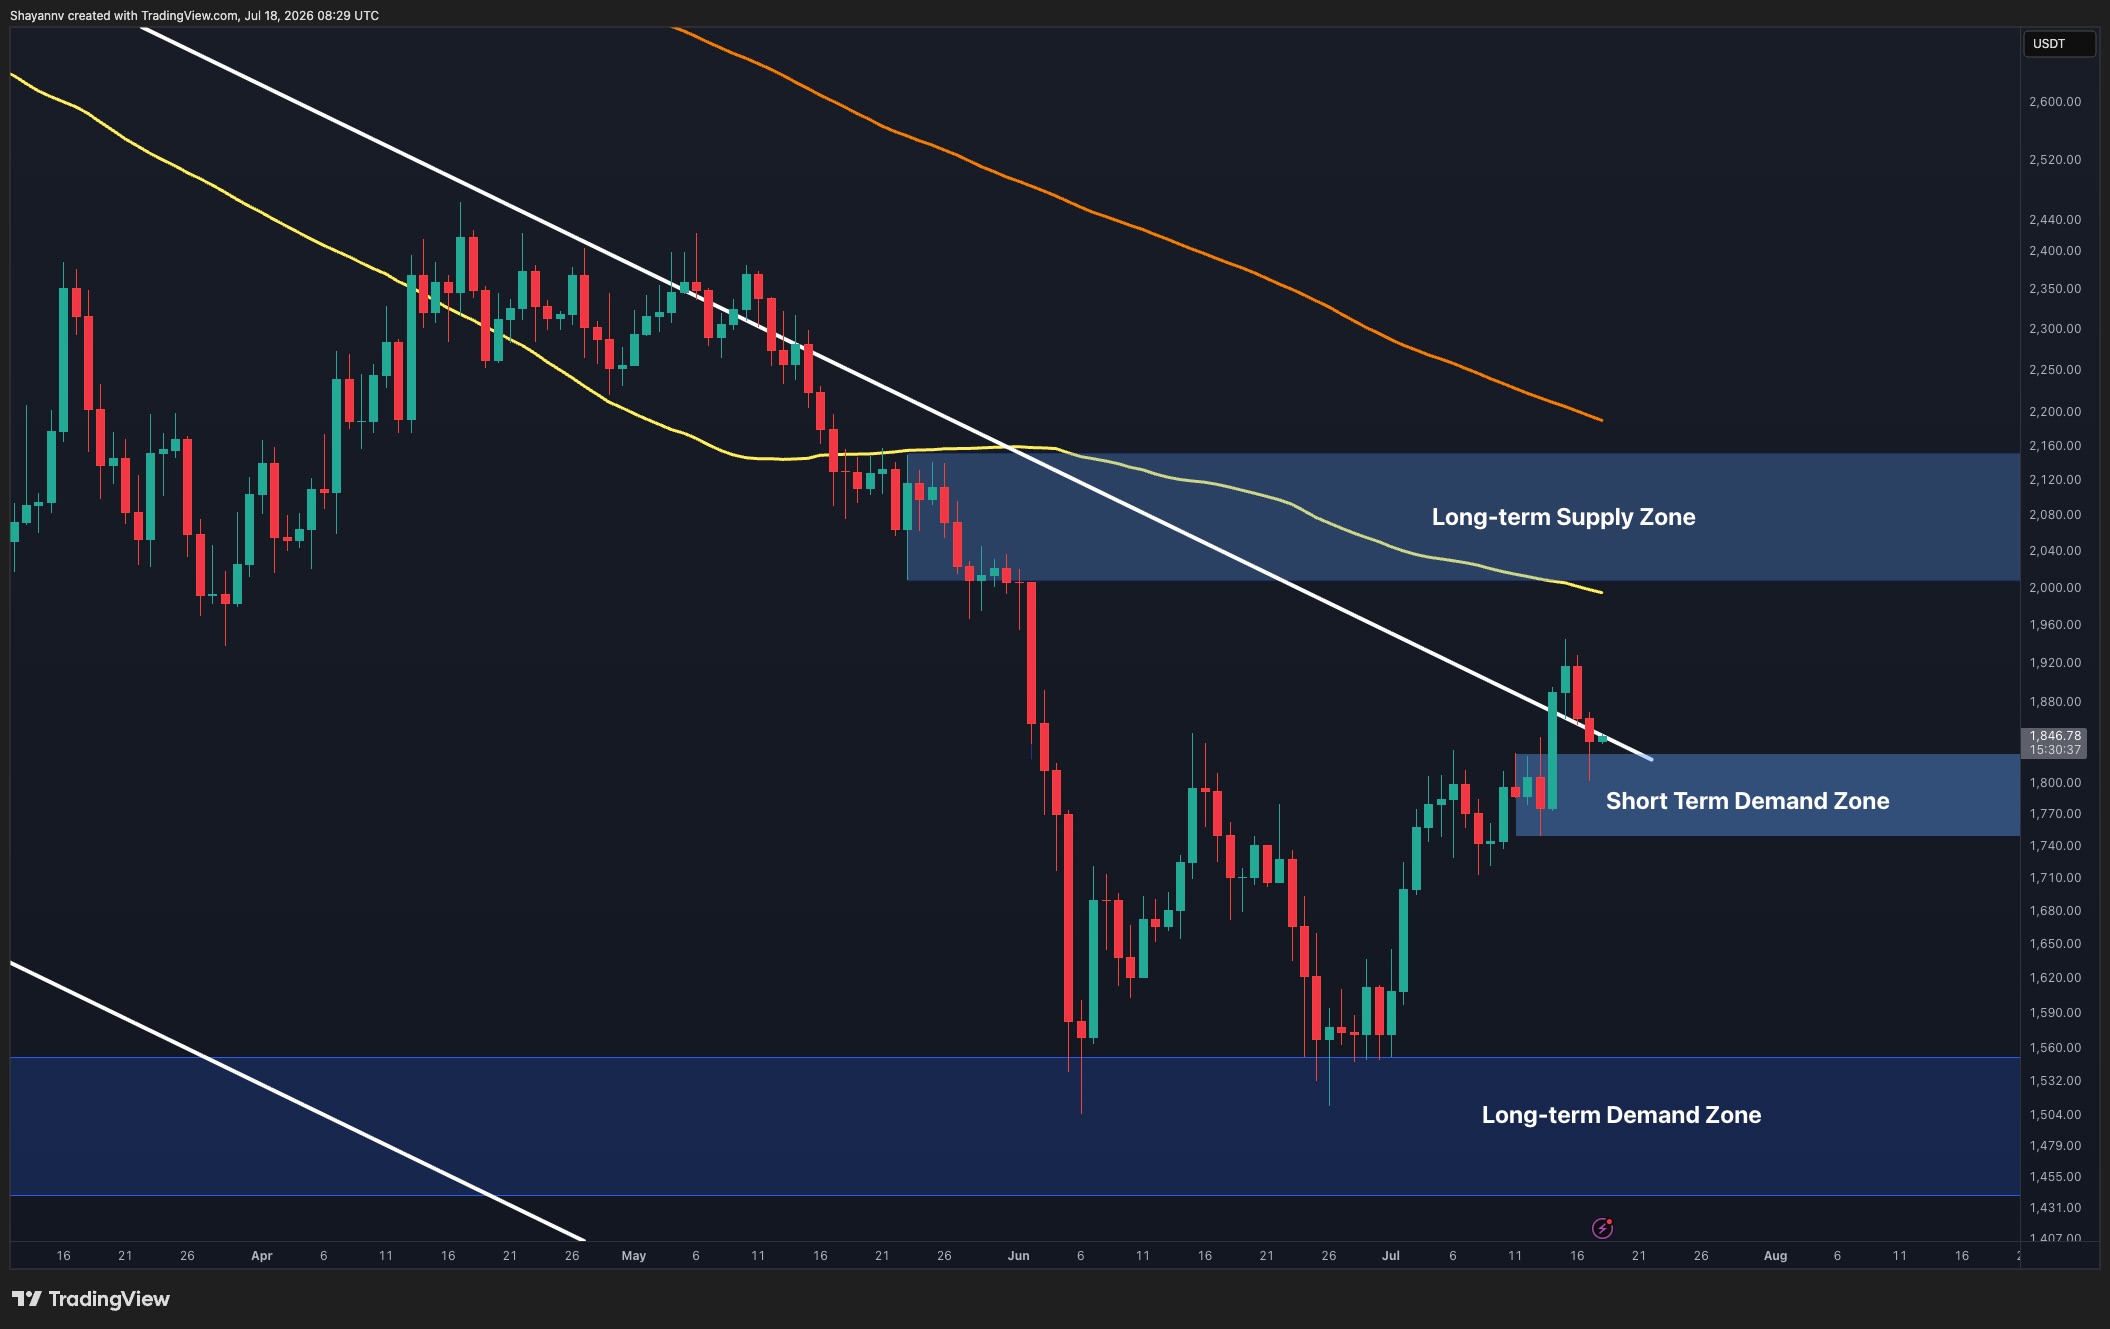
On the daily timeframe, ETH continues to trade below the descending 100-day and 200-day moving averages, confirming that the broader market structure remains bearish despite the recent rebound.
The asset recently failed to sustain a move above the short-term resistance around $1.9K and has now pulled back into the $1.75K-$1.85K demand zone. This region has acted as support throughout the current recovery and now represents the first line of defense for buyers.
As long as Ethereum holds above this area, another push toward the major decision zone between $2K and $2.15K remains possible. This region also aligns with the descending long-term trendline and the declining 100-day moving average, making it the most significant resistance cluster on the daily chart.
A successful breakout above this confluence would mark an important structural improvement, while rejection would likely shift attention back toward the long-term demand zone around $1.45K-$1.55K.
ETH/USDT 4-Hour Chart
The 4-hour chart shows Ethereum pulling back after failing to extend above the recent swing high near $1.95K. The correction has pushed it back to the short-term demand zone around $1.76K-$1.84K, which has repeatedly attracted buyers over the past week.
This area now serves as the immediate support needed to preserve the sequence of higher lows established since early July. Holding above it could allow another attempt toward the upper boundary of the current recovery structure and eventually the daily resistance around $2K.
However, losing this demand zone would likely expose the lower support levels around $1.7K before buyers attempt another recovery.
Sentiment Analysis
The liquidation heatmap highlights a large concentration of short liquidations positioned above the current market, with the most notable liquidity cluster sitting around the $1.95K-$2K region.
Importantly, this liquidity pool aligns closely with the key technical resistance visible on both the daily and 4-hour charts. The cluster sits directly beneath the higher-timeframe supply zone around $2K-$2.15K and near the descending trendline, creating a strong confluence between derivatives positioning and technical resistance.
This alignment increases the probability that Ethereum could first stage an upside liquidity grab into the $1.95K-$2K area to sweep leveraged short positions before facing renewed selling pressure from the overhead supply zone. A decisive breakout through both the liquidity cluster and the daily resistance would invalidate this scenario and instead strengthen the case for a broader bullish reversal.
Cardano is trading near support as ADA investors look for a stronger reason to step back into the market.
The project still has one of the most committed communities in crypto, and its development roadmap remains a central part of the long-term argument. But price action has been quieter, and traders are watching whether support can hold while the broader market deals with weaker risk appetite.
That is the current tension for ADA. Cardano has not disappeared from the conversation, but it needs a fresh catalyst strong enough to move beyond patient community support and bring wider market interest back.
Until that happens, ADA may remain stuck in a consolidation pattern.
TL;DR
Cardano is testing support as ADA traders wait for a stronger catalyst.
Development progress remains important, but price action needs clearer demand.
The next move depends on whether buyers defend the range or let broader market weakness take control.
Cardano Still Trades On Patience
Cardano has always been a slower-moving story than many rival crypto ecosystems.
Supporters see that as a strength. They argue that the project’s research-driven approach, formal methods, governance focus, and long development timelines create a more durable foundation. Critics see the same traits differently. They argue that Cardano moves too slowly and struggles to turn roadmap progress into market excitement.
Both views shape how ADA trades.
When the market is bullish, Cardano can benefit from renewed attention because traders remember the size of its community and the scale of its previous cycles. When the market is cautious, ADA often needs clearer evidence of growth to attract fresh capital.
That is why the current support test matters. It is not only about whether ADA can hold a technical level. It is about whether the market still has enough confidence to accumulate while waiting for the next major development.
Development Progress Needs Market Translation
Cardano development progress and the Ouroboros roadmap remain part of the current story. That is important because Cardano’s value proposition has always been tied closely to its technical roadmap.
But development progress and market demand are not the same thing.
A blockchain can continue improving while its token trades sideways. Developers can ship upgrades while traders focus elsewhere. The market often needs a bridge between technical progress and visible usage, whether that comes through DeFi activity, stablecoin growth, real-world applications, governance participation, or stronger developer traction.
For ADA, that bridge is the key.
If Cardano can show that roadmap progress is leading to more users, more liquidity, and more application activity, the token has a better chance of attracting renewed attention. If updates remain mostly internal to the existing community, the market may treat them as positive but not urgent.
That does not mean development is unimportant. It means traders need to see how it changes demand.
ADA Needs A Cleaner Narrative
Cardano’s challenge is partly narrative.
Bitcoin has the macro and ETF story. Ethereum has smart contracts, DeFi, staking, and institutional access. Solana has speed, apps, and retail activity. XRP has regulation and payments. Dogecoin has meme liquidity. Chainlink has infrastructure.
Cardano’s story is more diffuse. It includes governance, research, staking, decentralisation, development discipline, and long-term ecosystem building. Those are serious themes, but they can be harder to turn into a simple market catalyst.
That makes support zones more important. If ADA holds while the story is quiet, it gives bulls time for the next catalyst to arrive. If support fails, the market may force the narrative to reset at lower levels.
The next few sessions will show whether traders are willing to defend ADA or whether capital keeps rotating toward assets with clearer near-term momentum.
A strong bounce would not solve everything, but it would show that buyers remain active. Continued weakness would raise the pressure on Cardano to deliver a more visible reason for wider market participation.
For now, ADA looks like a token waiting for confirmation. The community remains committed, the roadmap remains active, and the long-term debate is still alive. But the market wants a stronger signal.
That signal could come from development milestones, ecosystem growth, governance progress, or a broader altcoin recovery. Until then, Cardano’s support test is exactly that: a test of patience, confidence, and whether the next catalyst is close enough to matter.
This article is based on information from the Cardano Foundation.
This article was written by the News Desk and edited by Samuel Rae.
Chainlink is holding near a key support area while the market continues to judge whether its cross-chain infrastructure story can turn into durable demand for LINK.
The token has been trading around levels that matter to short-term traders, but the larger Chainlink conversation is not only about price. It is about whether CCIP, data feeds, and institutional integrations can keep moving from announcements into real usage.
That distinction matters. Chainlink has one of the clearest infrastructure narratives in crypto, especially around oracles, tokenization, and cross-chain communication. But infrastructure narratives take time to prove themselves. The market wants adoption, volume, and recurring demand — not just another list of integrations.
For LINK holders, the current support test is therefore about more than the chart.
TL;DR
Chainlink is holding near a key support zone as traders watch LINK’s next move.
CCIP adoption remains central to the longer-term Chainlink story.
The market wants evidence that integrations are translating into sustained usage and demand.
Chainlink’s Story Is Bigger Than One Price Level
Chainlink is not a typical altcoin story.
The project sits underneath a large part of the crypto infrastructure stack through oracle services, data feeds, automation, proof-of-reserve tools, and cross-chain messaging. That makes it important even when LINK price action is quiet.
The problem for traders is that infrastructure value does not always translate cleanly into token momentum. A new integration can be useful. A major institution can test Chainlink tools. CCIP can expand across ecosystems. But the market still has to decide how much of that activity should be reflected in LINK’s price.
That is why support levels matter in the short term, but they do not tell the whole story.
If LINK holds support while adoption keeps growing, bulls can argue that the market is gradually pricing in Chainlink’s role as cross-chain infrastructure. If support fails despite continued announcements, traders may question whether the token is capturing enough of the network’s relevance.
The current setup sits between those two readings.
CCIP Is The Part Traders Keep Coming Back To
Chainlink’s Cross-Chain Interoperability Protocol has become one of the most important parts of its market narrative.
CCIP is designed to help move data and value across blockchains in a more secure and standardised way. That matters because crypto remains fragmented. Liquidity, assets, applications, and users are spread across many networks, and institutions are unlikely to tolerate messy bridging risk at scale.
If CCIP becomes a widely used standard, Chainlink’s position in the market strengthens.
CCIP activity and integrations are the key areas to watch in the current Chainlink setup. That is the right area to watch. The market does not need another vague infrastructure claim. It needs evidence that real projects, institutions, or networks are using Chainlink tools in ways that create recurring demand.
That evidence can come through transaction volume, value transferred, integrations moving into production, and institutional use cases that go beyond pilot programmes.
Until then, CCIP remains a strong narrative with a live adoption test.
LINK Needs Usage To Beat The Altcoin Cycle
Like other major altcoins, LINK still trades inside the broader crypto liquidity cycle.
When risk appetite is strong, infrastructure tokens can rally as investors look for high-quality altcoin exposure. When the market weakens, even strong projects can fall if capital rotates back to Bitcoin, stablecoins, or cash.
That is why Chainlink’s support area matters now. It shows whether buyers are willing to defend LINK during a less forgiving market.
The stronger case for LINK is that Chainlink has a clearer utility story than many altcoins. Its tools are used across DeFi, data, and cross-chain environments. It is also one of the few crypto projects that regularly appears in conversations about institutional infrastructure.
The weaker case is that token demand remains hard to model. Traders may believe Chainlink is important while still questioning whether LINK captures enough of that importance during quieter market periods.
That tension is not new, but it is becoming more important as the market matures.
If CCIP usage continues expanding and LINK holds support, the token could regain attention as an infrastructure play rather than a short-term altcoin trade. If usage data remains unclear and support breaks, traders may wait for a better entry or stronger confirmation.
For now, Chainlink’s story remains intact, but the market wants more proof. The next phase depends on whether adoption becomes visible enough to support the price narrative.
This article is based on information from Chainlink.
This article was written by the News Desk and edited by Samuel Rae.
Japan has bought its way into the advanced models and chip industry after a year of the United States dominating the space, with China pouring subsidies into the machines that use them.
Why is Japan suddenly making a big AI chip purchase?
Japan’s trade ministry has announced that it will buy 27,500 of Nvidia’s (NASDAQ: NVDA) next-generation “Rubin” AI chips to power a state-backed AI project called Noetra, led by SoftBank (TYO:9984) and backed by ¥1 trillion (about $6.3 billion) over five years. Construction is scheduled to begin in April 2027, with operations expected to start in June 2028.
So far in the AI race, the U.S. has been protecting its lead in advanced models and chips, while China has owned the robotics front. Cryptopolitan reported that Chinese factories shipped roughly 97% of the world’s humanoid robots last year, about 19,000 units, and operate the largest industrial robot fleet on the planet, nearly 2 million units.
Instead of trying to beat the U.S. or China in general-purpose AI, Japan is focusing on “physical AI,” which is the software that lets robots sense a factory floor and act on it. The Noetra consortium plans to build a massive 140-megawatt AI factory around the 27,500 Rubin chips.
Nvidia CEO Jensen Huang framed Japan’s manufacturing background as the asset that makes the plan work, saying the manufacturing industry’s “know-how” is the country’s treasure.
Noetra brings in 44 companies, including NEC, Honda, and Sony Group. Nvidia will supply its Nemotron and Cosmos foundation models plus chip technology for robots, while Fujitsu is building an operating system for physical AI.
At a roundtable hosted by Fujitsu, Nvidia discussed manufacturing, logistics, and healthcare uses with robot makers Fanuc, Yaskawa Electric, and Kawasaki Heavy Industries.
Nvidia is already developing manufacturing robots with Toyota and wants to widen the work to Honda, Mitsubishi Heavy Industries and Hitachi. 13 research bodies, including Tokyo University of Science, the University of Cambridge and the University of Oxford have been brought together in a national institute to push the underlying research.
The government is putting ¥387.3 billion (about $2.4 billion) into the effort this year alone. The computing power will sit in a large data center on the site of a former Sharp factory in Sakai, Osaka Prefecture.
However, due to its declining population, Japan is suffering from severe labor shortages. Huang pointed out the shortage, saying that automation, AI, and robotics will make the economy boom again.
Can Japan catch up to China’s huge lead in robotics?
China’s dominance in robotics came from its electric-vehicle supply chain and roughly $300 billion in planned robotics and AI subsidies under its 2026-2030 five-year plan. Its lead in industrial robots is about 4.5 times Japan’s installed base.
However, the Mercator Institute for China Studies found that Chinese humanoids lack precision and dexterity and lean heavily on Nvidia’s chips and software— the same hardware that Japan will be using.
The Japanese government aims to capture more than 30% of the estimated ¥60 trillion (about $378 billion) global robotics market by 2040.
Noetra’s president, Hironobu Tamba, who previously led SoftBank’s large language model development, said the goal is to provide a “genuine third option,” not just for Japan, but for others as well. Noetra plans to release an AI model by March next year, followed by regular updates, with a model tailored for robotics applications within a few years.
Cryptopolitan recently reported that robotics is only about 1% of Nvidia’s revenue. The company is chasing that revenue growth in Japan even as it restricts chip sales to China under U.S. export rules.
Crypto trader Axel Bitblaze has laid out a fresh market thesis built on a video from analyst Taiki Maeda, arguing that assets like Hyperliquid (HYPE), Lighter (LIT), and Zcash (ZEC) are already trading like winners of the next cycle while most investors are waiting for a fourth-quarter bottom.
He says that markets tend to move before the crowd agrees a bottom has formed, so the better window to position could be mid-to-late Q3 and not whenever things look safe.
The Case for HYPE, LIT, and ZEC
On July 15, Maeda shared a video on his X account in which he said that crypto was bottoming and that he would be longing HYPE, LIT, and ZEC.
His take was expanded on by Bitblaze in a July 16 post, who noted that Hyperliquid has bought back about 3.4% of the circulating HYPE supply this year, allowing the token to perform well even as sector mainstays such as Bitcoin (BTC) struggled.
“If BTC volatility causes another $HYPE dip without changing its fundamentals… that could be an accumulation opportunity,” wrote the analyst.
Lighter’s LIT token was presented as a higher-risk alternative, with Bitblaze crediting its reported partnership with Robinhood for giving the decentralized perpetual exchange access to a much wider audience. He also noted that buybacks have removed more than 6% of LIT’s circulating supply, helping to push it to an all-time high on the second-to-last day of 2025, when many altcoins were losing ground.
Meanwhile, ZEC carries the most caution. In his market update video, Maeda said he sold the privacy coin after the discovery of a vulnerability in its Orchard shielded pool that could have allowed bad actors to create unlimited amounts of fake ZEC, triggering a 60% collapse. He did, however, buy most of the ZEC back after reassessing the project’s outlook, with the Ironwood upgrade set for July 28 expected to introduce stronger quantum resistance and use formal verification to reduce the risk of hidden bugs.
That update, according to Bitblaze, could help push up the asset’s price. Recall that last week, Zcash founder Zooko Wilcox said that they were close to producing a mathematical proof that Ironwood’s new shielded pools have no undetectable counterfeiting bugs, taking ZEC’s price past $500.
The token is trading at about 0.8% of Bitcoin’s market cap, and per Maeda’s model, it could go anywhere between $650 and $700 if that ratio climbs back to 1%.
Traders Urged Not to Wait for Bitcoin
Bitblaze said that crypto has been in a bear market since the euphoria experienced in mid-2025 when ETH was closing in on $5,000. Now, people are waiting for the bottom, which, according to him, has been penciled in for Q4 2026.
But he believes the market has a tendency to “front-run what everyone expects,” meaning it is better for traders to start positioning themselves between August and September “before the recovery becomes obvious.”
“Don’t wait for Bitcoin and the entire market to look perfect,” the analyst advised. “The next winner usually starts separating from the market before everyone accepts that the bottom is forming.”
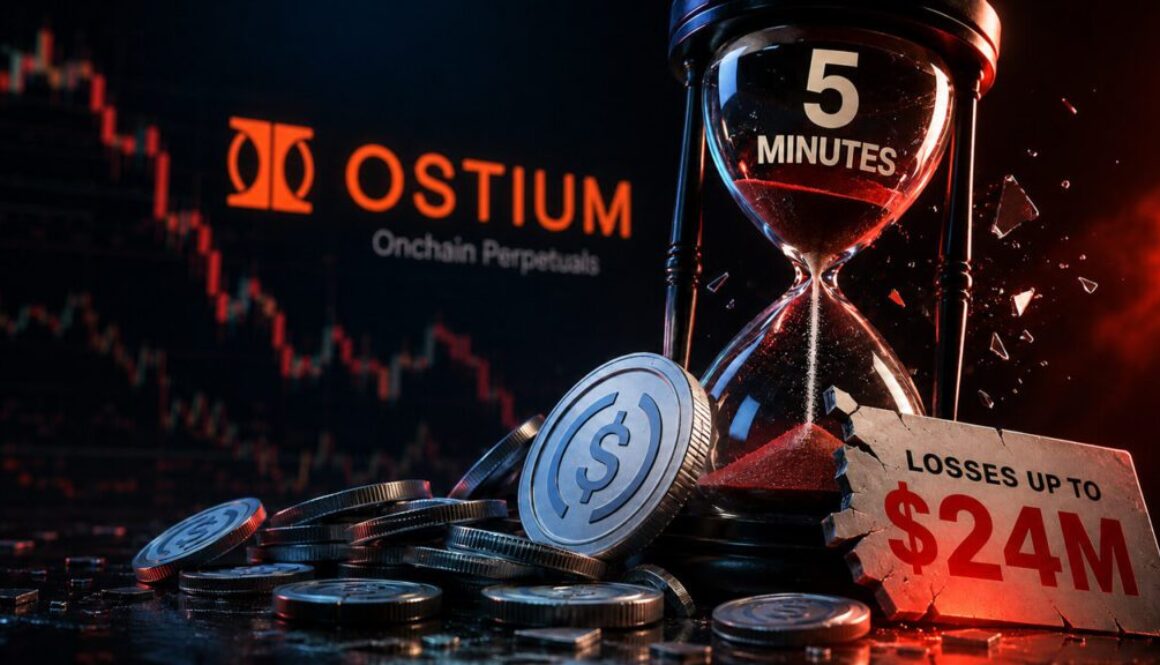
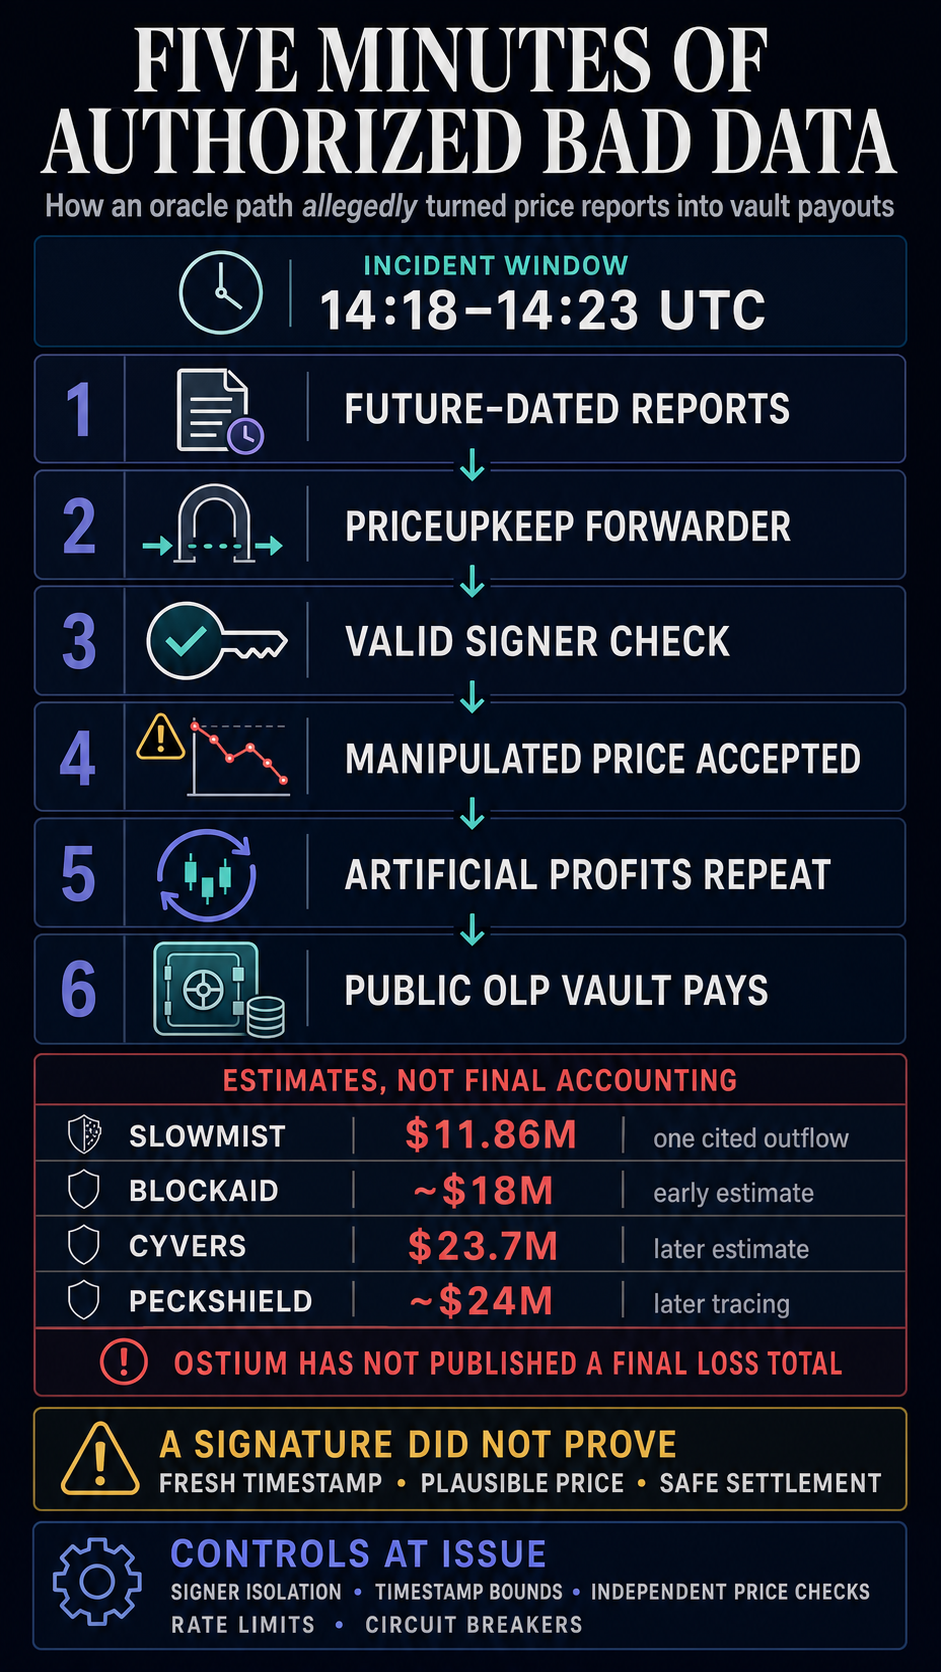
Ostium, an on-chain perpetuals trading platform, said a five-minute security incident caused losses from its public liquidity vault. Security firms estimated the exploit at up to $24 million.
Co-founder Kaledora Kiernan-Linn confirmed that the issue ran from 14:18 to 14:23 UTC on July 15 and affected the public Ostium Liquidity Provider (OLP) vault. She said the team identified it within minutes and coordinated a trading pause within the hour. The statement did not give a definitive loss total, identify the root cause, or provide a final postmortem.
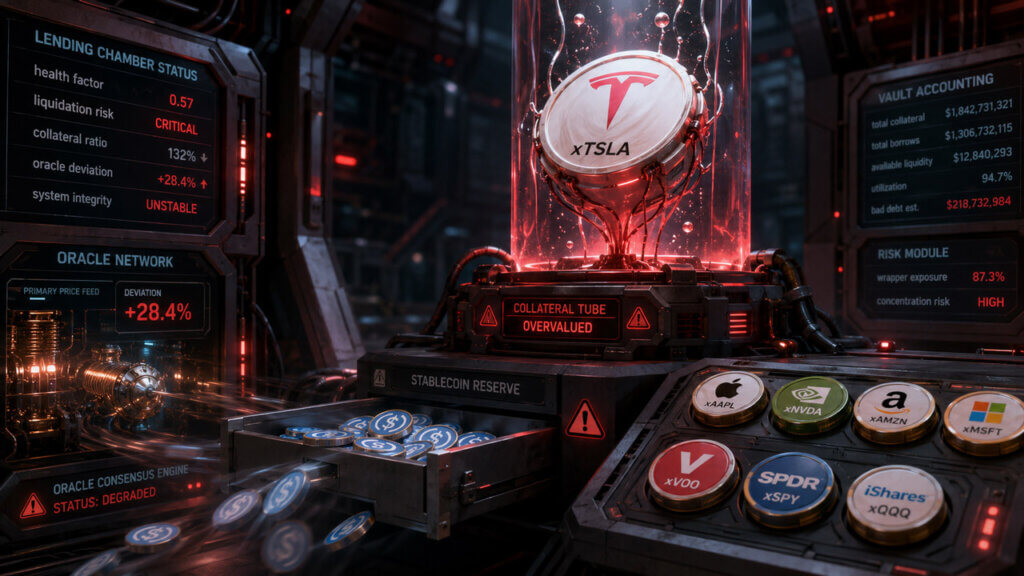
Security firms said authorized data, rather than a missing signature, sat at the center of the incident. Blockaid and Cyvers said a registered PriceUpKeep forwarder submitted future-dated, authorized oracle reports that created artificial trading profits.
SlowMist said an authorized signer supplied validly signed manipulated data used for repeated profitable trades. Those descriptions remain third-party findings pending Ostium’s postmortem.
Cryptographic authentication can establish that a permitted key signed a report. Price plausibility, timestamp freshness, and settlement safety require separate controls.
The OstiumVerifier code linked from Ostium’s security documentation recovers an ECDSA signer and checks whether the signer is authorized, but that verifier function does not enforce a price-plausibility test or timestamp bound.
The code does not appear to identify which implementation was active during the incident or whether separate contracts applied those checks. Any timestamp, replay, price-deviation, or multi-source safeguards would have to operate elsewhere in the execution path.
Ostium’s protocol documentation states that the OLP vault holds traders’ collateral and pays out winning trades immediately on-chain. If artificial profits were accepted for settlement, vault liquidity funded the payouts.
Published estimates rose as tracing continued. Blockaid put the payout near $18 million, Cyvers estimated $23.7 million, and PeckShield later described roughly $24 million drained.
SlowMist’s lower $11.86 million figure appears to track one 11,862,444.782 USDC vault outflow visible in its cited transaction.
PeckShield said the extracted USDC was swapped into 12,080 ETH and that 10,540 ETH had reached Tornado Cash by its update. Kiernan-Linn said Ostium was working with law enforcement, SEAL 911, and third-party security specialists.
The mechanics distinguish Ostium from a similar issue with Bonzo Lend, a Hedera lender hit four days earlier. Bonzo’s incident report said its verifier accepted a proof carrying no valid signature. In Ostium’s case, security firms allege the reports came through an authorized signer path: authentication succeeded, but the data was allegedly unsafe.
Ostium still has to establish whether a signer key was compromised, an authorized operator acted maliciously, or another privileged path was abused.
Its remediation will be judged by whether signer isolation, tight timestamp bounds, independent price checks, rate limits, and circuit breakers can prevent one trusted path from turning minutes of bad data into another vault payout.
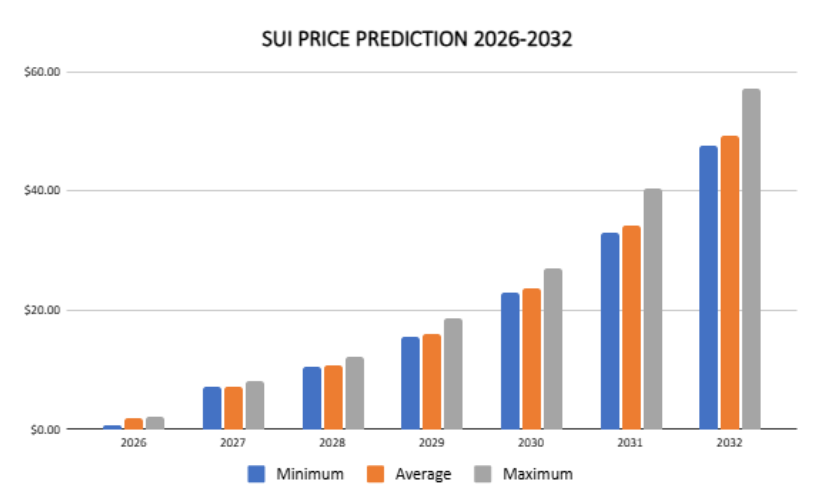
Our SUI price prediction indicates a high of $2.07 by the end of 2026.
In 2028, SUI will range between $10.47 and $12.10, with an average price of $10.83.
In 2031, it will range between $33.01 and $40.39, with an average price of $34.20.
Our SUI price prediction points to a high of $2.07 by the end of 2026, an average price of $10.83 in 2028, and a potential average of $34.20 by 2031. If you’re an investor, trader, or crypto enthusiast weighing SUI‘s future upside and investment potential, this forecast breaks down the data that matters: historical price action, technical indicators, short- and long-term projections from 2026 to 2032, market sentiment, recent news, and whether SUI looks like a good investment. In a volatile market, understanding SUI’s likely price path and the network developments shaping it can help you make more informed decisions over the next few years.
Overview
Cryptocurrency
Sui
Symbol
SUI
Current Sui price
$0.7474
24-hour trading volume
$231.61M
Circulating supply
4.05B
Market capitalization
$3.02B
Total supply
10B
All-time high
$5.35 on Jan 6, 2025
All-time low
$0.3643 on Oct 19, 2023
24-hour high
$0.7638
24-hour low
$0.7343
SUI price prediction: Technical analysis
Metric
Value
Volatility (30-day variation)
4.00% (Medium)
50-day SMA
$0.7574
200-day SMA
$1.03
Sentiment
Neutral
Green days
11/30 (37%)
Fear and Greed Index
25 (Extreme Fear)
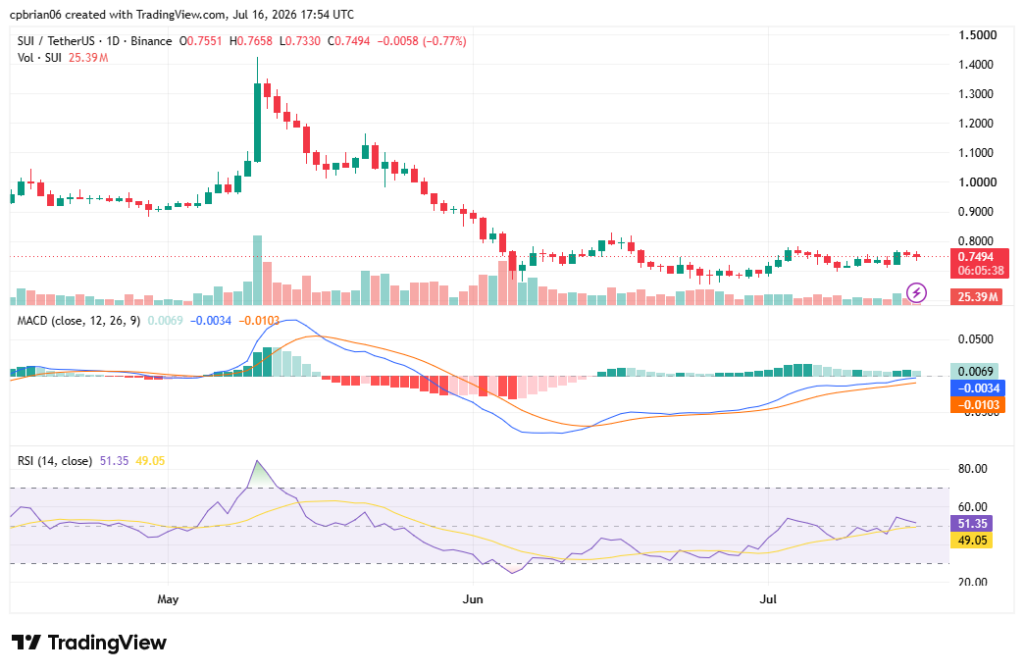
SUI also remains below its 50-day and 200-day simple moving averages, indicating a dominant daily bearish trend. In any forecast, technical factors should be weighed alongside fundamental factors.
SUI price analysis
On July 16, SUI coin fell by 0.26% over the past 24 hours and 0.49% over the past 30 days. Its trading volume rose 8.86% to $231M over 24 hours, signaling rising conviction in the trend, with short-term price action tracking the broader cryptocurrency markets.
SUI is neutral, having faced resistance levels at $0.811. The candles are coherent, supporting the neutral sentiment. It has technical support in the $0.50- $0.66 range. If bullish pressure resumes, it could test $0.80, then $0.89.
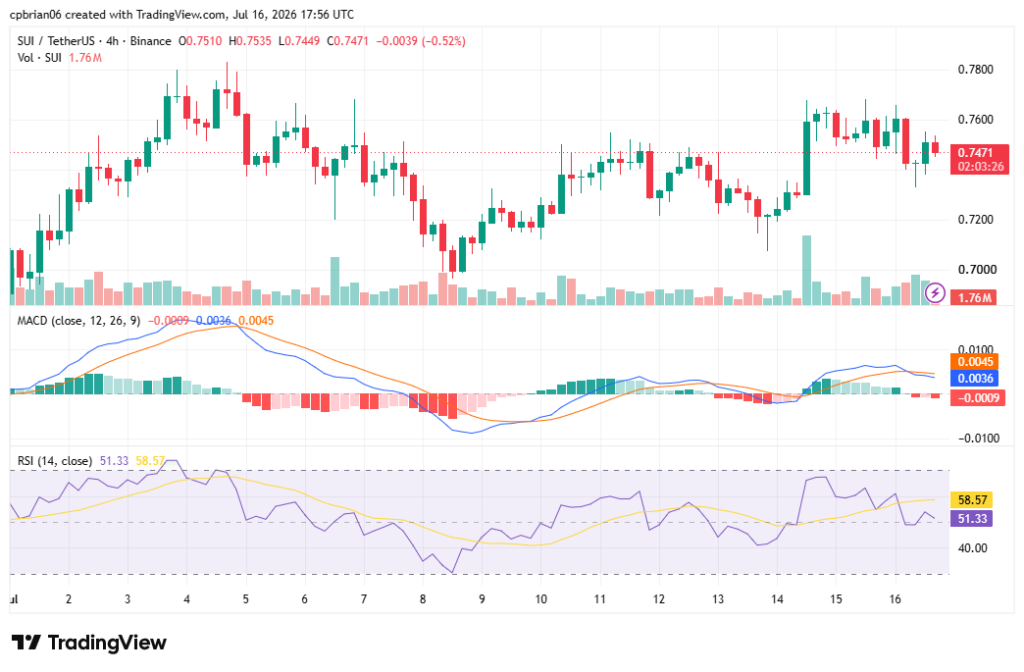
SUI is volatile on this timeframe and is on its next leg up. Support and resistance levels are at $0.699 and $0.771, respectively. Its Relative Strength Index (RSI) is now at 51.33. It is oversold when the value crosses below 30.
SUI technical indicators: Levels and action
Daily simple moving average (SMA)
Period
Value ($)
Action
SMA 3
0.7453
BUY
SMA 5
0.7405
BUY
SMA 10
0.7343
BUY
SMA 21
0.7244
BUY
SMA 50
0.7574
SELL
SMA 100
0.8816
SELL
SMA 200
1.03
SELL
Daily exponential moving average (EMA)
Period
Value ($)
Action
EMA 3
0.7493
BUY
EMA 5
0.7443
BUY
EMA 10
0.7382
BUY
EMA 21
0.7369
BUY
EMA 50
0.7791
SELL
EMA 100
0.8695
SELL
EMA 200
1.16
SELL
What to expect from the SUI price analysis next?
The short-term charts show negative momentum, while key technical indicators remain neutral unless a bullish continuation develops above nearby resistance. Next week’s price action depends on whether support at $0.699 holds.
Why is SUI down?
Sui’s drop closely mirrors Bitcoin’s decline, indicating it moved as a high-beta asset during a broad market sell-off. The total crypto market cap fell 1.44% to $2.2T.
Recent news
Sui blockchain has processed nearly $65 billion in stablecoin transactions since June 10, following an update that eliminated fees for stablecoin transfers. This fee removal, aimed at simplifying B2B payments and retail use, has boosted transaction volumes and could challenge traditional payment systems like SWIFT.
Will SUI reach $10?
According to the Cryptopolitan price prediction, SUI is expected to reach $10 in 2027, with an average price of $10.83 for the year.
Will SUI reach $100?
It remains unlikely that SUI will rise to $100 before 2032.
Will SUI reach $1,000?
It remains unlikely that SUI will rise to $1,000 before 2032.
How high can Sui go?
Per the Cryptopolitan price prediction, SUI could reach $4.77 by the end of 2026, while some long-term models place it in the $2.00-$3.50 range under favorable ecosystem expansion and market recovery. Its long-term potential will also depend on how the network handles token unlocks, institutional adoption, and scaling execution.
Is SUI crypto a good investment?
Should the market sentiment change, SUI will rise to its previous highs. SUI’s price predictions for 2032 are optimistic as global adoption of decentralized applications rises, though the long-term upside also depends on how Sui competes with Solana and Ethereum Layer 2s and manages that competitive risk.
The native token supports network economics, and the SUI token is used to pay gas and transaction fees, participate in governance, and support liquid staking, which can strengthen demand if usage improves and fresh capital follows continued innovation. Sui uses a delegated proof-of-stake model, where validators and delegators help secure the blockchain and earn rewards. Integrations with major tech frameworks expand developer access in SUI. Its architecture also emphasizes parallel execution, horizontal scaling, low-latency transactions, and deep composability.
SUI price prediction July 2026
The SUI price forecast for July ranges from $0.65 to $1.10. Next month, traders should watch whether support holds and momentum improves after the May range. The average price for the month will be $0.89.
Month
Potential low ($)
Potential average ($)
Potential high ($)
July
0.65
0.89
1.10
SUI price prediction 2026
For 2026, SUI’s price will range between $0.68 and $2.07. Some analyst models place the end-2026 price between $1.20 and $1.50, depending on broader market cycles, while a stronger bull run would likely be needed to push SUI toward the upper end of that range as investors shift toward digital assets during changing macro conditions. Alternative long-range forecasts put Sui Crypto at $0.7545 by the end of 2026, $3.33 by 2030, and $5.32 by 2040, while some 2025 projections targeted $2.85 to $3.00 under favorable conditions. The average price for the year will be $1.77.
Year
Potential low ($)
Potential average ($)
Potential high ($)
2026
0.62
1.77
2.07
SUI price prediction 2027-2032
Year
Potential low ($)
Potential average ($)
Potential high ($)
2027
7.05
7.24
8.16
2028
10.47
10.83
12.10
2029
15.50
16.04
18.66
2030
22.96
23.77
27.04
2031
33.01
34.20
40.39
2032
47.50
49.21
57.09
Sui price prediction 2027
SUI coin price prediction estimates a range of $10.47 to $12.10, with an average of $10.83.
Sui price prediction 2028
SUI network coin price prediction climbs even higher into 2028. According to the prediction, the SUI cost will range from $15.50 to $18.66, with an average of $16.04.
Sui price prediction 2029
According to the SUI forecast for 2029, the price of SUI will range from $22.96 to $27.04, with an average closing price of $23.77.
Sui price prediction 2030
According to the 2030 SUI price prediction, the price will range from $33.01 to $40.39, with an average of $34.20.
Sui price prediction 2031
The SUI crypto price forecast for 2031 is a maximum price of $57.09. It will reach a minimum price of $47.50 and an average price of $49.21.
Sui crypto price prediction 2032
The SUI’s price prediction ranges from $7.05 to $8.16, with an average of $7.24. The predictions indicate long-term growth.
SUI price prediction 2026 – 2032
SUI market price prediction: Analysts’ SUI price forecast
Our predictions show that SUI will reach a high of $2.07 in 2026, and future forecasts will depend not only on adoption and scaling but also on whether the native token captures value as ecosystem usage grows. In 2028, it will range between $10.47 and $12.10, with an average of $10.83. In 2030, it will range between $33.01 and $40.39, with an average of $34.20. Sustained capital inflows and higher on-chain usage would strengthen the long-term case.
If you plan to buy sui or trade sui, base that decision on your own research rather than headline targets alone. Note that the predictions are not investment advice and that risk can also rise with supply growth if token unlock pressure persists. Seek independent consultation or do your own research.
Exchanges such as Binance, OKX, KuCoin, and Bybit hosted activities toward the initial distribution of SUI in April 2023.
Sui was developed by Mysten Labs, the team behind the Layer-1 chain.
Its object-centric data model allows tracking of individual objects, and its architecture uses parallel execution to handle many transactions with low latency while maintaining efficient performance.
The Move programming language is used to create digital assets and smart contracts in a more secure environment.
Tools such as zkLogin and sponsored transactions make sui easier for mainstream users by simplifying access and fees, while the design also supports deep composability.
The chain is built for high throughput, fast transactions, and real-world apps such as gaming and finance, with low-latency transactions, horizontal scaling as the network grows, and ongoing innovation that could support long-term value through sustained usage.
The SUI token is the native token used for fees, staking, and governance.
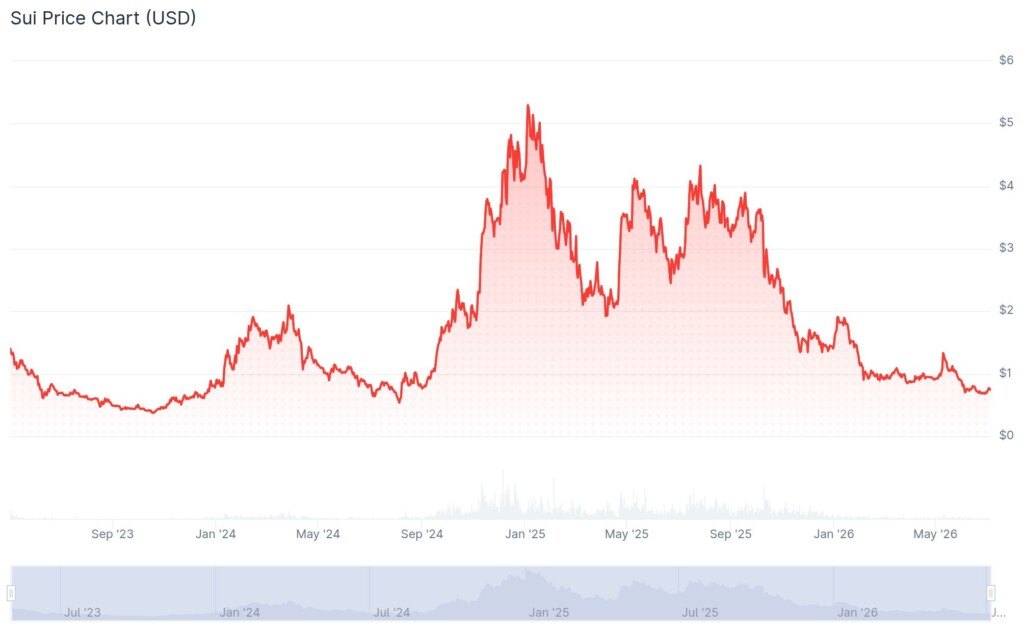
SUI initially traded at $2.10, well above the $0.10 investors paid during its public sale at the end of April.
A bear run preceded the listing, and on October 23, 2023, it fell to its lowest price, $0.3643.
It started recovering in November 2023.
It reached its highest price on March 27, 2024, at $2.18, following the Greek stock exchange’s announcement of a possible collaboration.
On May 21, 2024, the SUI network surpassed 1 million daily active wallets. In August, it traded at $0.57.
It later rose, breaking above $1.5 in September and $2 in October.
The bull market run continued into November, reaching a new all-time high of $5.35 on January 6, 2025. Later, it quickly reversed, falling below $3.50 in February and $2.00 in April.
It began recovering in May, rising above $3.50. In July, it fell below $3.0, and, like Solana and Ethereum Layer 2 networks, broader adoption still depends on ecosystem depth, since those rivals already benefit from deep liquidity.
It rose to $3.60 by October, then entered a bear run. Decentralized exchanges, lending platforms, and liquid staking can strengthen ecosystem liquidity, while ecosystem partners can support token distribution and liquidity management.
By November, it had dropped to $2, and in December to $1.6.
In January 2026, it recovered to $1.9, but erased those gains in February, falling below $1. It reached $0.90 in April. In June, it dropped to $0.70 and maintained that level into July.
China imported 41.3% less crude oil in June this year compared to the same month a year earlier, with this posing as the country’s fuel import weakest month since October 2016. Electric taxis have helped to absorb a huge slice of the shortfall since the Strait of Hormuz crisis began.
China’s import figures and petrol demand
The figures released by the country’s Customs on July 14 put June imports at 29.27 million tonnes. This comes five months into a conflict that began in late February and has kept the Strait of Hormuz, which carries nearly half of China’s seaborne crude, under enormous threat. Hormuz sees between 45% and 50% of Chinese crude normally, according to Columbia’s Center on Global Energy Policy.
This, understandably, has led to an increased leaning on electric taxis. J.P. Morgan expects Chinese petrol demand to drop 150,000 barrels a day this year and another 50,000 in 2027. The bank’s analyst Natasha Kaneva explained the shift from petrol in a July 2 note, stating “The conflict may have accelerated behavioral changes that were already underway, leaving China structurally less dependent on oil than the market has historically assumed.”
Electric taxi switch happening in real time
The Ministry of Transport estimates that about half of the country’s 1.3 million taxis now run on batteries, a figure that is moving towards a complete 100% in the largest cities.
Cab hailing service Didi added 2 million hybrid and electric vehicles last year, lifting its fleet of cars not using petrol to 8 million. Battery-powered cars now handle 75% of the total mileage booked through the Didi app, according to figures cited by TNW.
The fuel data also gives credence to these noticeable changes. China consumed 10% less petrol and 14% less diesel in May than in the same month a year earlier, even as road freight increased by 2% and holiday travel during the May Day period set a record. Over the same window, riders took 3.05 billion taxi and ride-hailing trips, a 6% increase on the prior year.
There were no policy changes guiding this switch to electric taxis. In fact, the electrification push had already started before the crisis began due to commercial reasons. The crisis, however, added economic changes that favored battery-powered cars. Petrol prices rose while a rush of new drivers and cheap electric cars pushed fares down 10% to 15% over six months, according to TNW. Owners of petrol cars are leaving them parked and booking rides instead.
“Overall travel demand is still increasing, so more trips are shifting to public transport, such as taxis and the subway,” said Daizong Liu, East Asia director at the Institute for Transportation and Development Policy.
China’s pressure on oil demand
June’s import came mostly due to supply. Refiners saw crude distillation units at 57.72% utilization, which ran close to a 10-year low. China’s reduced buying helped to cap crude prices after Brent went above $79 on Monday due to the U.S. Iran ceasefire breaking.
Analysts expect the structural pressure on oil demand to last. Dai Jiaquan, chief economist at the CNPC Economics and Technology Research Institute, stated at a Hong Kong event that Chinese crude demand will peak within five years.
He said that China’s more immediate headache was refining the current overcapacity of 900 million to 1 billion tonnes against reducing demand of 750 million to 800 million.
Greenpeace has also predicted that 90% of taxi and ride-hailing mileage will be electric by 2035.
Don’t just read crypto news. Understand it. Subscribe to our newsletter. It’s free.
Ethereum Research Thread Puts Sybil Resistance Back In Focus For Decentralized Networks is a useful reminder that crypto coverage is not only about token prices. Sometimes the more important story is the infrastructure, regulation, security, or product layer sitting underneath the market noise.
The immediate point is straightforward: an Ethereum Research post examines Sybil risks in the AUCIL framework. That gives readers something concrete to work with, rather than another vague sentiment update.
TL;DR
An Ethereum Research post examines Sybil risks in the AUCIL framework.
The discussion focuses on how duplicate identities can distort decentralized systems.
It adds to the broader security debate around validator and node-level trust.
Why This Matters Now
The timing matters because Ethereum is already part of a wider conversation across the market. Traders want to know whether the development changes liquidity or risk. Builders want to know whether it changes what can be deployed. Compliance teams want to know whether it changes how platforms operate.
In that sense, the story is bigger than one headline. It sits inside the ongoing shift from speculative crypto cycles toward more practical questions: who can use these systems, how safe are they, and whether the underlying incentives actually work.
The best way to read it is with discipline. It is not a guarantee of immediate upside, and it should not be treated as one. But it does add a fresh data point to the way the market is thinking about Ethereum.
The Ethereum Angle
For Ethereum, the important part is the specific mechanism. If this is a security issue, the risk sits in dependencies and user protection. If it is a listing or product launch, the question is access and liquidity. If it is a governance or research proposal, the question is whether the idea can survive implementation.
That is where this update becomes useful. It is not just a label attached to a trend. It gives readers a way to understand what might actually change if the development gains traction.
Crypto has a habit of turning every announcement into a broad market claim. This one deserves a narrower read. The value is in seeing how it affects the users, developers, institutions, or traders closest to the issue.
The Risk Side
There is also a caution attached. Source material can confirm that a development exists, but it cannot prove that adoption will follow. A proposal still needs support. A product still needs users. A chart still needs confirmation. A compliance tool still needs integration.
That is why the responsible reading is not to oversell the story. The stronger takeaway is that this adds to a pattern. The crypto market is steadily becoming more professional, more technical, and more sensitive to real operational details.
Readers should also watch for follow-up signals. That could mean developer feedback, exchange support, regulatory response, wallet adoption, liquidity data, or simply whether market participants continue reacting after the first headline fades.
What Comes Next
The next stage will decide whether this remains a narrow update or becomes part of a larger market theme. In crypto, that difference matters. Plenty of stories look important for a few hours and then disappear. The ones that last usually show up again through usage, liquidity, enforcement, governance, or developer adoption.
For now, this gives the market another piece of information to weigh. It is specific enough to be useful, but still early enough that readers should keep the caveats in view.
That makes it worth covering without pretending it settles anything. The story is a signal, not a final verdict.
The key is not to confuse coverage with certainty. Ethereum stories can move quickly, especially when they touch security, regulation, listings, infrastructure, or price levels. The useful approach is to track the next confirming detail rather than assume the first update carries the whole market story. That is how traders avoid chasing noise and how readers separate a genuine development from another passing headline.
This report is based on information from ethresear.ch.
This article was written by the News Desk and edited by Samuel Rae.
President Donald Trump reversed course on a proposed 20% shipping fee for vessels passing through the Strait of Hormuz on Tuesday, less than a day after announcing it, saying Gulf nations had offered large investment deals in its place.
Trump made the announcement on Truth Social, saying he would swap the transit fee for trade and investment agreements with Gulf states.
“Based on highly productive conversations with Middle East leadership, I have decided to replace the 20% United States Reimbursement Fee with Trade and Investment Deals that the various Gulf States will be making into the United States,” he wrote, adding the investments would be “massive” and good for both sides.
Later, Trump told reporters that several foreign leaders had called him and asked him to take a different approach. He said kings and emirs wanted to invest billions of dollars in the United States instead.
However, he did not name any countries, announce any signed deals, or provide a timeline. He only said the investments would be “massive” and beneficial for both sides.
As of Tuesday, Gulf governments had not publicly responded.
Industry and legal experts push back
Strong outcry from the maritime industry, international organizations, and legal experts who claimed the proposal was illegal led to the decision being overturned.
The tax would have increased the cost of a single cargo by tens of millions of dollars if it had been put into place. A fully loaded natural gas carrier would have paid about $17 million, according to Lloyd’s List estimates.
Analysts also estimated the fee would have added around $16 to the price of every barrel of oil at $80 per barrel, while a very large oil tanker carrying 2 million barrels would have faced a $24 million charge per trip if oil was priced at $60 per barrel.
Petras Katinas, a research fellow in climate, energy, and defense at RUSI Europe, warned that the fee could set a dangerous precedent.
He said if one country starts charging such tolls, other countries may follow and introduce similar fees on their own trade routes. “So, we are totally undermining international maritime law, which is already in a fragile situation.”
Regardless of whether the fee was $200 or $20 million, Lloyd’s List editor Richard Meade was as blunt, stating that “there is no legal basis for charging vessels to exercise their right of transit passage through an international strait.” Whether these demands originated in Washington or Tehran, he continued, was “largely beside the point.”
The United Nations’ International Maritime Organization added its voice, saying it was “firmly against charging fees for passage through straits used for international navigation” and that “there is no legal basis through which to introduce mandatory tolls simply to transit through a strait.”
Opposition from within the administration
Even members of Trump’s own administration had previously opposed the concept.
Secretary of State Marco Rubio said last month that charging fees on international waterways was already illegal under existing law.
As recently as June 25, at a Gulf Cooperation Council meeting in Bahrain, Rubio had warned that Iranian tolls in the strait would trigger “total chaos” and spread “like a contagion.”
The fee was scheduled to go into force at 2000 GMT. Less than five hours prior to that deadline, Trump made it clear that the strait was still open to all commerce, with the exception of ships connected to Iran, which would stay under blockade.
“I like that actually because I don’t think anybody should be able to charge a fee for the strait,” Trump said, though he maintained that the U.S. deserved some benefit for keeping the waterway secure.
Whether the promised Gulf investments will take any concrete form, or simply serve as cover for a quick retreat from a plan widely seen as unworkable, remains unclear.
Overall, the promised Gulf investments currently appear to be a weak and uncertain substitute for the canceled shipping tax, given the lack of specifics and the strong legal and industry opposition that forced the rapid reversal.