
Ethereum Price Analysis: $2K Dream Remains on the Table as ETH Defends Key Levels
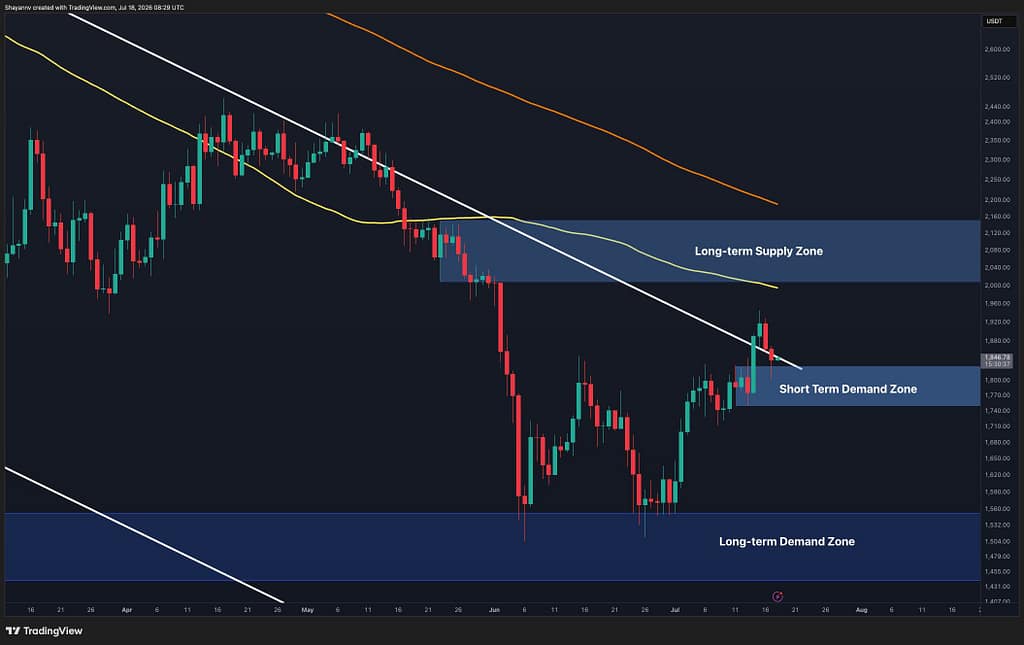
Ethereum is approaching a critical technical threshold near $2,000 that will determine whether the asset can sustain its recovery or face renewed selling pressure from institutional supply. The alignment of derivative liquidation clusters, moving average resistance, and a descending trendline at this level makes it the primary decision point for institutional traders positioning ahead of the next directional move.
- ETH has recovered from June lows but remains trapped below the 100-day and 200-day moving averages, confirming bearish structure despite recent rebound strength.
- The $1.75K, $1.85K support zone has repeatedly attracted buyers and now represents the first line of defense for the ongoing recovery attempt.
- A major liquidity cluster of short liquidations sits between $1.95K, $2K, aligned with descending trendline resistance and the $2K, $2.15K supply zone above it.
- $2,000 Primary resistance target where technical confluence and liquidity cluster converge
- $1.75K, $1.85K Critical support zone holding the sequence of higher lows since early July
- $1.45K, $1.55K Secondary demand zone that would be exposed if immediate support breaks decisively
Ethereum’s price action over the past month has created a textbook technical setup that institutional traders are now parsing for directional clues. The asset has recovered substantially from its June lows, yet it continues to face overhead resistance from longer-term moving averages and a descending trendline that has defined the broader downtrend since November highs.
This dynamic has trapped ETH in a compressed range where the next breakout, in either direction, could accelerate positioning flows among leveraged traders and trigger liquidation cascades.
The recent failure to hold above $1.9K represents the most recent test of this structure. ETH pulled back into the $1.75K, $1.85K demand zone, a region that has functioned as reliable support throughout the current recovery and now serves as the immediate litmus test for whether buyers retain enough conviction to push higher.
Breaking below this zone would expose the $1.7K support level and potentially force a retracement toward the longer-term demand cluster around $1.45K, $1.55K, a move of roughly 15 percent from current levels.
Descending moving averages still define the bear case despite recovery gains
The daily timeframe tells a cautionary story for bulls despite the recovery from June lows. Ethereum continues to trade below both the 100-day and 200-day moving averages, a technical condition that typically signals an intact downtrend and a lack of structural improvement in the broader market regime.
These moving averages have historically acted as a gravitational ceiling during bear markets, and their continued downward slope confirms that the path of least resistance remains lower, even as short-term price action bounces.
The 100-day moving average in particular aligns closely with the descending trendline that has characterized the entire sell-off from November’s highs. This convergence creates a barrier that extends into the $2K, $2.15K zone, making the region not just a single level to watch but a confluence of multiple technical tools that institutional traders monitor when sizing positions.
If ETH can break above and hold above this area, it would represent the first structural improvement in months, potentially signaling a shift from bear to accumulation phase. Until that occurs, the broader trend remains decidedly bearish.
The 4-hour chart provides a more granular view of the immediate buying and selling pressure.
Ethereum’s pullback after failing near $1.95K on the 4-hour timeframe has pushed it back to the $1.76K, $1.84K short-term demand zone. This area has demonstrated repeated buying interest over the past week, and it now represents the sequence of higher lows that traders have established since early July.
Preservation of this support level is essential for maintaining any near-term bullish narrative. However, the 4-hour chart also suggests that even a successful hold here may only lead to a re-test of the $1.95K, $2K region, not an immediate breakout into decisively higher territory.
Short liquidation cluster at $1.95K, $2K creates squeeze risk for bearish positioning
One of the most actionable signals in the current setup lies in the derivative market structure, where short liquidation concentration is heavily weighted above current price levels. The liquidation heatmap reveals a significant cluster of short positions positioned between $1.95K and $2K, precisely where technical resistance from the descending trendline and moving averages converge.
This alignment suggests that large leveraged traders have sized bets on a continued decline, creating a mechanical trigger for upside liquidations if price pushes higher.
The positioning creates a two-stage scenario that institutional traders are now gaming. In the first stage, a push toward $1.95K, $2K could spark an upside liquidity grab that sweeps short stops and forces covering, which would further accelerate the move upward through pure mechanical selling of shorts.
In the second stage, if price actually breaks through the $2K, $2.15K supply zone above the liquidity cluster, the invalidation of the bear case could trigger a more sustained institutional rotation into long positions.
Conversely, if Ethereum fails to break above the liquidity cluster and gets rejected back downward, the very short positions that were nearly liquidated would be validated, and the market could shift back to bearish narrative momentum.
This dual-outcome dynamic is what makes the $2K threshold so critical to institutional positioning. It is not simply a round number or a psychological barrier; it represents the literal intersection of technical resistance, moving average pressure, trendline confluence, and derivative market positioning.
The concentration of all these factors at one price level creates an unusually high probability that significant directional clarity will emerge once ETH either breaks through or bounces off this zone.
Holding $1.75K, $1.85K is prerequisite for any move toward the $2K target
For the $2K scenario to even reach the market, Ethereum must first hold its ground in the $1.75K, $1.85K support zone. This is not academic; it is the practical entry condition for the entire upside liquidity grab thesis.
A failure to hold above this area would immediately shift the narrative and expose support at $1.7K, followed by the more substantial demand zone around $1.45K, $1.55K. That would represent a roughly 15-20 percent drawdown from current levels and would likely reset near-term bullish positioning among traders who have been accumulating during the recovery.
The stakes for this support level are therefore outsized relative to its appearance on the chart.
Institutional traders monitoring Ethereum for positioning opportunities are likely using the $1.75K, $1.85K zone as their first filter for conviction. A clean hold followed by a rally attempt toward $2K would signal that structural buyers are active. A break below this zone, conversely, would indicate that the recovery rally has exhausted and that another leg lower is likely.
Over the next 5-10 trading days, this support level will functionally determine whether the institutional narrative shifts to cautious optimism or back to capitulation-phase expectations.
The immediate catalysts to watch are whether ETH can hold above $1.75K on the first test of this support, and whether a hold leads to a re-test of the $1.95K, $2K liquidity cluster. The second critical question is whether a push toward $2K results in a liquidation-driven squeeze above $2K, $2.15K resistance or instead a reversal that traps latecomers into the bounce. Institutional traders are currently positioned to exploit whichever scenario plays out, but the next 1-2 weeks will determine which outcome dominates market structure and positioning flows.