A closely watched chart pattern has flipped bullish, and at least one analyst says it mirrors the setup that preceded some of the biggest altcoin rallies on record.
According to trader Mark Chadwick, the pattern has historically occurred just before rallies of between 2,000% and 10,000%.
Altcoins Flash Their Strongest Setup in Years, Analysts Say
Chadwick posted on X on May 13 that the altcoin market is showing “one of the cleanest setups we’ve seen since 2020.” In his view, alts have spent months consolidating along a long-term ascending support line, absorbing selling pressure without breaking down, and now momentum is starting to flip.
“That’s historically how Alt Season starts,” he wrote.
He pointed to the 2020-2021 cycle as the clearest comparison, saying that when similar signals appeared then, they pushed many major alts up by “2,000-10,000% within months.”
He also cited the Russell 2000 hitting all-time highs as corroborating evidence that broader risk appetite is returning, arguing that capital rotation out of safer assets and into higher-beta plays is already starting.
That view is quite similar to that shared by another analyst, Michaël van de Poppe, who said earlier in the week that altcoins are currently trailing Bitcoin by one to three weeks and that if the pattern continues, they could start posting gains between 100% and 300%, depending on liquidity conditions and market momentum.
Some on-chain data also offered backing for Chadwick’s thesis, with crypto analyst Darkfost noting that altcoin performance among tokens listed on Binance has returned to levels not seen since September 2025.
Per his data, about 21% of Binance-listed altcoins have now reclaimed their 200-day moving averages. In February, only 2% of those assets held above that level. However, he was careful not to overstate the trend.
“It is far too early to start calling an altseason; the road ahead is still long and liquidity remains constrained,” he pointed out.
Liquidity and Regulation Remain Central Concerns for Traders
Despite the improving charts, some market watchers are still pointing to weak liquidity as a major obstacle for a bigger rally.
Darkfost himself noted that the crypto market has become heavily diluted, with at least 51 million altcoins now in circulation, with 46% of those tokens on Solana, while 36% are on Base and 10% are on BNB Smart Chain.
Macroeconomic concerns are also still weighing on sentiment. Darkfost cited the ongoing US-Iran conflict and inflation worries as factors that are still putting pressure on risk assets.
At the same time, traders are closely watching developments in Washington, with Chadwick, in an earlier post, suggesting that the Digital Asset Market Clarity Act of 2025 could encourage more institutional participation in crypto markets if it paves the way for clearer market structure rules.
The bill is scheduled for markup tomorrow, but has been hit with multiple amendments as well as more than 8,000 letters from members of the American Bankers Association opposing its stablecoin yield provisions.
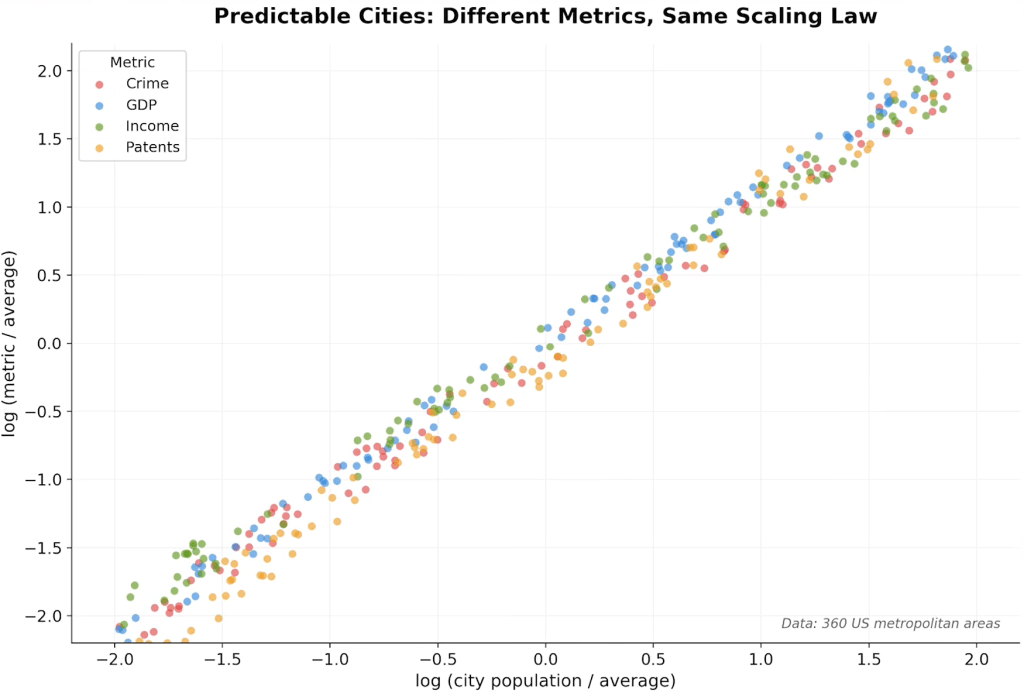
Physicist Giovanni Santostasi says Bitcoin’s long-term price trajectory is not best understood as an S-curve, speculative bubble, or simple exponential trend, but as a power law similar to patterns found in cities, biology and other natural systems. Speaking with Nathalie Brunell on the May 12 episode of the Coin Stories podcast, the director of the Scientific Bitcoin Institute argued that Bitcoin’s historical data points to roughly $1 million per coin in about eight years and $10 million in roughly 20 years.
Santostasi explained his Bitcoin Power Law thesis in detail. His core claim is that Bitcoin’s price has followed a nonlinear mathematical relationship with time since the network’s early trading history. In his formulation, Bitcoin’s price is proportional to time raised to a power of roughly 5.8 to 5.9, often rounded to six. That exponent, he said, is not just a curve-fitting artifact but a “fingerprint” of the system.
“With bitcoin we found a similar relationship where the price is proportional to the time,” Santostasi said. “So the age of bitcoin, how many years, you can measure it in days, you can measure it in years. And then you take the power and that power is 5.8.”
Bitcoin Is Growing Like A City
He acknowledged that Bitcoin remains volatile in the short term, with wars, crises and liquidity shocks producing large deviations. But he argued those moves are oscillations around a deeper trajectory.
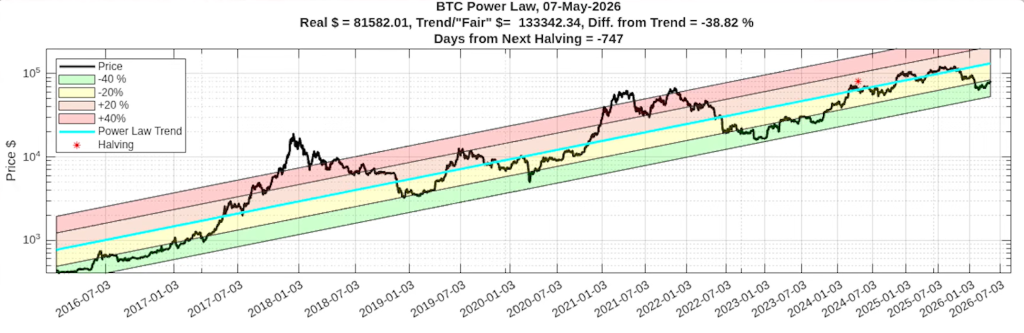
According to Santostasi, Bitcoin’s power law currently implies a central price level around $120,000, while the market has recently traded below that level. He said the lower statistical band, which he described as a kind of floor, is currently near $56,000 to $57,000. He also cited a correlation coefficient of 0.97 for the power law fit, arguing that only around 3% of Bitcoin’s long-term price variation is not described by the model.
A key part of Santostasi’s thesis is that Bitcoin behaves more like a networked organism than a corporate asset. He compared Bitcoin to cities, which he said grow through bottom-up interaction and tend to endure far longer than corporations. Cities, in his telling, follow power laws because their value emerges from networks of people freely interacting, building and exchanging information.
“Bitcoin is like a city,” Santostasi said. “Bitcoin is like tooth and nails and thorns and shells, these natural forms. To me, if you can simplify this message — and because it’s not poetry, it’s science actually, it’s based on data — it is one of the most convincing orange-pilling arguments that you can make.”
The physicist contrasted that with exponential growth, which he associated with systems that expand quickly but eventually hit resource limits. He cited corporations as an example, saying most die within 150 years, while cities such as Rome can persist for millennia. That distinction led to one of the more provocative implications of the discussion: corporations backed by Bitcoin, Santostasi suggested, could theoretically become more city-like in their durability.
“This is one of the reasons why I want Saylor to start adopting this language of a power law,” he said, referring to Strategy executive chairman Michael Saylor. “He could say exactly that. We are turning corporations into cities.”
Santostasi also argued that Bitcoin’s address growth supports the thesis. He said Bitcoin addresses have grown as a power law with time cubed, while price reacts to address growth roughly according to a square relationship, similar to Metcalfe’s Law. Combining those two relationships, he said, produces the observed price relationship of time to the sixth power.
“If you double the number of addresses, the price goes up to four,” Santostasi said. “If you triple it, it goes to nine. So it’s a power law with the square.”
That framework also leads Santostasi to reject the common view that Bitcoin adoption should be modeled primarily as an S-curve, like refrigerators, televisions or other consumer technologies. Those products, he argued, are not networks in the same way Bitcoin is. Bitcoin’s social, monetary and technical layers make it closer to the internet or a city than to a household appliance.
Still, Santostasi stopped short of presenting the forecast as certainty. Asked how confident he is that Bitcoin will reach roughly $1 million per coin in about eight years and $10 million in roughly 20 years, he put the probability near 90%, while leaving room for failure conditions. He said continued capital inflows, larger institutional participation and new pools of capital are necessary for the path to remain intact.
Bitcoin’s DeFi Moment Has Arrived, and OP_NET Is Leading the Charge
Bitcoin DeFi · Consensus 2026 · Industry Analysis
Bitcoin’s DeFi Moment Has Arrived, and OP_NET Is Leading the Charge
By CCS EditorialConsensus 2026, Miami6 min read
The Solution
Smart Contracts on Layer 1, Without Touching Bitcoin’s Code
OP_NET is a smart contract protocol built for Bitcoin’s base layer. It doesn’t require a fork, doesn’t alter Bitcoin’s consensus rules, and is fully backwards-compatible with the protocol dating back to 2012. What it does is fundamentally expand what you can do with BTC on-chain.
Think of it as a programmability layer that plugs into Bitcoin rather than replacing it. Developers can deploy contracts, issue fully programmable assets, and build applications ranging from DeFi exchanges and lending protocols to identity systems and private messaging, all settling natively on Bitcoin layer 1.
“On the most decentralized blockchain in existence, the only way to do anything with your Bitcoin is through a middleman. That’s the gap we’re here to close.”
Samuel Pat, OP_NET — Consensus 2026
The protocol is fully open source and permissionless. No approval process, no partnership required. OP_NET has also built an AI developer infrastructure, a suite of MCP packages that integrate with tools like Claude, which means developers can now build functional Bitcoin applications without being deeply fluent in Bitcoin’s notoriously complex internals.
Smart contract execution on Bitcoin layer 1, no fork required
Fully programmable, issuable assets on-chain
Open-source protocol, permissionless development
AI-assisted developer tooling via MCP packages
Backwards-compatible to Bitcoin as it existed in 2012
The Thesis
Slow Is a Feature, Not a Flaw: The Case for “SlowFi”
One of the most counterintuitive arguments in OP_NET’s playbook is that Bitcoin’s speed limitations aren’t a problem to engineer around. They’re a structural advantage for DeFi.
On high-throughput chains where transactions are nearly free, liquidity providers tend to engage in constant, reflexive behavior: claim rewards, sell, repeat. The result is a short-lived pump-and-dump cycle that undermines the long-term health of protocols. When transactions have a real cost, participants make deliberate decisions rather than reflexive ones.
OP_NET Concept
SlowFi: Why Friction Makes DeFi More Resilient
OP_NET has coined the term “SlowFi” to describe their thesis that DeFi performs better in slower, costlier environments. When claiming staking rewards costs more than trivial amounts, yield farmers hold positions longer and make more considered exits, reducing the wash-cycle behavior that drains value from fast-chain DeFi ecosystems. The analogy extends to real-world collectibles markets, real estate, and traditional equities, all of which derive stability from the friction inherent in their trading mechanisms.
Bitcoin’s 10-minute block time and relatively modest throughput of around 4,000 to 5,000 transactions per block positions it as an ideal venue for high-value, lower-frequency financial activity: lending against collateral, large asset swaps, real estate settlement, tokenized equity trading.
This is not an asset class demanding millisecond settlement. It’s one demanding security above all else.
The Ecosystem
What’s Live Today, and What’s Coming Within the Year
OP_NET has moved beyond whitepaper and into working infrastructure. MotoSwap, their decentralized exchange, is live and allows BTC holders to swap assets and stake for yield. A DeFi analytics dashboard at Deflo.com tracks yields across the ecosystem, which are currently high given the early-adopter stage of the market.
The current user journey involves downloading OP_NET’s Bitcoin wallet, which adds smart contract transaction support while remaining a standard Bitcoin wallet at its core. Existing seed phrases and private keys import cleanly, and the wallet supports any assets issued on the protocol.
Live Now
MotoSwap DEX
Decentralized exchange with asset swaps and liquidity farming on Bitcoin layer 1.
Live Now
Deflo Analytics
DeFi yield tracking and portfolio management tooling built by the community.
6–12 Months
Decentralized Lending
Aave-style lending on BTC, the milestone expected to unlock institutional interest.
Longer Horizon
Tokenized RWAs
Real estate, equities, and verified identity protocols trading against BTC on-chain.
Longer-term, the OP_NET vision extends to real-world asset tokenization including housing, equities, and verifiable credential systems, all settling in BTC on a single, trusted chain. The argument is simple: if you have to onboard a new user to crypto anyway, it’s far easier to sell them on Bitcoin than to explain why a specific RWA chain is the right home for their assets.
The Bigger Picture
Why This Matters for Bitcoin’s Long-Term Security Model
There’s an existential question embedded in Bitcoin’s design that few casual observers appreciate. Miner revenue is currently dominated by block subsidies, newly issued BTC. But every four years, that subsidy halves. The long-term model from Satoshi’s original white paper assumed transaction fees would eventually replace subsidies as miners’ primary income source.
That assumption requires one thing: people actually using the Bitcoin network. A Bitcoin that functions purely as digital gold, bought, stored cold, and never moved, eventually starves its own security model. Full blocks, driven by genuine economic activity, are not just good for OP_NET. They are structurally necessary for Bitcoin to remain the most secure blockchain in existence decades from now.
In that light, protocols like OP_NET aren’t peripheral to Bitcoin’s future. They may be central to it.
Video Interview
Samuel Pat, OP_NET — Speaking at Consensus 2026, Miami
Excerpted and condensed from the CCS interview. Watch the full conversation below.
Q: Why does Bitcoin need a DeFi layer at all?
Bitcoin has the most liquidity and users out of any blockchain and there’s nothing more secure. But the native Bitcoin blockchain can’t tap into that potential on its own. The only way to do anything with your Bitcoin today is fully centralized, going through a custodian, a bridge, or a centralized exchange. The average user has no way to earn yield on their Bitcoin in a decentralized way. That’s the gap.
Q: How does OP_NET actually work without changing Bitcoin?
It’s backwards compatible all the way to 2012. We’re not touching Bitcoin’s code, we’re plugging into it. We use existing Bitcoin functionality to put data on-chain in a way that allows smart contracts to execute. Multiple Bitcoin upgrades over the years have made this more efficient, but the core capability was always there. It just needed a protocol to unlock it.
Q: You talk about “SlowFi” — can you explain that thesis?
If it costs me more to claim my staking rewards than the reward itself is worth at that moment, I’m going to leave my position open longer. That’s healthy behavior for a DeFi ecosystem. On cheap, fast chains, you see constant claim-and-sell cycles that kill protocols quickly. Friction is what keeps collectibles markets, real estate markets, and traditional finance stable. We think Bitcoin’s “slowness” is actually the ideal environment for DeFi to mature properly.
Q: What’s the near-term vision?
Increasing integration, more wallets, more exchanges supporting our asset standard, better bridging infrastructure. And on the application side, we really want to get to decentralized lending on Bitcoin in an Aave-style model. That’s the unlock for institutional capital and for the broader Bitcoiner community, because it doesn’t require active management. You deposit, you earn. That’s a one-year vision for us.
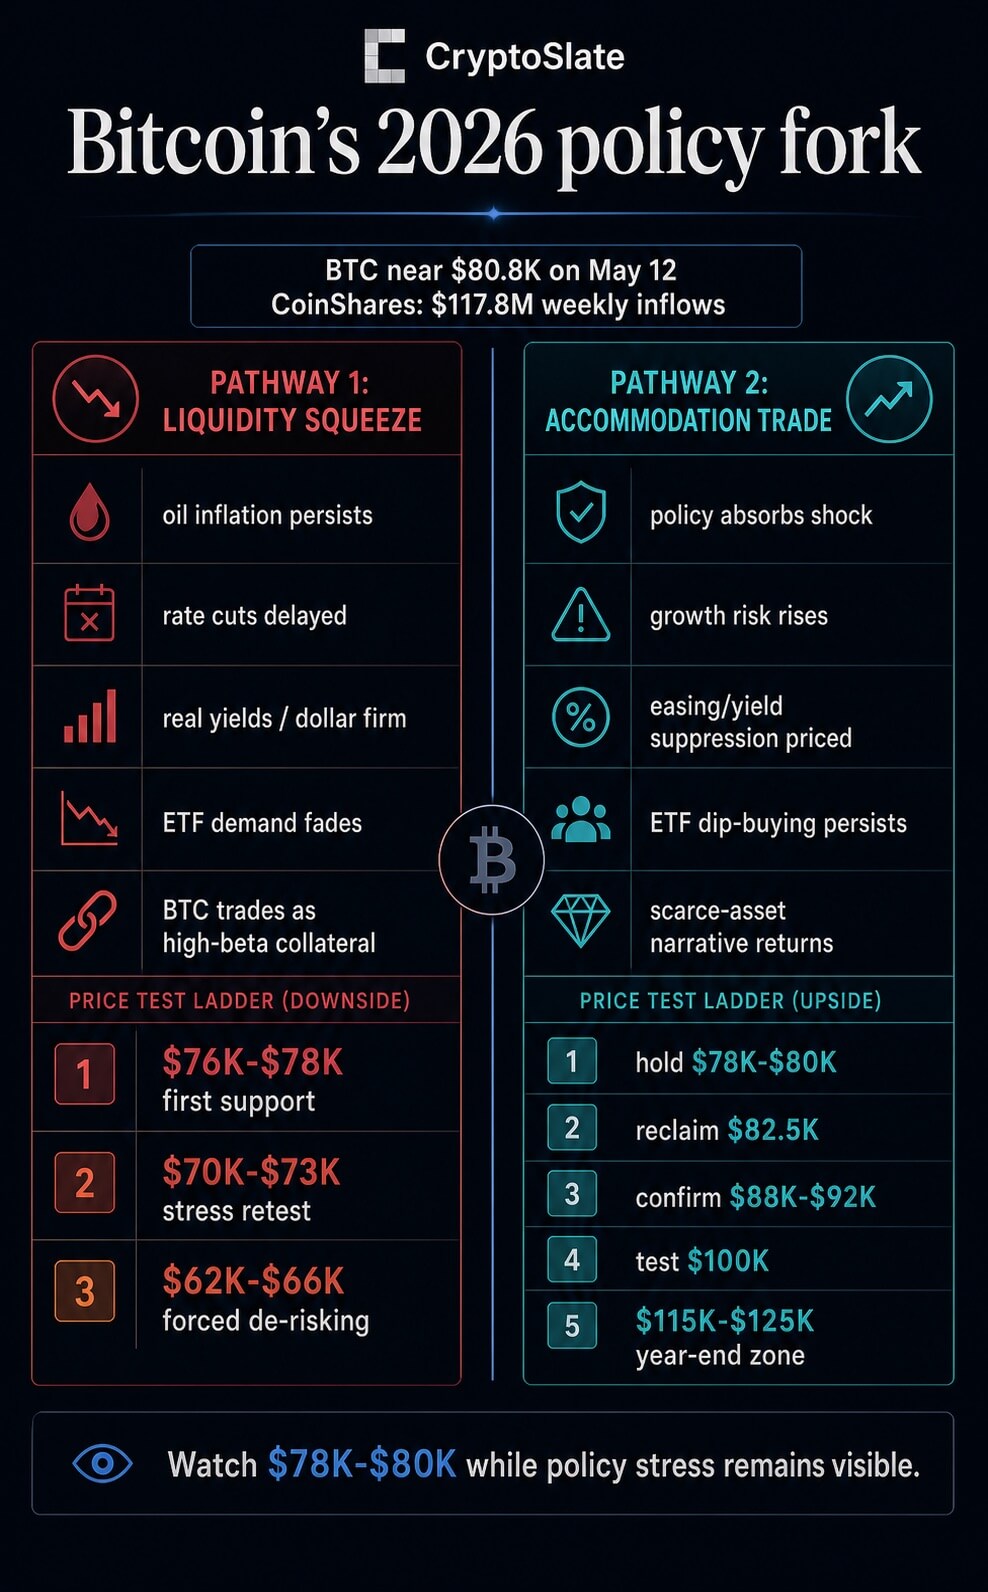
Bitcoin’s path through 2026 now runs through global economic policy.
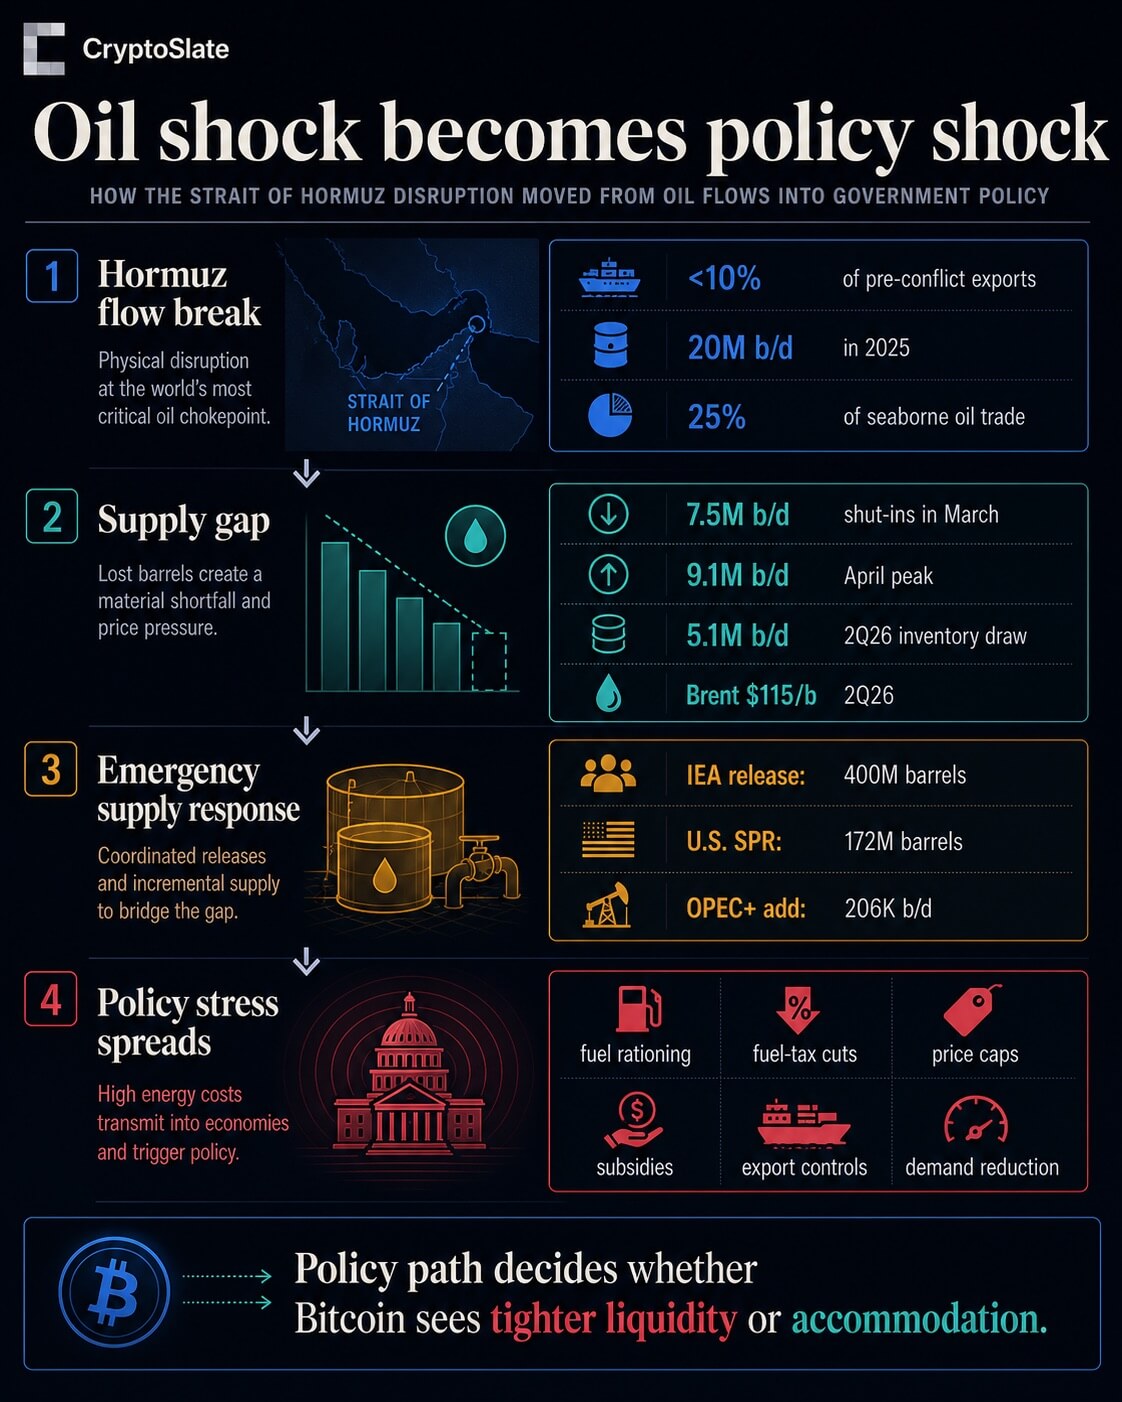
The disruption around the Strait of Hormuz has moved beyond a commodity-price event and into the machinery of governments.
The International Energy Agency said crude and refined-product exports through the strait had fallen to less than 10% of pre-conflict levels after about 20 million barrels per day moved through the route in 2025, equal to roughly a quarter of global seaborne oil trade.
That is the scale of shock that stops being only a Brent chart.
The U.S. Energy Information Administration now expects Middle East production shut-ins to average 7.5 million b/d in March, peak at 9.1 million b/d in April, and drive a 5.1 million b/d global inventory draw in the second quarter. It also sees Brent averaging $115 a barrel in 2Q26 before easing later in the year.
For Bitcoin, the issue is whether markets treat the oil shock as a force that keeps inflation sticky and financial conditions tight, or as a shock severe enough to pull governments and central banks toward more support.
That fork leaves Bitcoin with two defensible pathways into year-end: a stagflation-driven liquidity squeeze that pushes it back into high-beta collateral behavior, or a policy-accommodation trade that lets it reclaim its scarce-asset narrative.
The policy response is already visible. IEA members agreed to release 400 million barrels from emergency stocks, the largest coordinated release in the agency’s history.
The U.S. Department of Energy said the White House authorized 172 million barrels from the Strategic Petroleum Reserve, with delivery expected to take about 120 days at planned discharge rates.
Supply additions elsewhere do not change the scale problem. Eight OPEC+ members agreed to add 206 thousand b/d in April, a move that may matter at the margin but sits far below the disruption estimates now embedded in EIA’s outlook.
The more important signal is the spread of emergency policy.
Sri Lanka has introduced QR-based fuel rationing, Korea has odd-even driving restrictions and fuel-price measures, India has LPG and fuel controls, Pakistan has remote-work and public-transport steps, Japan has a subsidy-backed fuel-price cap, Germany has fuel-tax and pricing rules, China has refined-oil price controls, and the UK has heating-oil and industrial support.
The IEA’s separate demand-side report lays out options such as remote work, lower speed limits, public transport, car-access limits, LPG prioritization, and reduced air travel.
Those measures matter for Bitcoin because they shift the oil story from a market-clearing problem to a policy reaction function.
Once governments are cutting taxes, capping prices, rationing fuel, releasing reserves, or subsidizing exposed sectors, the macro signal becomes less clean.
Bitcoin is close enough to the key zone that this macro classification matters immediately. CryptoSlate’s market page showed Bitcoin around $80,794 on May 12, with the broader crypto market near $2.69 trillion and BTC dominance around 60%.
Further, ETF inflows, geopolitical risk, U.S. macro data, Fed signals, and oil stress continue to shape sentiment.
Flows still give the upside case something to work with, but they are not an all-clear signal.
The latest fund-flow report showed $117 million of digital-asset product inflows, a fifth consecutive positive week. Bitcoin products attracted $192 million, while Ethereum products saw $81.6 million of outflows.
The same report noted that four days of outflows were reversed by one strong Friday session, so the flow picture looks resilient but fragile.
That is why the $78,000 to $80,000 area is more than a trading level in this setup. Recent CryptoSlate coverage has tied that band to Bitcoin’s struggle around the Fed, oil-driven inflation pressure, and on-chain supply levels.
If Bitcoin holds it while energy-policy stress stays visible, markets can argue that ETF demand and scarcity narratives are absorbing the macro shock. If it loses the area, the oil shock starts to look less like a debasement trade and more like a real-yield problem.
Two paths now define Bitcoin’s 2026 map
The downside pathway starts with EIA’s oil forecast becoming the macro base case rather than a temporary stress scenario.
Brent at a 2Q26 average of $115, a 5.1 million b/d inventory draw, and multi-million-barrel-per-day shut-ins would keep energy in the inflation conversation even if reserve releases ease the first hit.
Governments can soften the pain with subsidies, tax relief, price caps, direct sector aid, and fuel rules. Those measures can also preserve demand, add fiscal cost, and make it harder for central banks to treat the shock as a clean one-off.
In that version of the year, rate cuts are delayed, real yields stay firm, the dollar remains hard to fight, and Bitcoin trades less like digital scarcity and more like collateral in a risk book.
ETF demand is the transmission channel to watch. CoinShares’ Bitcoin inflow number shows that the bid has not disappeared, but the midweek outflows show how quickly macro caution can drain participation.
If energy inflation keeps Fed expectations tight and ETF flows fade or reverse, Bitcoin does not need a crypto-specific failure to move lower. It only needs the macro backdrop to force de-risking.
Under that pathway, failure to hold $78,000 to $80,000 would make $76,000 to $78,000 the first risk-control zone.
A deeper macro-stress retest would put $70,000 to $73,000 in view. If forced selling and ETF redemptions intensify, the $62,000 to $66,000 area becomes the wider stress band.
These are not stand-alone technical targets; they are the price expression of a market deciding that oil policy is tightening liquidity rather than creating it.
The upside pathway classifies the policy response differently.
In this version, governments absorb enough of the energy shock that growth risk starts to matter more than near-term inflation. Reserve releases, price caps, targeted aid, fuel-tax relief, and demand-reduction measures become a bridge between the shock and eventual policy accommodation.
Markets do not need central banks to ease immediately for that trade to begin. They need real yields to soften, the dollar to stop acting as a wrecking ball, and investors to believe the policy system is moving from inflation restraint toward growth protection.
That is when Bitcoin’s scarce-asset story can return, especially if ETF demand keeps appearing on dips.
The latest CoinShares report does not prove that this path has won, but it keeps it alive. Bitcoin attracted more inflows than the total digital-asset product universe because Ethereum outflows and thinner participation offset BTC demand elsewhere.
That divergence matters. It suggests investors are still willing to isolate Bitcoin as the macro vehicle even when broader crypto participation is uneven.
The confirmation ladder is clear. Bitcoin first has to keep $78,000 to $80,000 intact. It then needs to reclaim roughly $82,500, build acceptance through $88,000 to $92,000, and test $100,000.
A move toward $115,000 to $125,000 into year-end requires more than a chart breakout. It would require continued ETF accumulation, softer real-yield pressure, and policy signals that turn energy relief into a broader liquidity expectation.
That is the mirror image of the downside case. The same subsidies, tax cuts, reserve releases, and conservation measures that can keep inflation sticky can also become the first sign that policymakers will not allow the shock to crush demand.
Bitcoin rises if markets decide that policy support is bigger than the inflation drag.
The test is policy, then price
Bitcoin does not need the oil market to return to normal before it can move higher. It needs markets to decide what the policy response means.
If policy keeps consumers spending while energy remains expensive, central banks have less room to ease and Bitcoin remains vulnerable to the high-beta path.
If policy absorbs enough pain to shift the conversation toward growth support, liquidity, and currency debasement, Bitcoin has a route back into the scarce-asset trade.
The live test is therefore simple but demanding. Bitcoin must keep the $78,000 to $80,000 area while oil stress stays visible in government action.
Holding that zone and reclaiming $82,500 would strengthen the accommodation pathway. Losing it would point back to the stagflation squeeze, where oil policy tightens the financial conditions Bitcoin needs to escape.
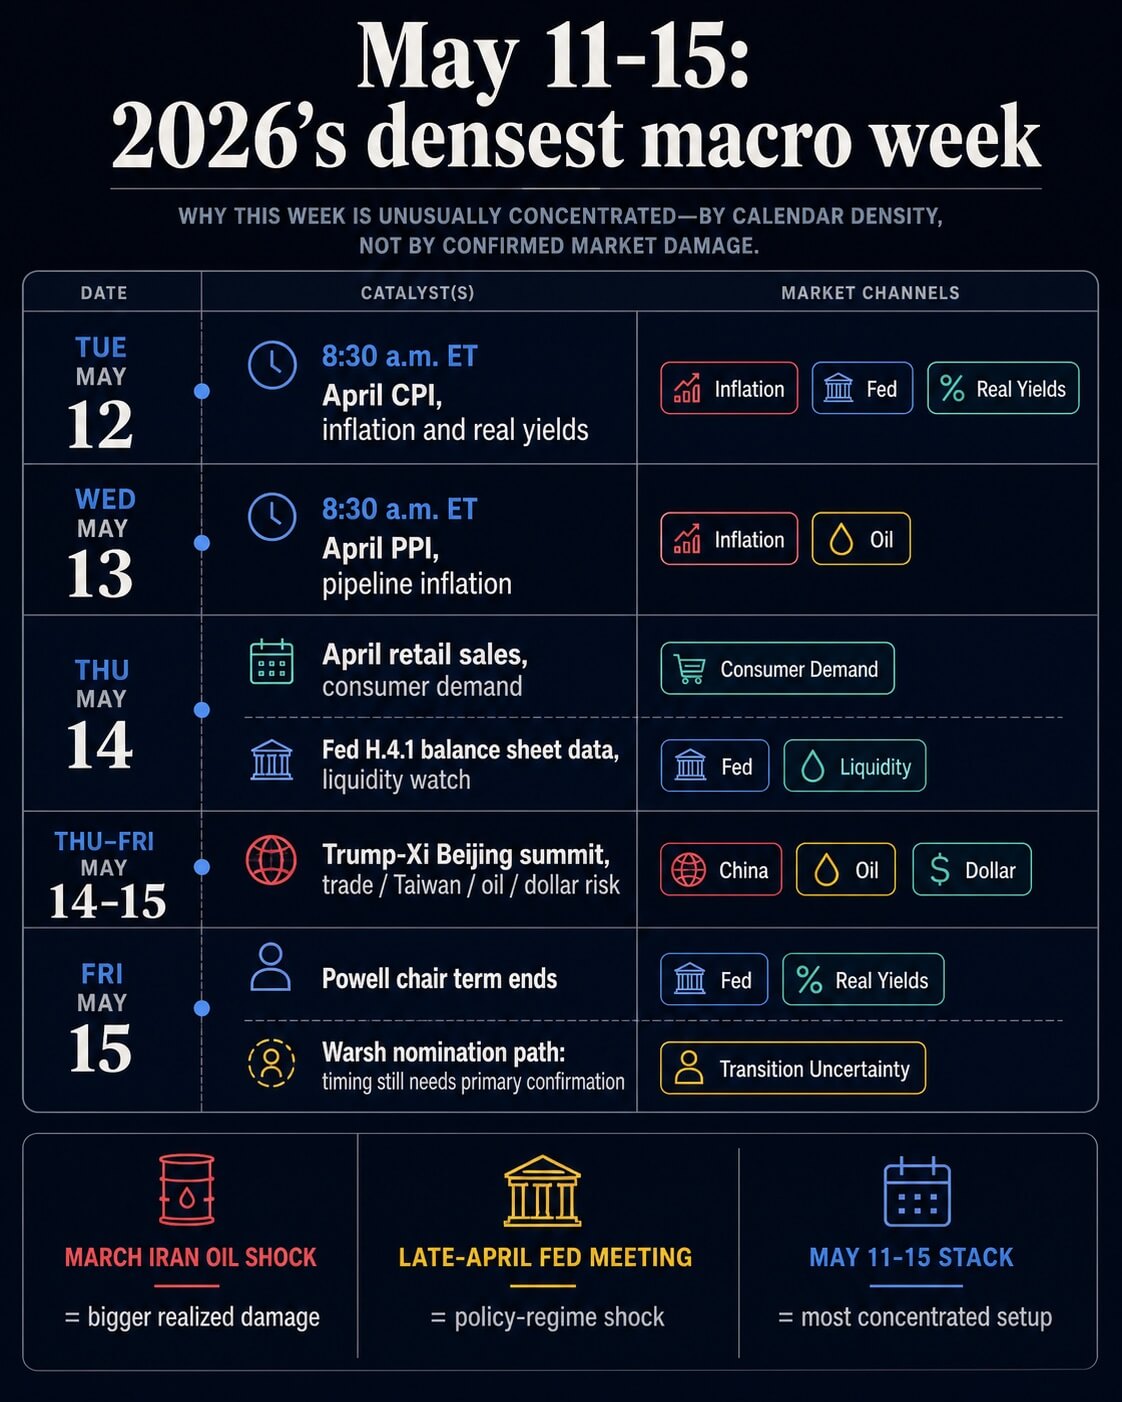
Bitcoin faces 2026’s densest macro test as CPI, Warsh, and Trump-Xi collide
This week (May 11-15) has a credible claim to being the most consequential macro window of 2026 so far, as it compresses every channel currently driving risk assets into a single sequence.
Inflation, producer costs, consumer demand, Fed liquidity, central bank leadership, trade risk, oil risk, and the dollar are all scheduled to move within five trading days.
Bitcoin enters that window as a liquidity-sensitive institutional asset, making the calendar a direct test of whether the recovery above $80,000 has macro sponsorship or only positioning support.
The strongest rival week came earlier in the year, when the Iran conflict and the Strait of Hormuz shock pushed energy markets into the center of the inflation debate.
The St. Louis Fed’s review of market reactions to military action against Iran marked Feb. 28, Mar. 1, and Apr. 13 as key shock points for oil, volatility, and geopolitical repricing.
That episode carried the larger single exogenous impulse. It changed the inflation path through energy, widened the risk premium in crude, and forced investors to reprice the Fed’s tolerance for cutting into a supply shock.
The March inflation data then showed how that shock entered the official series. The March CPI report showed consumer prices rising 0.9% month over month and 3.3% year over year, with energy up 10.9% and gasoline up 21.2%. The March PPI report showed final demand prices rising 0.5% in March and 4.0% over the prior 12 months, the largest annual increase since February 2023.
Those prints gave 2026 a genuine inflation shock rather than a routine data scare.
April 28-29 was the other major comparison point because it combined an FOMC decision, dissents, oil-related inflation anxiety, and the Senate Banking Committee’s movement on Kevin Warsh.
The Fed held rates at 3.5% to 3.75%, but the April FOMC statement carried an unusually fractured vote. One governor dissented in favor of a 25 basis point cut, while three officials supported the hold and opposed language that leaned toward easing.
That meeting exposed a central bank split between inflation caution and growth insurance.
May 11-15 ranks above those weeks in event density.
The Iran shock was larger as a geopolitical impulse. The April FOMC was sharper as a policy signal.
This week combines both transmission paths and adds a leadership handoff. It forces markets to price in inflation persistence, consumer resilience, Treasury and reserve mechanics, Fed credibility, and U.S.-China geopolitical risk simultaneously.
For Bitcoin, that makes it the broadest macro stress test of the year so far.
Calendar of major macro events between May 11 and May 15, including CPI, PPI, retail sales, Fed liquidity data, Powell remarks, and the Trump-Xi summit, outlining the key catalysts shaping Bitcoin and global risk markets.
The official calendar stacks inflation, demand, Fed liquidity, leadership risk, and China into one macro test sequence
The official sequence begins with inflation.
The Bureau of Labor Statistics has the April CPI release scheduled for Tuesday, May 12 at 8:30 a.m. ET.
It then has the April PPI release scheduled for Wednesday, May 13 at 8:30 a.m. ET.
That pairing gives markets a two-day signal on whether the March energy shock and tariff pressure are still moving through consumer and producer prices, or whether the inflation impulse is already losing force.
Thursday broadens the test from prices to demand and liquidity.
The Census Bureau has April retail sales scheduled for Thursday, May 14 at 8:30 a.m. ET.
The Federal Reserve’s May calendar lists H.4.1 balance sheet data for the same day at 4:30 p.m. ET.
That means markets receive a consumer-demand signal in the morning and a liquidity signal after the close.
A strong retail number alongside hot inflation would reinforce the case for policy restraint. A weaker retail print alongside softer inflation would give the next Fed chair more room to argue that the economy can absorb lower rates.
The balance sheet release carries direct information for crypto. The May 7 H.4.1 report showed total Fed assets near $6.71 trillion, reserve balances around $3.03 trillion on average, and the Treasury General Account near $878 billion on average.
For Bitcoin, the direction of reserves and Treasury cash balances often carries more direct market information than the headline size of the Fed’s asset portfolio.
Falling reserves and a large Treasury cash balance can keep liquidity tight even when investors expect easier policy later.
Friday then adds the leadership handoff.
Jerome Powell’s official term as Fed chair ends May 15, while his Board term runs to January 2028.
Powell also said at the Apr. 29 press conference that he expected to continue serving as a governor for a period after the chair term, while keeping a low public profile.
Kevin Warsh’s nomination sits on the same track. The Senate Banking Committee held a nomination hearing on Apr. 21, and the committee later advanced him on a party-line vote.
Warsh could inherit his first inflation test before markets know his reaction function
Wednesday’s official anchor is PPI, while the Fed calendar lists other officials and provides no primary-source basis for making a chair speech the central event.
The larger issue sits at the end of the week: Warsh could inherit his first inflation signal before his reaction function is visible.
If CPI or PPI accelerates, the new chair begins boxed in by data.
If inflation cools, he begins with room to define how quickly the Fed can pivot without inviting a bond-market credibility premium.
President Donald Trump’s China trip then widens the map. He is scheduled to meet Xi Jinping in Beijing during a May 14-15 visit, according to AP.
That summit adds trade, tariffs, Taiwan, oil logistics, and dollar-risk channels to the same window as CPI, PPI, retail sales, H.4.1, and the Fed leadership transition.
A constructive summit could lower the trade-risk premium and ease the dollar bid.
A tense summit could lift the dollar and pressure offshore liquidity, especially if energy security and the Iran war remain tied to the negotiations.
That combination makes the week structurally different from the usual CPI cycle. Inflation data alone can move Bitcoin. A new Fed chair inheriting that data can change how markets price the next several meetings.
Warsh’s nomination has already been framed around institutional change at the central bank, including questions about models, communications, bond holdings, and the Fed’s reaction function.
That creates an immediate test: does the market treat the transition as a path toward a more responsive Fed, or as a source of uncertainty around independence, inflation tolerance, and the long-run policy framework?
A hotter sequence would put Warsh in the hardest possible opening position.
CPI and PPI strength would raise doubts about near-term cuts.
Strong retail sales would reduce the urgency for demand support.
Elevated oil prices would keep the inflation path vulnerable.
A tense Beijing summit would support the dollar through trade and geopolitical risk.
In that environment, a dovish signal from the incoming chair could backfire if bonds interpret it as political pressure or premature easing.
Bitcoin might initially respond to the idea of easier policy, but a rise in real yields and the dollar would likely cap that response.
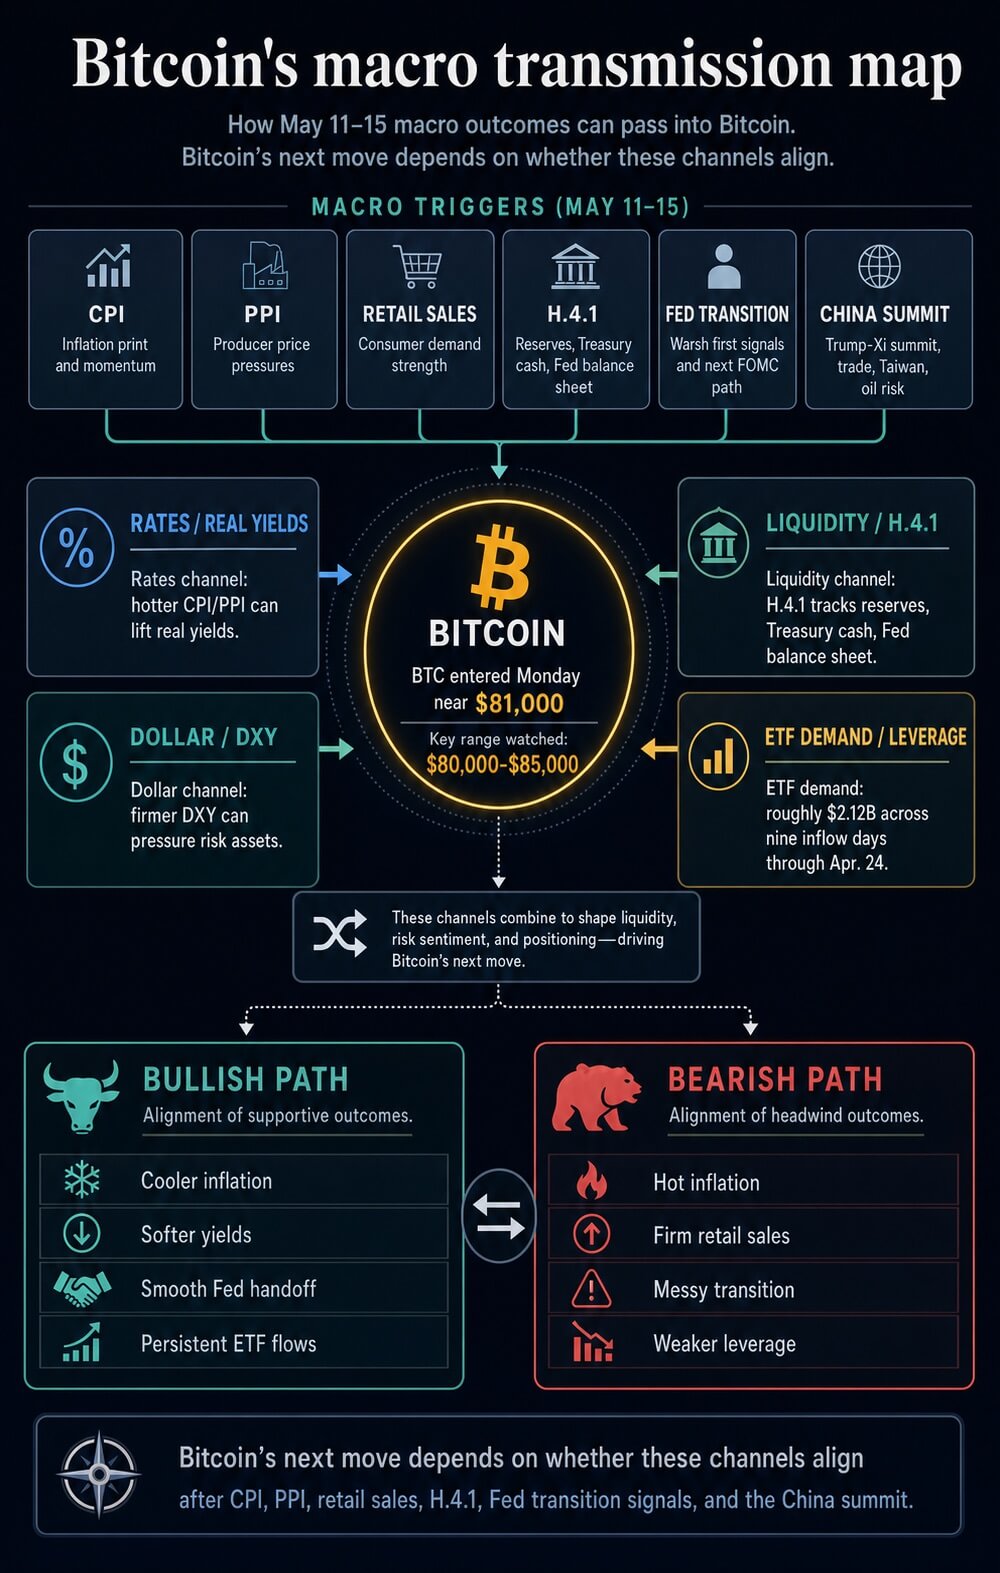
Bitcoin’s macro test transmission map runs through real yields, the dollar, ETF flows, leverage, and reserves
Bitcoin enters the week near $81,000 after recovering from the high-$75,000s around the Apr. 29 FOMC period.
That rally improved the chart structure, but the next leg depends on whether macro variables confirm the move. The relevant channel is now broader than spot demand on crypto exchanges.
Bitcoin now trades through real yields, the dollar, ETF allocation flows, leverage conditions, and the same liquidity variables that shape equities and credit.
The first channel is rates.
A hot CPI print would likely lift nominal yields and real yields if markets conclude that the Fed has less room to cut. A cooler CPI print would likely ease that pressure, especially if core inflation softens alongside headline inflation.
The distinction is important because an energy-driven headline shock can produce an awkward signal.
Powell said after the Apr. 29 meeting that officials wanted to see progress beyond the energy shock and tariff effects before easing.
If April shows hot headline inflation with cooler core inflation, the market reaction may depend on whether Warsh signals patience, urgency, or a willingness to look through the oil impulse.
The second channel is the dollar.
CryptoSlate’s prior work on Bitcoin, M2, and dollar strength showed how a stronger dollar can interrupt the transmission from expanding global liquidity to BTC.
That remains the central macro risk. Bitcoin can benefit from easier policy expectations, but a rising dollar can offset that impulse by tightening global financial conditions.
This is why the Trump-Xi meeting sits inside the Bitcoin trade. Trade relief can soften the dollar and lower risk premia. Escalation can lift the dollar and pressure offshore liquidity.
The third channel is the Fed balance sheet and Treasury cash.
A Thursday H.4.1 release showing rising reserves and easing pressure from the Treasury General Account would give Bitcoin a stronger liquidity foundation.
A release showing reserve drain alongside a still-large Treasury cash pile would make any rally more dependent on ETF inflows and leverage.
CryptoSlate’s analysis of debt, liquidity, and Bitcoin has already shown that aggregate liquidity can look supportive while the usable liquidity reaching risk assets remains constrained.
Bitcoin’s next macro test runs through inflation data, Fed signals, liquidity, ETF demand, and geopolitical risk.
The next major Bitcoin move depends on whether macro test channels align
The fourth channel is institutional flow.
Since the launch of U.S. spot Bitcoin ETFs, BTC has become easier for traditional portfolios to buy, rebalance, and sell.
CryptoSlate’s coverage of the ETF-driven market-structure shift described how institutions have become a primary force in Bitcoin liquidity and price formation.
A separate analysis of passive money noted that U.S. spot Bitcoin ETFs had accumulated roughly $58.4 billion in cumulative net inflows by late April, with IBIT above $60 billion in net assets, reinforcing how far Bitcoin has moved into traditional allocation workflows through ETF wrappers.
That structure works in both directions.
ETF inflows can amplify a macro relief rally when yields fall, and the dollar weakens. ETF outflows can accelerate downside when real yields rise, the dollar strengthens, and leveraged traders are forced to reduce exposure.
A hot CPI and PPI sequence, strong retail sales, falling reserves, and a tense Trump-Xi outcome would be the most difficult mix for BTC because every transmission channel would point toward tighter financial conditions.
A cooler inflation sequence, resilient but slowing retail sales, improving reserves, and a less hostile China signal would give Bitcoin the strongest macro foundation it has had in 2026.
A cooler sequence would change the setup. Softer CPI and PPI would validate the idea that the March energy spike was passing through rather than embedding.
A slower but stable retail number would support a soft-landing path. A Thursday balance sheet release showing firmer reserves would improve the liquidity backdrop. A constructive Trump-Xi meeting would reduce the trade-risk premium and could weaken the dollar.
In that scenario, Warsh would have more room to define a gradual policy pivot without starting his tenure under immediate inflation pressure.
Bitcoin would then have a clearer path to test higher levels, provided ETF creations expand, and derivatives positioning avoids an unstable long build.
The mixed outcome may be the most realistic one.
Headline inflation can stay firm because of energy while core inflation cools. Retail sales can remain solid in nominal terms while real demand slows. The Fed balance sheet can show a large aggregate asset base while reserves remain under pressure. Trump and Xi can produce limited trade relief while leaving Taiwan, oil logistics, and tariff enforcement unresolved.
That mix would keep Bitcoin in a macro waiting zone. It would reward intraday volatility, but it would withhold the confirmation needed for a durable range expansion.
The next test is specific.
Watch Warsh’s first signals on inflation tolerance, balance-sheet policy, and central-bank independence.
Watch the June FOMC path, especially whether the statement language shifts after the leadership handoff.
Watch real yields and DXY before treating Bitcoin’s move as confirmation.
Watch H.4.1 reserves and the Treasury General Account before assuming liquidity has improved.
Watch spot ETF net flows, funding rates, and liquidation clusters before treating a breakout as structurally supported.
If those variables align, May 11-15 becomes the week Bitcoin regained a macro tailwind after months of rate, dollar, and oil pressure.
If they fail to align, the week becomes a sharper lesson in the post-ETF regime: Bitcoin can trade like a scarce asset, a liquidity asset, and an institutional risk asset at the same time.
The direction of the next major move will come from which identity markets choose after CPI, PPI, retail sales, H.4.1, Warsh, and Trump-Xi all hit the same window.
Dogecoin is facing a confusing technical setup as technical analysis warns of a major higher-timeframe move that could first send DOGE into a deeper accumulation zone. The chart appears bearish at first glance, but the inverted price scale changes the reading, turning the projected drop into a longer-term bullish setup that points to $1, $2, and eventually $5.
Dogecoin Is Approaching Its Smart Money Zone
Technical analysis done by a crypto analyst known as Crypto Patel is built around the idea that Dogecoin may still need to push lower before its larger upside cycle begins. Crypto Patel’s 3-week DOGE/USD chart on TradingView covers over a decade, from 2014 to a projected 2028, and it shows repetitive price action. The key detail, however, is that the chart is inverted for emphasis, meaning the bearish-looking projection actually points to a bullish long-term move.
The chart shows Dogecoin inside a descending channel that has guided the price for years. The first major phase began with a rejection at the upper trendline before the 2017 cycle, followed by a large move that eventually gave way to another long correction. A second major base formed around early 2021, which later led to Dogecoin’s explosive run during the last meme coin mania.
Crypto Patel appears to be comparing the current structure to those earlier phases. The third setup on the chart is developing right now, where Dogecoin looks like it is rejecting at the upper trendline of the descending channel.
What’s Next For Dogecoin?
The marked rejection zone around the current area shows that the Dogecoin price could still revisit as low as $0.07 in the accumulation range for a bottom before a strong higher-timeframe reversal. According to Crypto Patel, retail traders will sell the bottom, but smart money traders are already setting alerts.
Interestingly, on-chain data support this notion of smart money movements and whales that are accumulating Dogecoin. Recent on-chain data in early May shows that Dogecoin whales recently recorded their busiest day in six months, and most of this activity is accumulation moves.
If Dogecoin breaks below the current range without strong spot demand, the move could still drag the price deeper into Crypto Patel’s $0.10 to $0.07 accumulation band. However, the projection shows the Dogecoin price reversing around the accumulation band and embarking on a rally, with the analyst pointing at $1, $2, and $5 targets.
Crypto Patel’s $1, $2, and $5 targets are very bullish, especially because Dogecoin is down by 85% from its 2021 all-time high of $0.7316.
At the time of writing, Dogecoin is trading at $0.109. The first major checkpoint would be confirming daily and weekly closes above $0.10, reclaiming higher resistance levels around $0.15 to $0.20, and confirming that the current structure has moved out of a long corrective phase.
Bitcoin, Ripple’s token, Solana’s SOL, and several other altcoins made impressive moves over the past few hours, which was rather unexpected given the Sunday market sentiment and lack of major developments.
Interestingly, these recent gains coincided with Donald Trump’s latest message on Iran.
The statement on Truth Social from the POTUS reads that Iran has been “playing games with the United States, and the rest of the World, for 47 years.” He also placed significant blame on former President Barack Obama, saying the situation hit “pay dirt” during his time in office.
“He was not only good to them, he was great, actually going to their side, jettisoning Israel, and all other Allies, and giving Iran a major and very powerful new lease on life. Hundreds of Billions of Dollars, and 1.7 Billion Dollars in green cash, flown into Tehran, was handed to them on a silver platter. Every Bank in D.C., Virginia, and Maryland was emptied out — It was so much money that when it arrived, the Iranian Thugs had no idea what to do with it. They had never seen money like this, and never will again. It was taken off the plane in suitcases and satchels, and the Iranians couldn’t believe their luck.”
After also blaming Joe Biden, Trump said Iran will be laughing no longer at the USA. This statement comes after reports that Iran had sent their response to the US’s latest peace proposal. However, there’s no further information as of press time regarding the actual decision.
As mentioned above, many crypto assets are in the green now. Bitcoin’s gains are among the most modest, but the asset still tapped $81,600. XRP has stolen the show from the larger-cap alts, surging by over 5% daily to a multi-week peak of just over $1.50.
SOL has risen to almost $100 after a 3.5% daily increase, ETH is well above $2,350, and ADA has gained over 5% to sit close to $0.29.
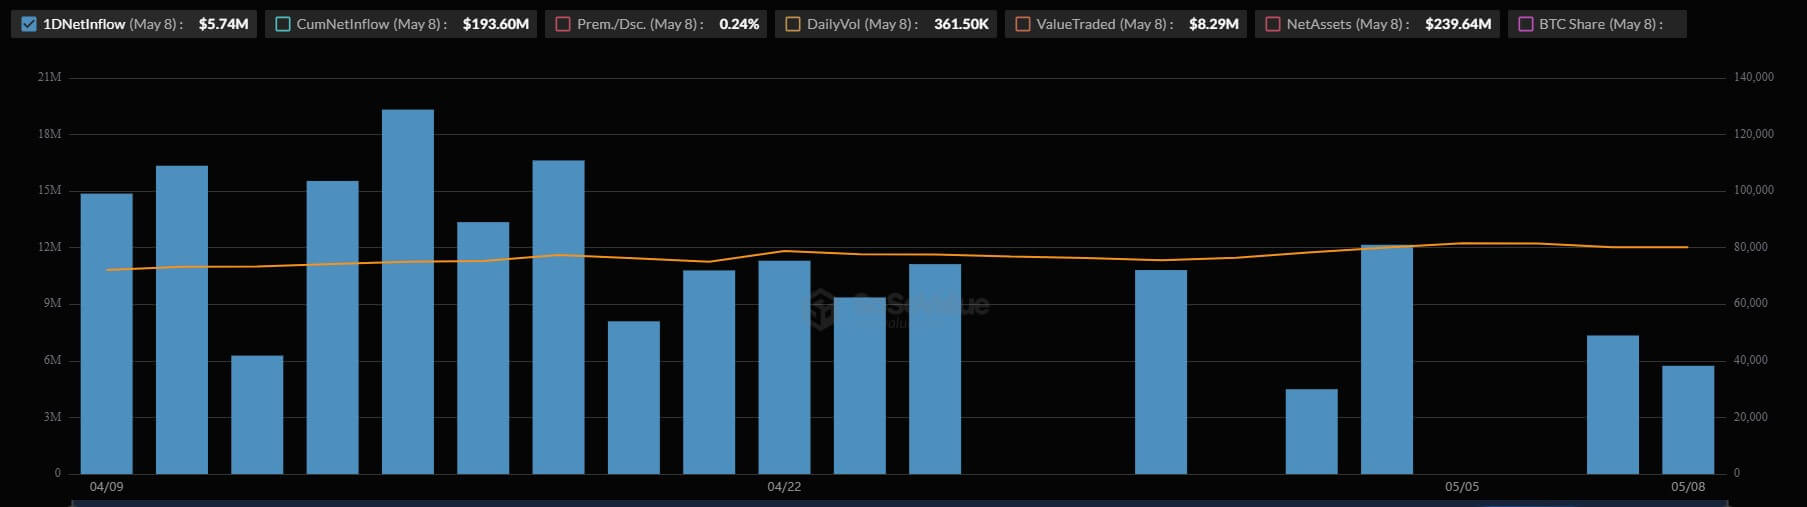
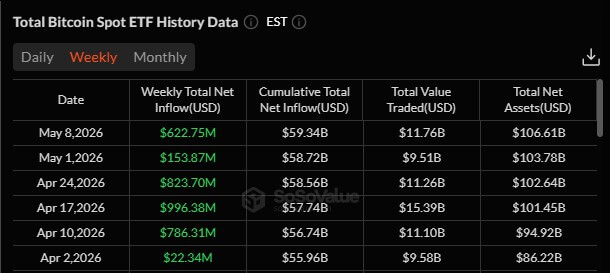
The Morgan Stanley Bitcoin Trust completed its first month of trading without a single day of net outflows, providing an early test case for how a Wall Street bank’s brand, pricing, and distribution network can alter the competitive landscape of the digital-asset market.
The product, trading under the ticker MSBT, launched on April 8 and has since attracted about $193 million in net inflows, while managing over $240 million in assets.
Data from SoSoValue shows the fund’s inaugural month included 17 days of positive inflows and five days of flat flows, with zero daily redemptions recorded.
Morgan Stanley Bitcoin ETF First Month Flows (Source: SoSo Value)
That streak stands out amid a period of localized volatility for rival US spot Bitcoin funds. For context, the broader Bitcoin ETF category bled $422 million in combined outflows during the last two trading sessions, while MSBT successfully absorbed an additional $13 million in fresh capital.
This divergence gives Morgan Stanley a flow record that fund sponsors typically take quarters to build.
Currently, MSBT holds about 2,620 Bitcoin, ranking it 32nd among Bitcoin-holding crypto ETFs and exchanges, according to Bitcoin Treasuries data.
While it trails the largest spot funds in raw size, its resilience during market drawdowns indicates that institutional clients are treating the fund as a long-term allocation.
How Morgan Stanley’s MSBT achieved a flawless first trading month
To understand why this capital is proving so sticky, market observers are looking directly at the issuer’s pedigree, as Morgan Stanley’s primary advantage in a turbulent market is familiarity.
While crypto-native firms and dedicated asset managers pioneered the US spot Bitcoin ETF market, the bank offers investors a distinctly different entry point: a regulated financial institution with an established wealth-management and advisory base.
The bank leaned into this distinction at launch. Amy Oldenburg, Morgan Stanley’s head of digital asset strategy, noted that digital assets are increasingly intersecting with traditional markets. She emphasized the firm’s focus on helping clients navigate this shift through financial structures they already trust.
However, brand familiarity and trust are only half the equation as the firm is also weaponizing its cost structure to capture market share.
The fund charges a 0.14% sponsor fee, which the bank positioned at launch as the lowest among all spot Bitcoin ETPs. It deliberately undercuts the Grayscale Bitcoin Mini Trust at 0.15%, Bitwise at 0.20%, and BlackRock’s industry-leading iShares Bitcoin Trust at 0.25%.
While the margin appears small in percentage terms, fees become a critical battleground as Bitcoin ETFs transition from novel launch products into standard portfolio allocation tools.
For fiduciaries, advisers, and institutions, a lower expense ratio heavily influences model-portfolio decisions when multiple products track the identical underlying asset and offer similar execution and custody standards.
This aggressive pricing strategy gives Morgan Stanley a highly effective pitch as its internal wealth-management channel expands access. The firm employs roughly 16,000 financial advisers overseeing $9.3 trillion in client assets.
Even a fractional allocation shift through this vast network could exponentially increase MSBT’s asset base over the coming quarters. Yet, this internal, advisor-led growth is just one pillar of a much wider, multi-front rollout.
Bitcoin ETFs register longest weekly inflow streak this year
Meanwhile, MSBT’s first month also benefited from a broader recovery in demand for US spot Bitcoin funds.
SoSoValue data show the US Bitcoin ETFs have drawn more than $3 billion across six straight weeks of net inflows through May 8, the longest run of weekly gains since last summer.
US Bitcoin ETFs Weekly Inflow Since April 2 (Source: SoSo Value)
Macroeconomic research platform Ecoinometrics noted that this steady improvement in ETF inflows suggests real, long-term capital is returning to the digital asset market, rather than a temporary rebound driven by short-term positioning or leverage.
For MSBT, the wider market recovery provides useful context. Morgan Stanley did not launch into a weak ETF market, but its lack of daily redemptions still sets it apart in a category where capital has continued to move unevenly across issuers.
Tom Lee has projected that Ethereum could climb to $12,000 by the end of 2026, delivering one of the most bullish forecasts unveiled during the Consensus 2026 conference in Miami.
Speaking during a keynote session, the Bitmine Immersion Technologies chairman outlined an optimistic outlook for the broader digital asset market, while mentioning the firm’s ambitious strategy to accumulate 5% of Ethereum’s total circulating supply.
The company currently holds more than 5.18 million ETH, despite the position reportedly being associated with billions of dollars in unrealized losses.
The Ethereum prediction
Lee set year-end targets for both major cryptocurrencies at the conference. He projected Bitcoin (BTC) could trade between $150,000 and $200,000, while Ethereum could reach new all-time highs in the $9,000 to $12,000 range.
Lee based the outlook on his view that the prolonged downturn in crypto markets has ended. “Crypto Spring, in our view, has commenced, and like past cycles, investor sentiment and conviction are muted and bearish even as crypto prices strengthen,” he said at the Miami event.
He pointed to the capitulation among retail traders earlier this year as a contrarian signal. In March 2026, Lee argued that widespread “rage quitting” by retail traders was a classic indicator of a market bottom. “You know you’re at the end when people give up on Bitcoin,” he said.
He continues to believe the market would see an upturn in its fortunes in the very near future.
Bitmine’s ETH position
Lee’s forecast is closely tied to his role at Bitmine Immersion Technologies, where he serves as chairman. The company has increasingly drawn comparisons to Strategy because of its aggressive cryptocurrency accumulation strategy, though Bitmine’s focus remains firmly on Ethereum rather than Bitcoin.
Bitmine’s average acquisition price is estimated at approximately $2,206 per token. With Ethereum trading near $2,328 on May 9, the company’s holdings were hovering only slightly above breakeven levels.
Despite the recent stabilization in prices, the investment has come with significant volatility. In its latest quarterly filing, Bitmine disclosed roughly $3.78 billion in unrealized losses tied to its Ethereum position.
The company’s financial exposure has also drawn attention across the crypto community. Kalshi Crypto highlighted the gap between Lee’s bullish outlook and Bitmine’s balance sheet, noting that the firm’s Ethereum portfolio remained down by an estimated $6.3 billion at one stage.
JUST IN: Tom Lee says Ethereum will hit $12,000 this year
Lee’s track record of perpetual optimism has drawn criticism. Canadian billionaire and mining executive Frank Giustra, a long-time advocate for gold over crypto, called Lee’s forecasts “embarrassing to watch” on social media.
For ETH to reach Lee’s $12,000 target, it would need to rally more than 400% from its current price near $2,300. His $200,000 Bitcoin target would require BTC to roughly double from its level around $80,700.
The gap between Lee’s predictions and Bitmine’s current financial position remains a cause for central tension. If Ethereum continues to range or declines even further, Bitmine’s unrealized losses would deepen, and Lee’s credibility as both an analyst and company executive may drop. If the opposite happens, Bitmine’s early accumulation strategy would end up a stroke of brilliance.
Don’t just read crypto news. Understand it. Subscribe to our newsletter. It’s free.
That puts a 1,150% increase as a 2031 target inside a market that is still trying to prove it can hold the $80,000 area.
CryptoSlate’sBitcoin page shows BTC near $80,200 on May 9, with a market capitalization near $1.61 trillion and an all-time high of $126,198 set on Oct. 6, 2025.
A move to $200,000, another price target being batted around lately, would require Bitcoin to rise roughly 2.5 times from that level. A move to $1 million would require roughly 12.5 times.
Bitcoin has produced larger percentage moves before, but the current forecast cycle now rests on a market question: whether the latest institutional demand is strong enough to absorb coins being sold into the rebound.
Bitcoin price chart showing projected Bitcoin cycle highs and pullbacks across multiple halving periods.
Why seven-figure math is back
The VanEck call lands alongside other seven-figure frameworks. Bitwise CIO Matt Hougan laid out a formal $1 million model in March, arguing that Bitcoin can reach seven figures by gaining share as the store-of-value market expands.
In his model, the market grows to about $121 trillion over 10 years, and Bitcoin reaches $1 million if it captures about 17% of the total.
That is a different time horizon from Sigel’s reported five-year view, but the logic overlaps. Both depend less on a single trading catalyst and more on Bitcoin becoming a larger part of how institutions, advisers, sovereign entities, and younger investors think about long-term savings outside the fiat banking system.
VanEck’s own research desk had already published a longer-range version of that argument. In a 2024 Bitcoin 2050 scenario, the firm modeled a possible $2.9 million Bitcoin price by 2050 if BTC becomes a meaningful medium of exchange and reserve asset.
That report used assumptions around trade settlement, reserve holdings, and Bitcoin scaling infrastructure. The newly reported call is more immediate, but it comes from the same broad research posture: Bitcoin as a macro asset whose valuation depends on adoption beyond crypto-native buyers.
If the thesis is only a trading call, the next resistance level carries most of the weight. If the thesis is that adoption math, ETF flows, portfolio allocation, sovereign reserve behavior, and the size of the global store-of-value market carry more weight than a single weekly candle.
The near-term price frame is less clean. Fundstrat’s Tom Lee’s $200,000 to $250,000 Bitcoin range for 2026 should also be part of the conversation.
Prior CryptoSlate coverage had already placed Lee’s $200,000 forecast among a wide 2026 target set that also included more conservative and more aggressive institutional calls.
Arthur Hayes, the Maelstrom CIO and BitMEX co-founder, is cited as aiming for a shorter-term $125,000 target tied to liquidity and war-driven spending.
Together, those calls make Bitcoin look like it is re-entering a target-heavy phase. Hayes’ framework is macro-liquidity and event-driven. Lee’s is a 2026 market-cycle view.
Bitwise’s model is a store-of-value share calculation. VanEck’s reported call compresses a seven-figure outcome into roughly half a decade.
That difference should keep us grounded. A cluster of bullish forecasts can shift sentiment, but the market structure still has to carry the price there. The Fear and & Greed Index still sits firmly in the ‘fear’ category.
Recent CryptoSlate coverage framed Bitcoin’s rebound above $80,000 as a live test between seller supply and ETF demand. Long-term holders have been taking profits into strength, while spot Bitcoin ETF buyers have helped absorb supply.
That standoff is why the $90,000 area keeps appearing as the next upside test.
The bullish version is straightforward. If ETF demand continues to absorb coins from older holders, the low-$80,000 range could become a base rather than a ceiling. From there, a move toward $90,000 would provide the market with evidence that institutional access is doing real price-discovery work, rather than merely softening a rebound.
That would still leave $200,000 as a stretch target. It would, however, make six-figure 2026 targets easier to discuss without treating them as detached from traded demand.
A market that can hold $80,000, push through $90,000, and do it on broad spot demand would look more compatible with the Fundstrat-style bull case than a market that keeps rejecting the same supply zone.
The failure case is just as important. If ETF demand fades while long-term holders continue selling into rallies, the $1 million conversation becomes a long-horizon adoption argument rather than an explanation for the current price.
In that case, the five-year and 10-year targets can remain intellectually coherent while the 2026 market still struggles to escape its range.
That tension separates price targets from the evidence that would make them relevant now. Bitcoin can leave the $1 million debate unresolved for now. It needs to show whether the buyers who arrived through ETFs and institutional channels are still willing to absorb supply near levels that recently acted as resistance.
The practical threshold is therefore smaller than the largest target on the board. A clean $90,000 push would not validate seven-figure math, but it would show that the market can handle seller pressure while fresh capital still reaches spot Bitcoin products.
What would change the market signal next
Bitcoin needs to hold the low-$80,000 area and then attack $90,000 with enough spot demand to make the move look durable.
ETF flow data, long-term holder distribution, and any fresh confirmation of the VanEck comments will carry more weight than another round number from an executive or strategist.
The seven-figure targets are moving the debate away from whether Bitcoin can regain its 2025 high and toward whether the asset can claim a larger share of global savings. That is a much larger argument than a technical breakout, but it still needs the current market to cooperate.
For now, the credible takeaway is that institutional researchers are again willing to publish or defend seven-figure math while the market tests whether ETF-era demand can turn $80,000 from a stress point into a launch point.