The US 30-year Treasury yield fell to 4.85% on Wednesday, its lowest level since April 15, after President Donald Trump signaled easing tensions with Iran over Strait of Hormuz shipping.
Bond prices rose as the update pushed oil lower, easing near-term inflation fears and lifting demand for long-dated government debt.
US 30-Year Treasury Yield Performance. Source: TradingView
Oil Slump Drove the 30-Year Treasury Yield Lower
In a Truth Social post, Trump said Iran confirmed no tolls or charges on ships crossing the Strait of Hormuz. He warned that negotiations would end at once if the claim proved false.
The signal eased fears over the waterway that carries about a fifth of the world’s oil. Falling oil prices followed soon after.
West Texas Intermediate (WTI) almost below $70 a barrel for the first time since March 2. Brent crude briefly fell toward $74, its lowest since before the conflict began in late February.
Lower energy costs ease a key driver of near-term inflation. That prospect drew buyers into Treasuries, pushing prices up and yields down.
The drop reversed much of a sharp spring selloff. The 30-year yield had topped 5.19% on May 19, its highest since 2007, when war fears drove inflation bets higher.
Hawkish Fed Clouds the Outlook
The rally sits awkwardly against the Federal Reserve’s latest message. New Chair Kevin Warsh held rates at 3.5% to 3.75% on June 17, yet projections turned more hawkish.
The median official now sees the rate ending 2026 at 3.8%, above the current range. That points to a hike, not a cut, as the base case. These hawkish Fed signals track inflation the Fed projects at 3.6% for 2026.
The split shows in the curve. The policy-sensitive 2-year yield holds above 4.2%, near a multi-month high, even as the long end leads the decline.
Lower long-term yields still feed into borrowing costs. The 30-year fixed mortgage rate eased to 6.47% in mid-June, down from 6.81% a year earlier, Freddie Mac data shows.
US Mortgage Rates,. Source: Freddie Mac data
The relief may prove fragile. Economist Nouriel Roubini, who flagged the 2008 housing crash, has warned that long-dated bonds stay exposed if inflation climbs again.
“With six percent inflation and two real, the 10-year bond yield has to be eight percent. Today it’s at four. It goes from four to eight, the price of the bond is going to fall by 40%…” Roubini told BeInCrypto.
Investors now turn to Thursday’s inflation report, the Fed’s preferred gauge and the next key inflation data point.
Until then, competing market risks from the Fed and the Middle East will keep yields volatile. For now, cheaper oil has handed the long end of the curve a reprieve.
President Donald Trump endorsed lower interest rates and declared that growth does not cause inflation before walking out of a Meet the Press interview with NBC’s Kristen Welker.
The walkout clip now dominates social feeds. However, the policy signals buried in the exchange matter far more for Bitcoin (BTC), oil, and equities.
The Walkout Buried a Clear Message on Rates
In the interview, Welker pressed Trump on whether the Federal Reserve may need to raise rates under new Chair Kevin Warsh.
The Senate confirmed Warsh on May 13 by 54 votes to 45, the narrowest margin for any Fed chair. He chairs his first policy meeting on June 16 and 17, with rates at 3.50% to 3.75%.
Trump pushed the opposite way.
“There’s no reason to raise interest rates. The country becomes great. We built the country by doing great and having rates low.”
Fresh data gives the President his talking point. May payrolls rose by 172,000, roughly double the 85,000 consensus, while unemployment held at 4.3%.
Trump drew a conclusion that rejects decades of Phillips curve thinking, which links hot labor markets to rising prices.
“Growth is the greatest thing you can have and growth does not cause inflation.”
The stance revives a first-term pattern. Trump publicly hammered then Chair Jerome Powell through 2018 and 2019 to force cuts.
This time the pressure lands on an awkward target. Warsh built his reputation as a hawk and quit the Fed board in 2011 after opposing quantitative easing.
“I think Kevin is fantastic, and I want to do whatever he wants and I don’t want to have a big influence on him…”
Markets are not listening yet. CME FedWatch prices a 96% chance of a hold this month.
The war has rewritten energy math since late February. Brent crude jumped from about $72 per barrel to nearly $120 before easing to about $94 on Friday.
AAA puts the national gas average at $4.17 per gallon, up $1.16 since the Iran war began.
“It depends. It depends where the war goes. It could be after I give them a shot, and it could be if we sign an agreement it will go down now otherwise it will go down after we finish.”
Either path ends the same way, he argued, with gasoline prices set to “drop like a rock.”
Trump also signaled more military spending on top of a record base.
“We have debt and other thing, we have things we want to take care of. I want to go bigger on the military. I really do.”
The FY2027 budget already requests $1.5 trillion for defense, the largest single-year total since World War II, per CSIS.
The OMB projects a $2.06 trillion deficit this fiscal year, rising to $2.17 trillion next. Funding that gap forces the Treasury to issue more than $166 billion in debt every month.
Lower rates plus heavier issuance point to expanding liquidity, the variable Bitcoin traders watch most.
For the better part of two years, Wall Street has treated AI as the most bullish trade on the board, a growth engine that turbocharges earnings, underwrites stretched valuations, and promises a productivity windfall somewhere down the road.
However, the Fed has access to the same numbers and seems to be more inclined to treat the AI build-out as a fresh source of demand in a market that’s still fighting to drag inflation back toward its 2% target.
Goldman Sachs now expects AI-related capital spending to approach $800 billion in 2026, and it calculates that the surge will lift its full-year business investment forecast to 7.8% while adding roughly 3.3 percentage points to capital-expenditure growth on its own.
TrendForce, tracking the nine largest cloud providers in the world, places their combined 2026 outlay near $830 billion, a jump of about 79% over the previous year. A pretty big slice of that increase reflects rising prices rather than added capacity, with Microsoft attributing some $25 billion of its $190 billion budget to costlier memory and components.
All of it puts quite a bit of weight on the inputs the Fed tends to watch most closely, which could turn this investment boom into a policy headache.
Where does the $800 billion in AI spending actually go?
It helps to imagine this spending in physical terms. All of that money takes the shape of land, steel, transformers, copper wiring, gigawatts of fresh generation capacity, industrial-scale cooling, and the incredibly skilled and incredibly rare trades hired to assemble all of it.
Goldman described this as a wave that reaches across servers, semiconductors, memory, power infrastructure, data centers, software, and research budgets, and the bank’s longer-range model traces annual AI capex climbing from around $765 billion this year toward $1.6 trillion by 2031.
Power has become the binding constraint. In a late-May speech, Fed Governor Lisa Cook noted that electricity and water prices have each climbed about 5% over the past year, that chips, high-tech equipment, and software have all grown more expensive, and that wages in specialty construction trades have picked up notably. Households feel some of that pressure on their monthly bills, which began drawing political pushback as several state legislatures move to slow large data-center development.
The central bank’s leadership has been unusually clear and honest about where this leads. Speaking back in March, Jerome Powell told reporters that the construction frenzy was “putting pressure on all kinds of goods and services that go into building these things,” and he conceded that the effect was “probably pushing inflation up.”
Cook went further in that same May address, warning that “yet another shock to prices could be layered on from the heightened investment demand due to AI” and pointing out that companies have announced more than $1.5 trillion in data-center plans, only a sliver of which has actually been built.
The demand side of AI, in other words, is showing up in the price data well ahead of any productivity payoff the technology eventually delivers.
The consequences travel from Silicon Valley balance sheets straight into crypto. Bitcoin spent most of the year leaning on the expectation that cooling inflation would free the Fed to cut rates, loosen financial conditions, and rekindle the risk appetite that powered the 2024 rally.
CryptoSlate has documented how tightly the asset now tracks liquidity cycles, a sensitivity that has overtaken Bitcoin halving as the dominant price driver. An $800 billion demand makes rate cuts unlikely, since every dollar of AI-related price pressure hands the Fed one more reason to stay put.
Markets have already begun repricing that. Futures and prediction markets now put the odds of a hold at the June 16-17 meeting above 93%, which will be the first one chaired by Kevin Warsh following his May handover from Powell. CryptoSlate has tracked the reversal as it unfolded, from a stretch when bond traders were pricing a year-end hike to the inflation prints that kept the Fed frozen.
The repricing has bled into spot prices, with Bitcoin sliding to around $63,600 by June 4 after briefly breaking below $62,000, roughly half its October 2025 record and down more than 13% over the week. Much of that damage comes from exits, since Bitcoin ETFs saw a record 11-session outflow streak worth about $3.45 billion, the longest run of redemptions since the funds launched in 2024. A large share of that capital rotated straight into the AI and semiconductor equities that were driving the macro problem in the first place.
Over a five-year horizon, AI may well do what its champions promise, lowering costs, automating routine labor, and easing inflation through real gains in output per worker. However, the build-out phase tends to work the other way around first. Pulling years of infrastructure demand into a narrow window bids up hardware, energy, and talent long before we see any real efficiency, so the price shock arrives early and the windfall arrives late.
That gap between immediate consequences and delayed benefits is what’s been troubling the Fed. Warsh has argued that AI will prove “structurally disinflationary” and usher in “the most productivity-enhancing wave of our lifetimes,” a view that confirms his openness to lower rates. But Cook and Governor Michael Barr lean the other way, with Barr saying flatly that he doesn’t believe the AI boom will be a reason for lowering policy rates.
Traders, on the other hand, have been mostly troubled by timing. Bitcoin, alongside equities and the rest of the market, tends to respond to the first decision in front of them. So, a “productivity thesis” that will probably pay off in 2030 does little to positions held this week, month, or even quarter. Inflation running above 3% leaves Warsh little room to act on his convictions in June, regardless of where he’d like to steer.
The same AI boom inflating tech valuations and carrying the indices higher may be the very force keeping the Fed cautious, delaying the liquidity cycle that crypto traders have spent eighteen months waiting for. If policymakers settle on seeing $800 billion in annual spending as one more pillar of sticky demand, Bitcoin’s rate-cut trade rests on a foundation considerably thinner than its holders would care to admit.
Bitcoin’s path through 2026 now runs through global economic policy.
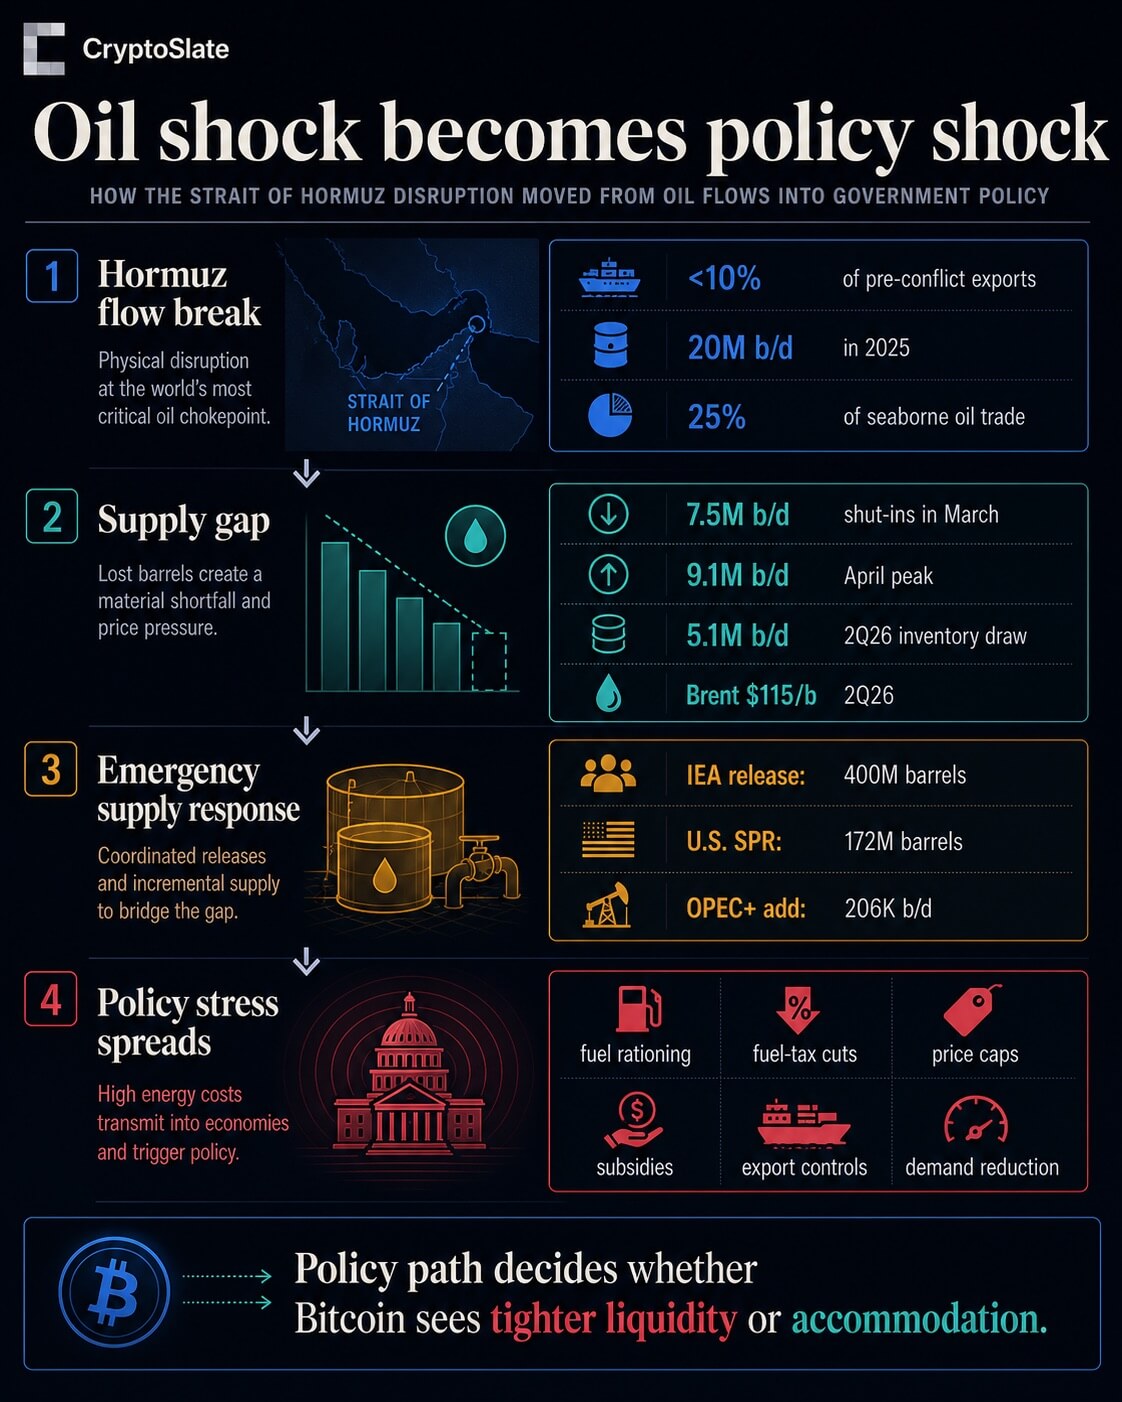
The disruption around the Strait of Hormuz has moved beyond a commodity-price event and into the machinery of governments.
The International Energy Agency said crude and refined-product exports through the strait had fallen to less than 10% of pre-conflict levels after about 20 million barrels per day moved through the route in 2025, equal to roughly a quarter of global seaborne oil trade.
That is the scale of shock that stops being only a Brent chart.
The U.S. Energy Information Administration now expects Middle East production shut-ins to average 7.5 million b/d in March, peak at 9.1 million b/d in April, and drive a 5.1 million b/d global inventory draw in the second quarter. It also sees Brent averaging $115 a barrel in 2Q26 before easing later in the year.
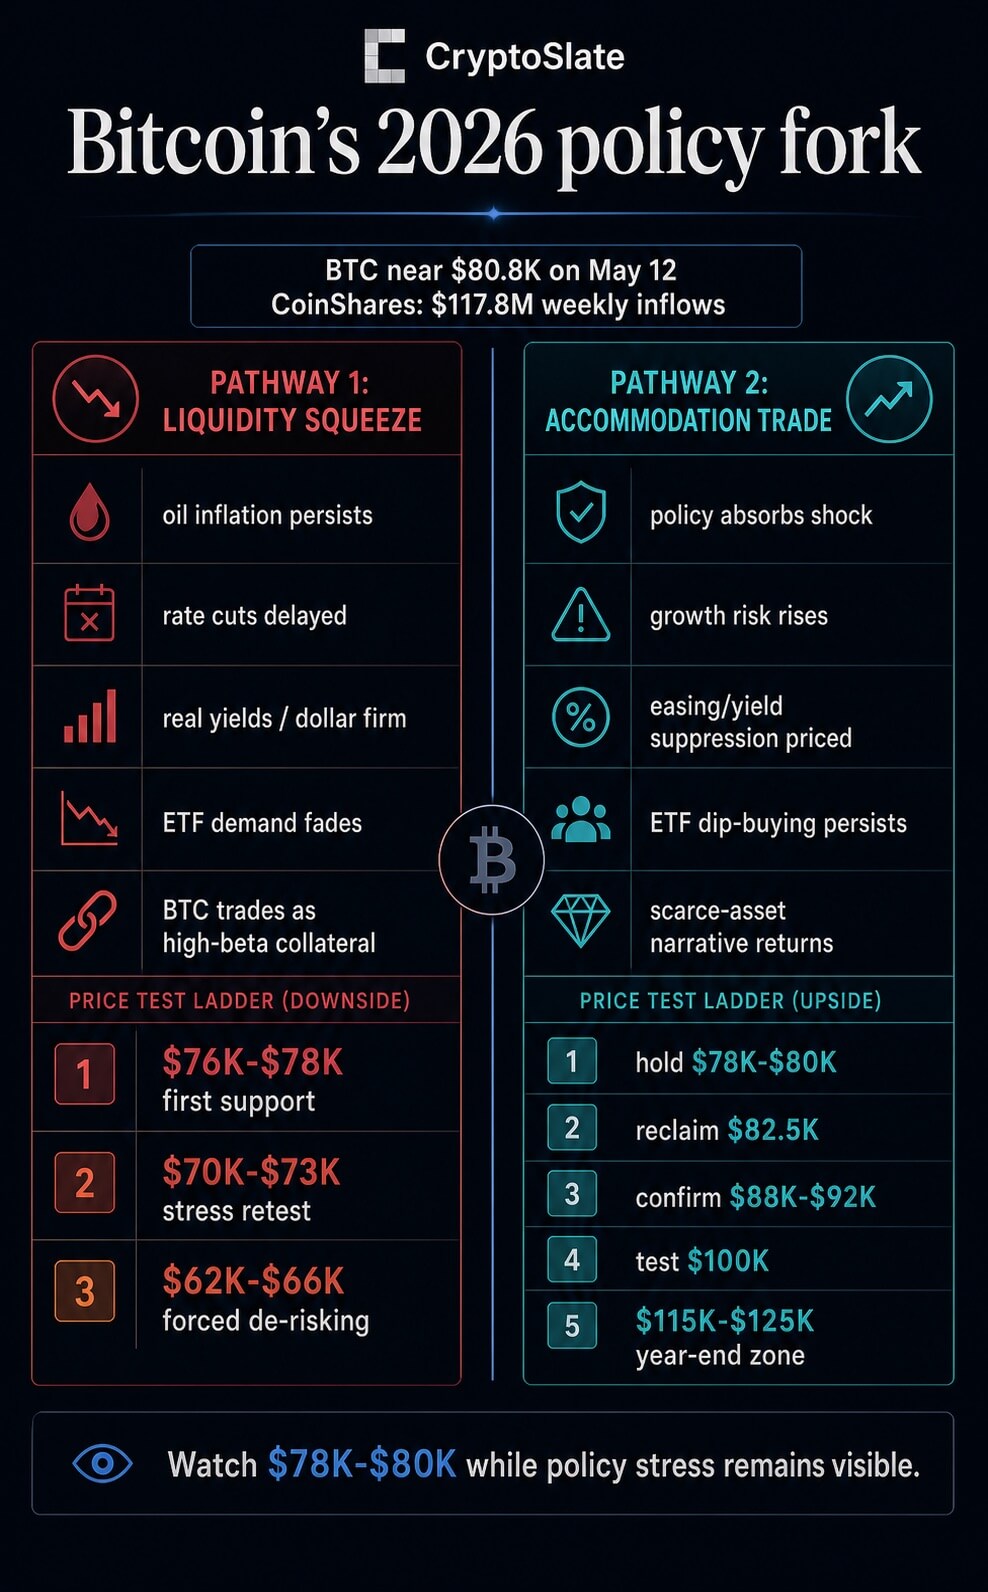
For Bitcoin, the issue is whether markets treat the oil shock as a force that keeps inflation sticky and financial conditions tight, or as a shock severe enough to pull governments and central banks toward more support.
That fork leaves Bitcoin with two defensible pathways into year-end: a stagflation-driven liquidity squeeze that pushes it back into high-beta collateral behavior, or a policy-accommodation trade that lets it reclaim its scarce-asset narrative.
The policy response is already visible. IEA members agreed to release 400 million barrels from emergency stocks, the largest coordinated release in the agency’s history.
The U.S. Department of Energy said the White House authorized 172 million barrels from the Strategic Petroleum Reserve, with delivery expected to take about 120 days at planned discharge rates.
Supply additions elsewhere do not change the scale problem. Eight OPEC+ members agreed to add 206 thousand b/d in April, a move that may matter at the margin but sits far below the disruption estimates now embedded in EIA’s outlook.
The more important signal is the spread of emergency policy.
Sri Lanka has introduced QR-based fuel rationing, Korea has odd-even driving restrictions and fuel-price measures, India has LPG and fuel controls, Pakistan has remote-work and public-transport steps, Japan has a subsidy-backed fuel-price cap, Germany has fuel-tax and pricing rules, China has refined-oil price controls, and the UK has heating-oil and industrial support.
The IEA’s separate demand-side report lays out options such as remote work, lower speed limits, public transport, car-access limits, LPG prioritization, and reduced air travel.
Those measures matter for Bitcoin because they shift the oil story from a market-clearing problem to a policy reaction function.
Once governments are cutting taxes, capping prices, rationing fuel, releasing reserves, or subsidizing exposed sectors, the macro signal becomes less clean.
Bitcoin is close enough to the key zone that this macro classification matters immediately. CryptoSlate’s market page showed Bitcoin around $80,794 on May 12, with the broader crypto market near $2.69 trillion and BTC dominance around 60%.
Further, ETF inflows, geopolitical risk, U.S. macro data, Fed signals, and oil stress continue to shape sentiment.
Flows still give the upside case something to work with, but they are not an all-clear signal.
The latest fund-flow report showed $117 million of digital-asset product inflows, a fifth consecutive positive week. Bitcoin products attracted $192 million, while Ethereum products saw $81.6 million of outflows.
The same report noted that four days of outflows were reversed by one strong Friday session, so the flow picture looks resilient but fragile.
That is why the $78,000 to $80,000 area is more than a trading level in this setup. Recent CryptoSlate coverage has tied that band to Bitcoin’s struggle around the Fed, oil-driven inflation pressure, and on-chain supply levels.
If Bitcoin holds it while energy-policy stress stays visible, markets can argue that ETF demand and scarcity narratives are absorbing the macro shock. If it loses the area, the oil shock starts to look less like a debasement trade and more like a real-yield problem.
Two paths now define Bitcoin’s 2026 map
The downside pathway starts with EIA’s oil forecast becoming the macro base case rather than a temporary stress scenario.
Brent at a 2Q26 average of $115, a 5.1 million b/d inventory draw, and multi-million-barrel-per-day shut-ins would keep energy in the inflation conversation even if reserve releases ease the first hit.
Governments can soften the pain with subsidies, tax relief, price caps, direct sector aid, and fuel rules. Those measures can also preserve demand, add fiscal cost, and make it harder for central banks to treat the shock as a clean one-off.
In that version of the year, rate cuts are delayed, real yields stay firm, the dollar remains hard to fight, and Bitcoin trades less like digital scarcity and more like collateral in a risk book.
ETF demand is the transmission channel to watch. CoinShares’ Bitcoin inflow number shows that the bid has not disappeared, but the midweek outflows show how quickly macro caution can drain participation.
If energy inflation keeps Fed expectations tight and ETF flows fade or reverse, Bitcoin does not need a crypto-specific failure to move lower. It only needs the macro backdrop to force de-risking.
Under that pathway, failure to hold $78,000 to $80,000 would make $76,000 to $78,000 the first risk-control zone.
A deeper macro-stress retest would put $70,000 to $73,000 in view. If forced selling and ETF redemptions intensify, the $62,000 to $66,000 area becomes the wider stress band.
These are not stand-alone technical targets; they are the price expression of a market deciding that oil policy is tightening liquidity rather than creating it.
The upside pathway classifies the policy response differently.
In this version, governments absorb enough of the energy shock that growth risk starts to matter more than near-term inflation. Reserve releases, price caps, targeted aid, fuel-tax relief, and demand-reduction measures become a bridge between the shock and eventual policy accommodation.
Markets do not need central banks to ease immediately for that trade to begin. They need real yields to soften, the dollar to stop acting as a wrecking ball, and investors to believe the policy system is moving from inflation restraint toward growth protection.
That is when Bitcoin’s scarce-asset story can return, especially if ETF demand keeps appearing on dips.
The latest CoinShares report does not prove that this path has won, but it keeps it alive. Bitcoin attracted more inflows than the total digital-asset product universe because Ethereum outflows and thinner participation offset BTC demand elsewhere.
That divergence matters. It suggests investors are still willing to isolate Bitcoin as the macro vehicle even when broader crypto participation is uneven.
The confirmation ladder is clear. Bitcoin first has to keep $78,000 to $80,000 intact. It then needs to reclaim roughly $82,500, build acceptance through $88,000 to $92,000, and test $100,000.
A move toward $115,000 to $125,000 into year-end requires more than a chart breakout. It would require continued ETF accumulation, softer real-yield pressure, and policy signals that turn energy relief into a broader liquidity expectation.
That is the mirror image of the downside case. The same subsidies, tax cuts, reserve releases, and conservation measures that can keep inflation sticky can also become the first sign that policymakers will not allow the shock to crush demand.
Bitcoin rises if markets decide that policy support is bigger than the inflation drag.
The test is policy, then price
Bitcoin does not need the oil market to return to normal before it can move higher. It needs markets to decide what the policy response means.
If policy keeps consumers spending while energy remains expensive, central banks have less room to ease and Bitcoin remains vulnerable to the high-beta path.
If policy absorbs enough pain to shift the conversation toward growth support, liquidity, and currency debasement, Bitcoin has a route back into the scarce-asset trade.
The live test is therefore simple but demanding. Bitcoin must keep the $78,000 to $80,000 area while oil stress stays visible in government action.
Holding that zone and reclaiming $82,500 would strengthen the accommodation pathway. Losing it would point back to the stagflation squeeze, where oil policy tightens the financial conditions Bitcoin needs to escape.
Business activity picked up in April, but Americans are paying more for almost everything, and most say things are only getting worse.
The U.S. composite PMI is at 52.0 this month, a three-month high that suggests a slight recovery following a sluggish March, according to new data from S&P Global.
However, the average price of goods and services increased at its quickest rate since July 2022, a signal that should concern both consumers and legislators.
However, economists advise being cautious. Much of that growth came not from people actually buying more, but from companies rushing to stock up before prices climb further or supply chains buckle.
Surveys were filled with phrases like “panic buying” and “emergency buying,” language that points to fear, not confidence.
Services told a quieter story. The services PMI edged up to 51.3, but that is still the second-lowest reading of the past year. New orders barely grew.
Businesses and households across tourism, financial services, and other sectors are holding back spending. People are waiting to see what happens next, weighed down by geopolitical tensions and stretched budgets.
Supply chains under pressure
Supply chains are showing real strain. Delays from factory suppliers in April were the worst since August 2022.
Shipping difficulties related to continuing hostilities overseas account for a portion of that.
A portion of it stems from businesses purchasing excess inventory just to be safe, which further restricts supply and drives up costs.
The report’s pricing information is uncomfortable to read. Inflation in manufacturing products reached a ten-month high. The service sector’s price rises hit a 45-month high.
Input costs rose at their fastest rate in 11 months. Taken together, the inflation picture is getting harder to dismiss.
Regular Americans are feeling it. A new Fox poll found that 70% of respondents believe the economy is getting worse, up sharply from 55% a year ago.
Only 26% said conditions have improved. The pessimism cuts across party lines. Even among Republicans, 56% described the state of the economy as bad.
The consumer price index rose 3.3% in March, slightly above the level when he took office.
Roughly one in four Americans approves of how he is handling the cost of living. One major driver of that frustration is energy costs, pushed higher by the ongoing conflict with Iran.
That conflict is also shaping what comes next for the broader economy.
The prospect of gasoline hitting $5 a gallon is now a real concern for both the White House and the Federal Reserve.
For the Fed, the situation is getting harder to navigate.
Chris Williamson, chief business economist at S&P Global, said that if inflation keeps moving in the direction the PMI data suggests, it becomes much harder for the central bank to make a case for cutting interest rates.
The gap between what the numbers show and what people feel is hard to ignore. A manufacturing PMI of 54.0 normally signals solid growth.
However, rather than being motivated by actual customer demand, this reading is being driven by defensive actions taken by businesses to create buffers against uncertainty.
There might not be enough actual demand to sustain the trend when stockpiling eventually decreases.
For the time being, the Fed is torn between an economy that appears to be doing well and inflation that is being driven up more by fear than by growth.
Any discussion of rate cuts will remain firmly on hold until that changes.
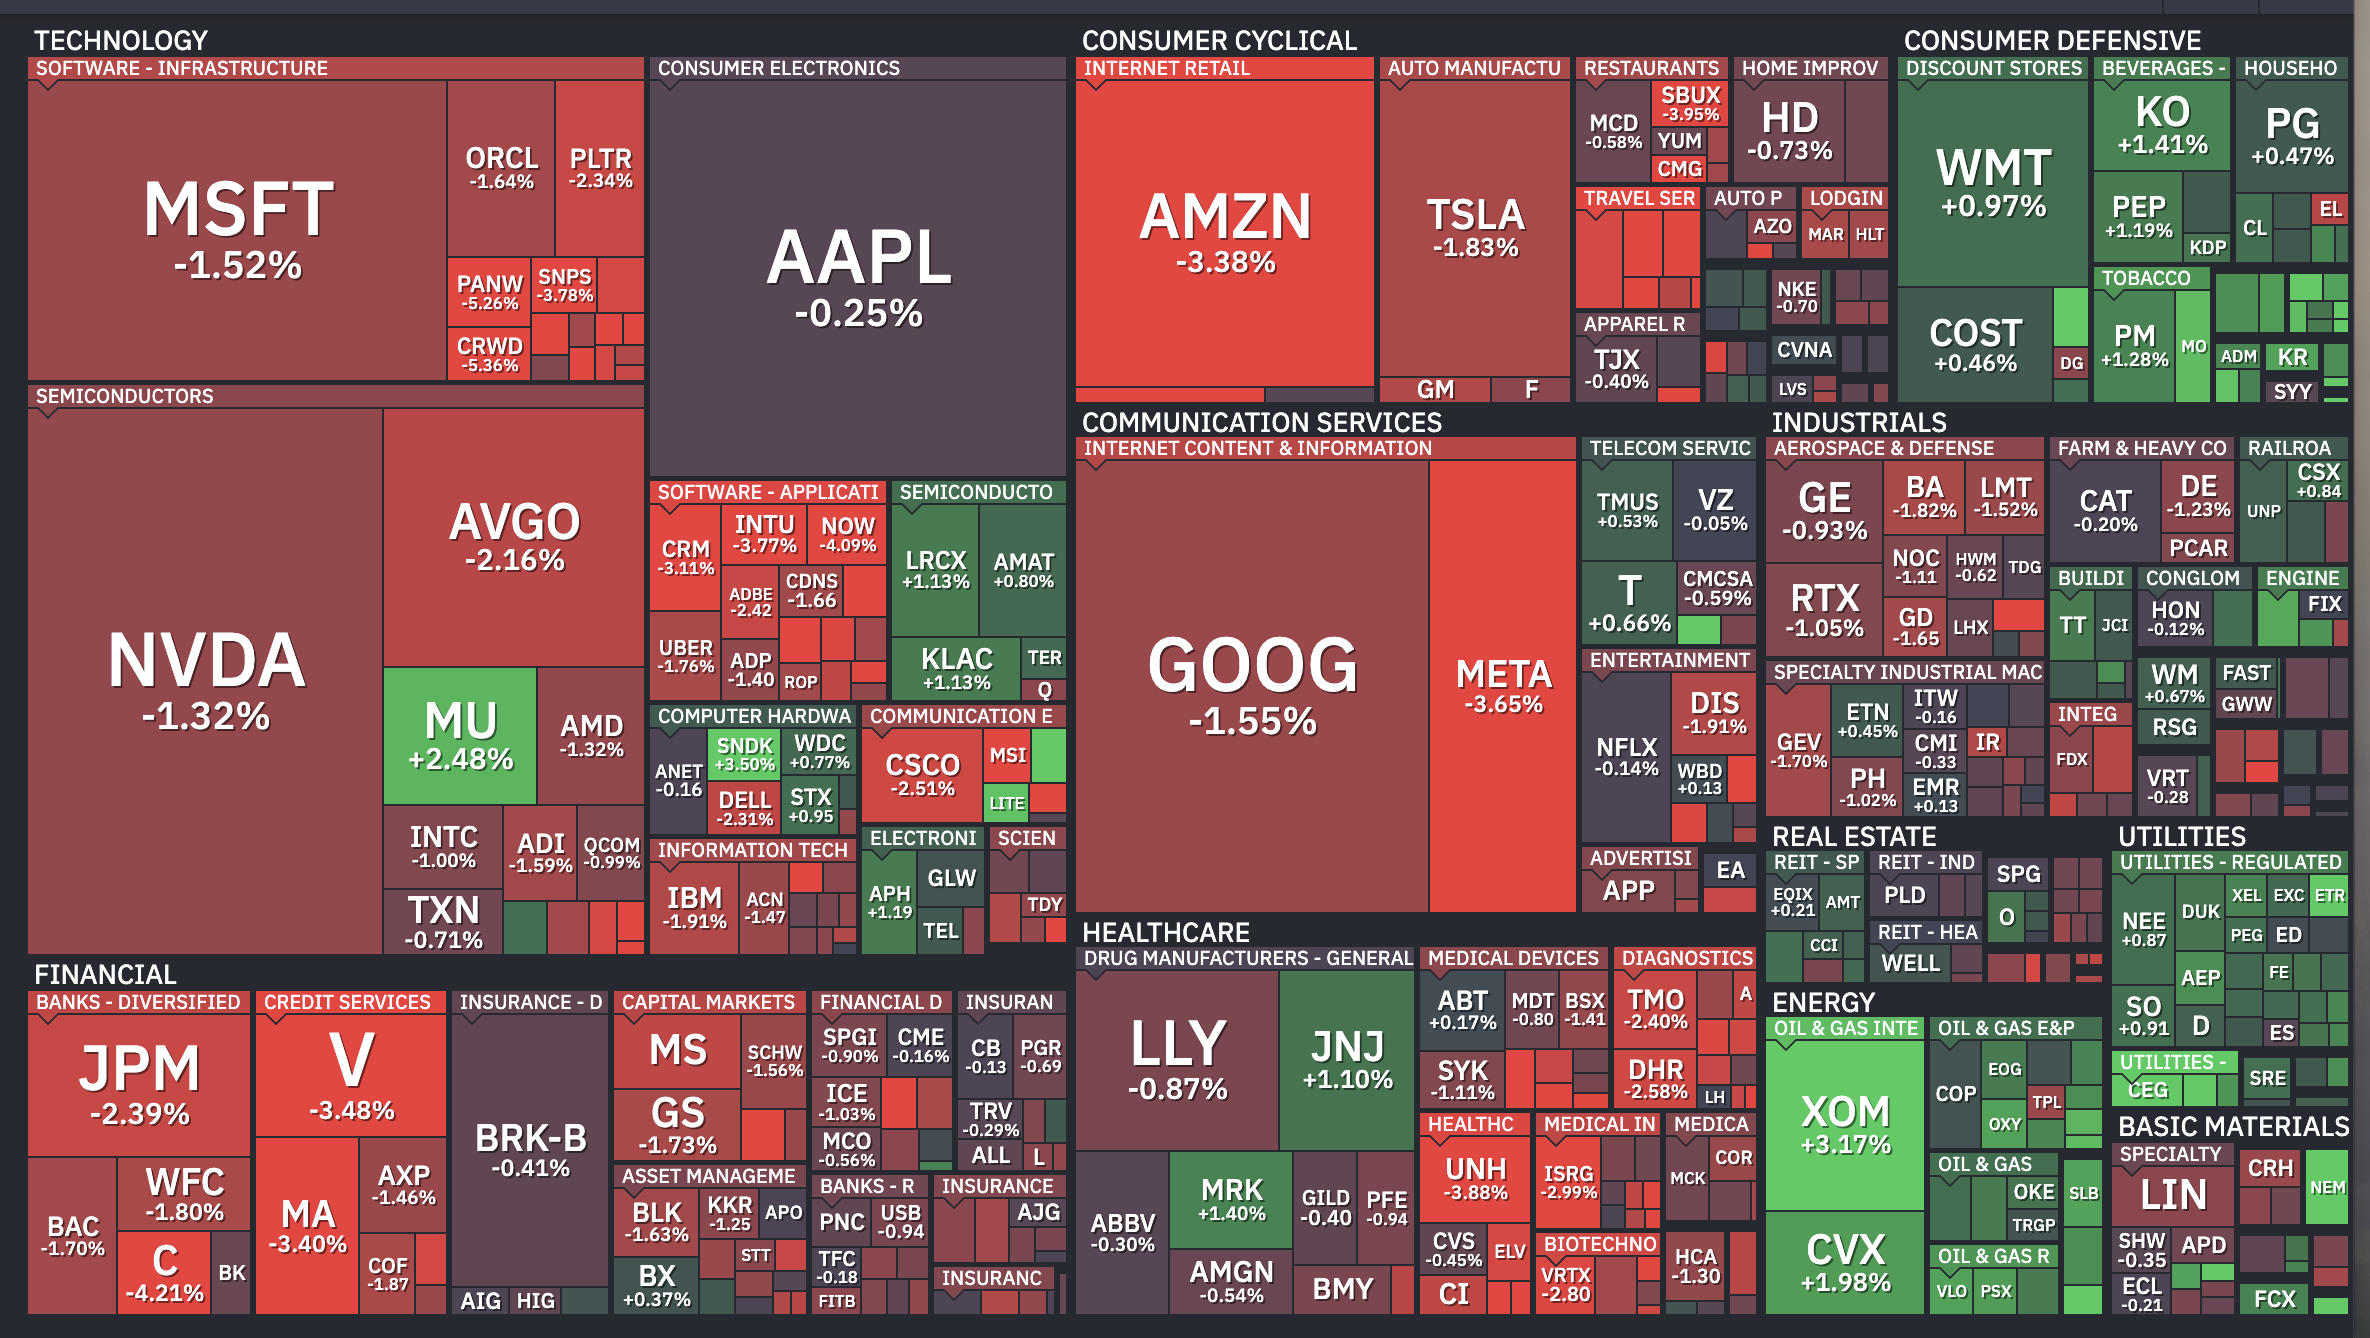
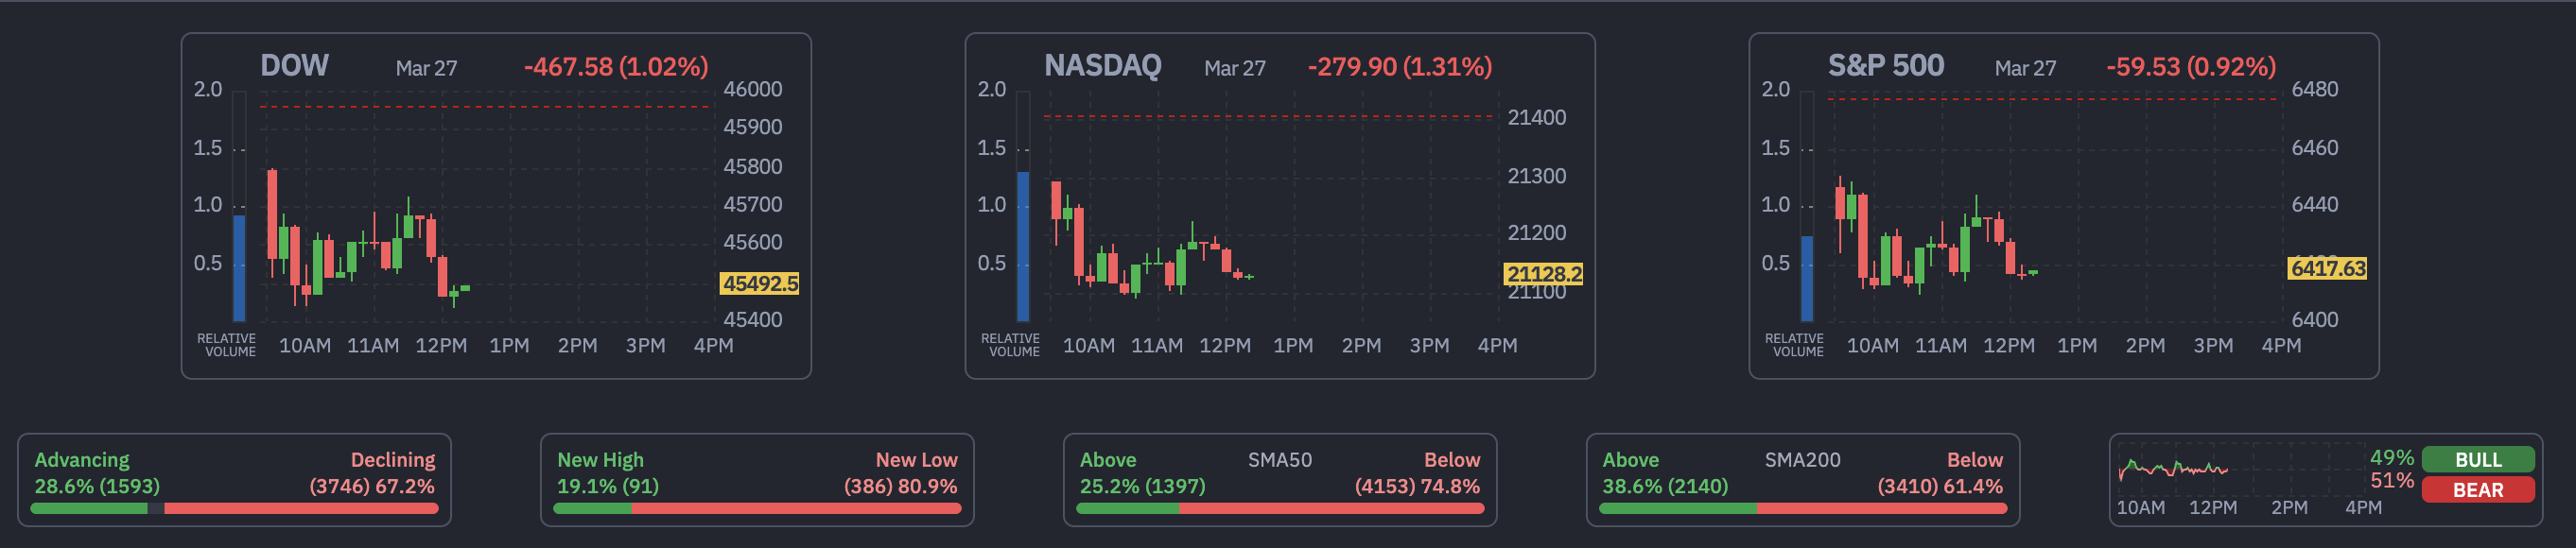
The US stock market fell on Friday as rate hike expectations crossed the 50% threshold for the first time, bond yields hit new highs, and the Iran war showed no signs of de-escalation. The S&P 500 dropped 0.92%, heading for its fifth straight weekly decline.
Three forces drove the selling on Friday, all connected to the same root cause. Oil (Brent Crude) above $100 is feeding into inflation, forcing the Fed’s hand and crushing bonds and equities simultaneously.
1. Rate Hike Odds Cross 51% as Fed Cuts Vanish Until December 2027
The CME FedWatch Tool now shows no expected rate cuts until December 2027 and a 51% probability of a rate hike by March 2027. Surging oil prices are feeding into inflation expectations, forcing the Fed into a corner where easing becomes impossible. Higher rates compress earnings multiples and make risk assets less attractive.
BREAKING: The US Federal Reserve is now no longer expected to cut interest rates until December 2027.
There is now a 51% chance of an interest rate HIKE by March 2027.
The 10-year Treasury yield climbed to 4.48%, its highest since the conflict began.
We believe this weekend is a crucial pivot point in the Iran War:
As the bond market continues to get crushed, the 10Y Note Yield just hit a new high of 4.48%. For the first time since the Iran War began, the bond market is nearing or already in “crisis” territory.
When yields rise this sharply, it pressures growth stock valuations and competes with equities for capital. The US Dollar Index (DXY) is gaining strength, squeezing multinational earnings as foreign revenue translates into fewer dollars back home.
With over 40% of S&P 500 revenue coming from overseas, the stronger dollar is pressuring the broader index.
Meanwhile, capital has rotated into gold above $4,400 and silver, reflecting a flight into hard stores of value.
3. Iran Rejects Direct Talks, Brent Holds Above $104
Iranian Foreign Minister Abbas Araghchi said exchanges through mediators do not constitute “negotiations with the United States.” Brent crude held above $104, keeping the geopolitical risk premium intact.
Oil above $100 functions as a tax on consumers and businesses, raising input costs and squeezing discretionary spending.
What Is Happening to Major US Indexes?
At press time, all three major indexes are in the red.
S&P 500: down 59.53 points (−0.92%) at 6,417 (stronger dollar hitting several players)
Dow Jones Industrial Average: down 467.58 points (−1.02%) at 45,492
Nasdaq Composite: down 279.90 points (−1.31%) at 21,128
Market breadth is overwhelmingly negative, with 3,746 stocks declining versus 1,593 advancing.
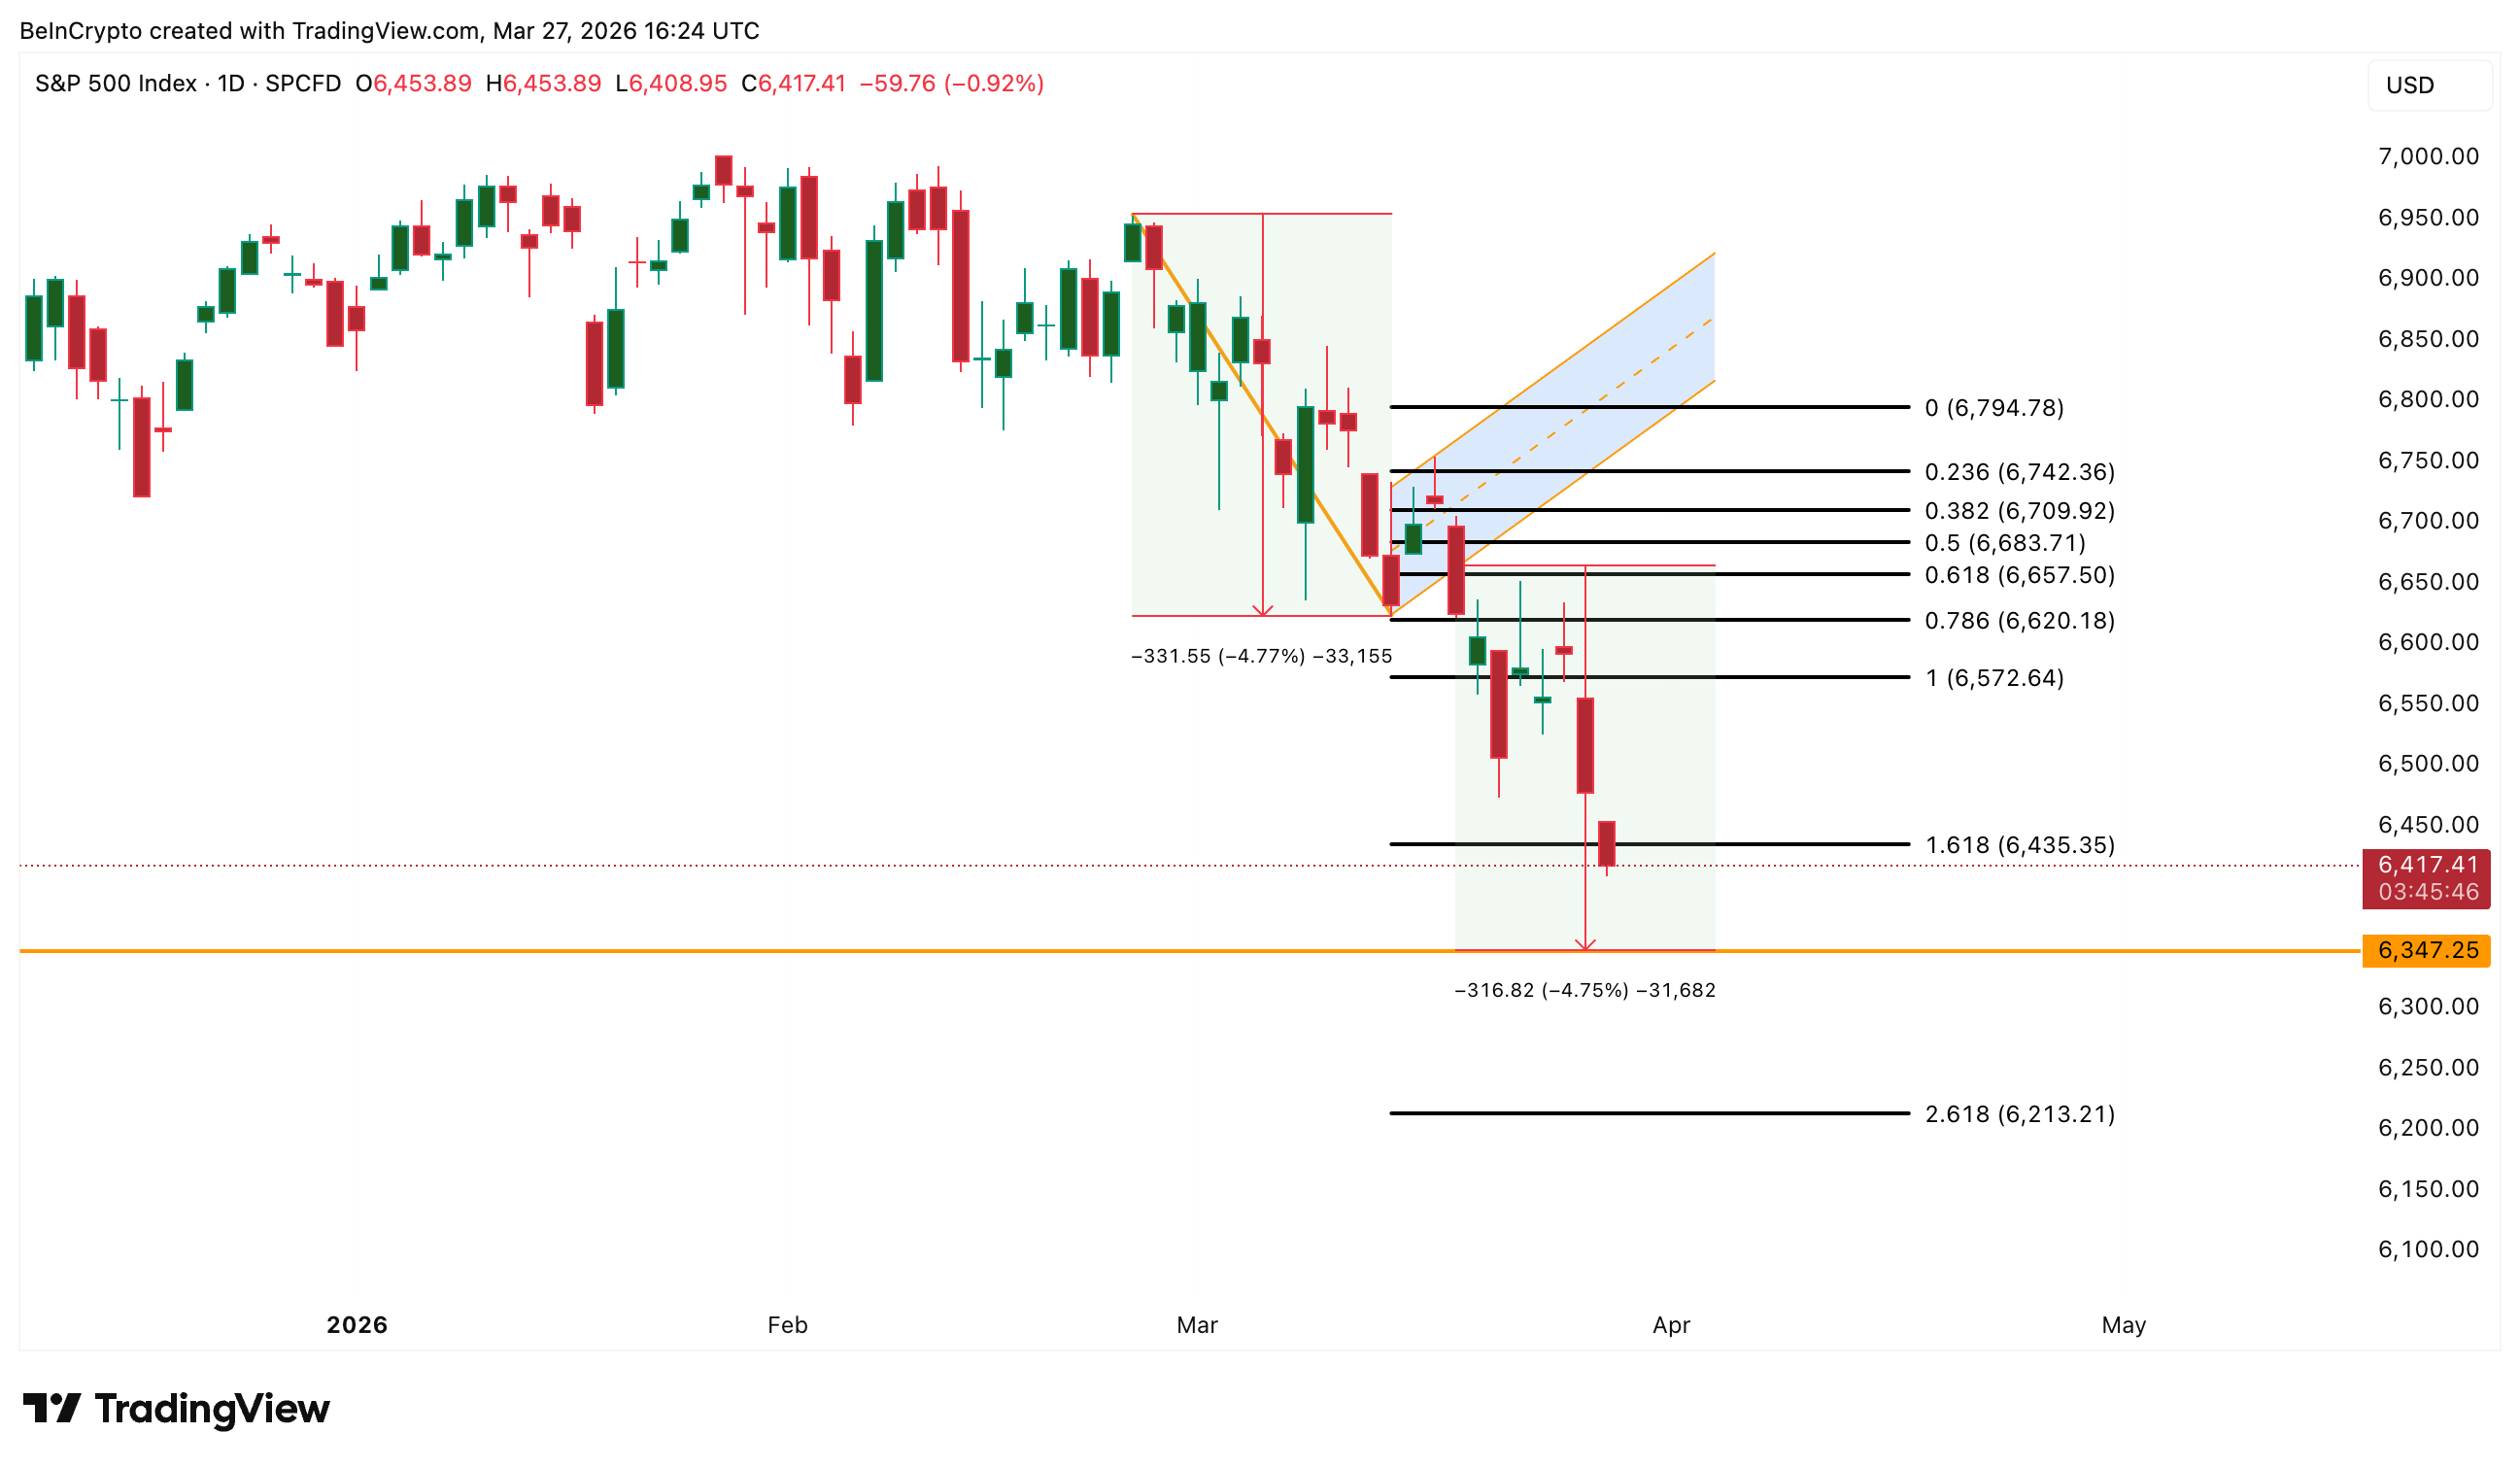
The S&P 500 continues its decline after breaking down from a bear flag pattern. The breakdown started on March 18 and has already delivered a 3.8% correction. The measured move target sits at 6,347.
If the index fails to reclaim 6,435, the factors above could push it toward 6,347 and even 6,213.
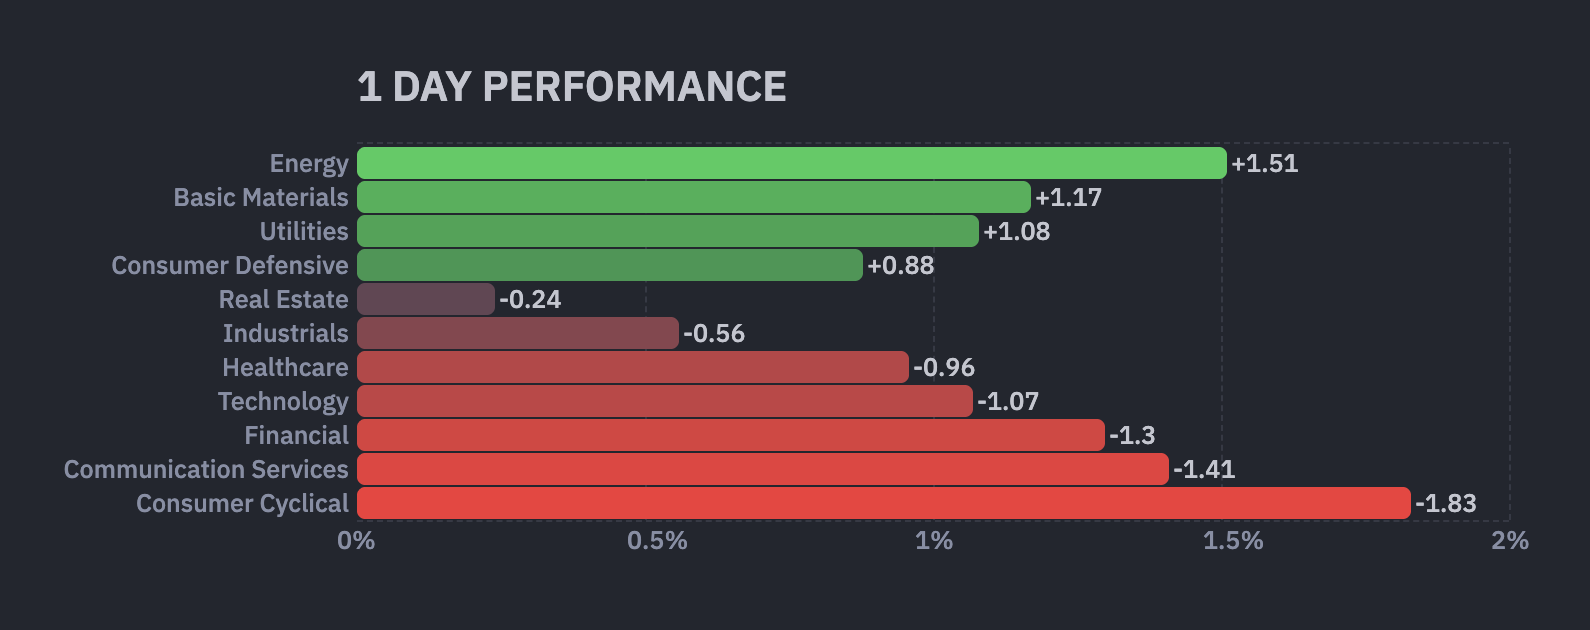
Which Sectors Are Holding Up?
Energy led with a 1.51% gain as Brent stayed above $104. Exxon Mobil (XOM) gained 3.17% at press time, and Chevron (CVX) rose 1.98% as elevated oil prices directly increased producer revenue.
Basic Materials added 1.17% on rotation into commodities. With gold above $4,400 and silver strengthening, mining stocks attracted capital as an inflation and geopolitical hedge.
Utilities gained 1.08% as defensive positioning continued. Risk aversion is overriding the traditional rate sensitivity of the sector, making yield-paying defensives attractive as a parking spot for nervous capital.
Which Sectors Are Falling?
Consumer Cyclical led losses at -1.83%. Oil above $100 acts as a direct tax on spending power. Amazon (AMZN) fell 3.38%, and Tesla (TSLA) dropped 1.83%.
Communication Services lost 1.41% as Meta (META) fell 3.65%. Ad-dependent businesses suffer early in slowdowns because advertising budgets are among the first expenses companies cut. Financials declined 1.30 as the speed of the yield surge, combined with recession fears, creates credit risk concerns that outweigh the margin benefit.
Technology lost 1.07% as the Nasdaq entered correction territory and higher bond yields crushed growth stock valuations.
Major Stock News Investors Are Watching
Unity Software (U) surged 10% after preliminary Q1 revenue of $505 million to $508 million crushed guidance. The company also plans to sell its China division for over $1 billion, streamlining around its AI-powered Vector advertising platform.
Unity Software sharply higher premarket after raising its Q1 revenue guidance above consensus. The company sunsetting its ironSource Ads Network. $U 19.42, +2.29, +13.4% pic.twitter.com/sbVLYl9ka3
CrowdStrike (CRWD) fell 7% after FY27 guidance landed below expectations while AI-powered rivals intensified competitive pressure in cybersecurity.
$CRWD -7%, $PANW -7.2%, $NET -3.75%, $ZS -7.6%, $OKTA -6.7% … [Cybersecurity stocks including CrowdStrike, Palo Alto Networks, Cloudflare, Zscaler, and Okta are falling after Anthropic accidentally leaked details of its new powerful AI model with strong cyber capabilities.]… pic.twitter.com/IZH2vWuL0l
Iran’s counter-proposal to President Trump’s 15-point peace plan is expected today. If the proposal shows willingness to negotiate, oil could retreat and pull equities higher by Monday’s open.
TRUMP AND TOP WHITE HOUSE OFFICIALS HAVE BEEN TOLD THAT IRAN’S COUNTER-PROPOSAL WOULD LIKELY ARRIVE FRIDAY VIA INTERLOCUTORS -SOURCE
If it amounts to another rejection, yields could push above 4.50% next week, and the S&P 500’s 6,347 target comes firmly into play. The weekend could be the most consequential 48 hours for markets since the conflict began.
The ECB is refusing to blink. Even as Donald Trump threatens to slap a 30% tariff on imports and crank up global trade tensions, the European Central Bank decided Thursday it wouldn’t react just yet.
They’re locking rates at 2% and postponing any cut in borrowing costs. The move comes right before their seven-week summer break, with policymakers clearly choosing to wait and see if Trump’s threats actually turn into pain before they make a move.
The logic is simple: don’t rush. A lot of officials are about to disappear on holiday. They’d rather keep repeating that inflation is on target, park any panic until the next batch of economic projections is available for the September 10–11 meeting, and deal with it then.
That means no new action now, but no denial either that things are getting ugly. The euro’s getting stronger, which is hitting exporters and dragging down inflation forecasts. France’s messy budget problems are adding more heat at the worst time.
ECB watches data, ignores panic
Behind closed doors, the ECB knows the pressure is building. A rate cut in September is clearly back on the table, even if they keep hiding behind the usual “meeting-by-meeting” line.
President Christine Lagarde didn’t flinch in her statement Thursday, repeating that “risks to growth are tilted to the downside,” as flagged by Morgan Stanley economists in their preview titled Ready for the Beach. The coming week will pour in the data the ECB needs to weigh that risk.
On Tuesday, their own bank lending survey drops. Wednesday follows with a consumer confidence report, and Thursday will deliver purchasing manager indexes from all across the region, conveniently right before policymakers log off. Germany’s Ifo business confidence and Italy’s economic sentiment numbers wrap the week up on Friday.
Outside the euro area, more inflation data will fly in from Japan, Brazil, and others, while Bank of England chief Andrew Bailey will testify to UK lawmakers about financial stability.His appearance comes just as the UK drops public finance data on Tuesday and faces PMI figures and retail sales later in the week.
Global markets brace as central banks diverge
Over in the US, the economic calendar is light.A Wednesday housing report is expected to show barely any change in the sale of existing homes.
Numbers have been flatlined near a 4 million annualized rate, just slightly better than the 2010 post-crisis low. Thursday brings a report that might show a modest bounce in new home sales, after a brutal drop in June.But the truth is the US housing market is still locked in place.High mortgage rates and unaffordable prices are keeping buyers out.
Meanwhile, Canada’s economic mood gets measured through business and consumer surveys this week. They’ll give insight into inflation fears and investment trends. Retail sales data for May and June could also confirm that shoppers are retreating, especially after tariffs spiked car purchases earlier in the year.
In Asia, everyone’s scrambling to make sense of global trade chaos. South Korea opens the week with export data, followed by confidence and retail numbers. China will keep loan prime rates steady for the second straight month.
Over in Africa, South Africa will show June inflation is likely up to 3.1% from 2.8%, thanks to meat prices. In Nigeria, the central bank will likely keep rates frozen at 27.5%, for the third straight time, with inflation still hot at 22.2%.
In Latin America, Argentina releases its May GDP-proxy Monday. April saw a 1.9% monthly jump and 7.7% year-over-year, helped by President Javier Milei’s move to loosen currency controls tied to a $20 billion IMF deal. Analysts now expect Argentina’s second-quarter GDP to grow 8%, and third quarter by 4.2%, according to Bloomberg.
Mexico is under pressure too. The Tuesday GDP-proxy print will follow April’s surprise strength, and inflation eased in June, finally, and the central bank has hinted it may now slow its easing plans.
Brazil will close the week with its mid-month inflation report, likely down for a third straight time, driven by sky-high borrowing costs. But expectations for 2025 inflation are still above target.
Your crypto news deserves attention – KEY Difference Wire puts you on 250+ top sites