World Chain to Become First Production Layer-2 Blockchain to Deploy Streamed EIP-7928 Block Access Lists
Enables parallel block verification while blocks are still being built, targeting up to one gigagas per second throughput without increasing validator hardware requirements.
Date
August 5, 2026
|Mainnet Launch
August 17, 2026
|Source
World Chain / World Network
1 Gg/s
Target Throughput
200ms
Access List Stream Interval
First
Production L2 with EIP-7928
Austin, TX / World Chain Mainnet — World Chain today announced the launch of full block access lists, becoming the first production layer-2 blockchain network to stream EIP-7928 block access lists inside every flashblock. Rolling out on World Chain Mainnet on August 17, the feature is designed to address one of blockchain’s biggest scaling challenges: increasing transaction throughput without requiring validators to run increasingly powerful hardware.
As blockchain networks process more transactions, validators typically need more computing power to verify every block, creating a tradeoff between performance and decentralization. World Chain’s implementation enables validators to verify blocks in parallel while they are still being built, allowing the network to target throughput of up to one gigagas per second while keeping validator hardware requirements effectively unchanged.
Traditionally, validators must re-execute every transaction in a block sequentially before confirming its validity. Full block access lists instead provide a record of the blockchain state each transaction reads and writes, allowing independent transactions to be verified simultaneously across multiple CPU cores rather than one at a time.
World Chain extends the EIP-7928 specification by streaming access list data incrementally every 200 milliseconds through its flashblock architecture. Instead of waiting until an entire block has been produced, validators begin verifying transactions immediately as the block is assembled, reducing validation latency and spreading verification work throughout the block-building process.
Unlike Ethereum’s planned implementation of EIP-7928 as part of the future Glamsterdam upgrade, World Chain is deploying full block access lists today through a runtime flag rather than a hard fork. Client operators can upgrade ahead of the August 17 mainnet rollout without requiring a coordinated network-wide upgrade.
Internal benchmarking on World Chain test networks showed validation latency remained effectively stable even as throughput increased significantly, reaching up to one gigagas per second using standard cloud infrastructure. The results suggest that blockchain networks can increase throughput substantially without proportionally increasing the computing resources required to independently verify the chain.
The rollout represents the first production implementation of streamed EIP-7928 block access lists and contributes to Ethereum’s broader scaling roadmap. Beyond improving throughput, the implementation demonstrates an approach to scaling blockchain performance while preserving accessibility for independent validators — a key requirement for maintaining decentralized networks.
About World Chain
World Chain is a layer-2 network designed to make blockchain technology and its benefits accessible to everyone. Built with the OP Stack and integrated with the World protocol, World Chain is secured by Ethereum as an L2 and engineered for scalability as part of the Superchain ecosystem. World Chain is uniquely enabled by World ID’s proof of human and built around stablecoin finance, international remittances, commerce and more. Anyone can explore and use apps with real world utility on World Chain through compatible wallets, starting with World App.
About World Network
World is positioned to be the world’s largest network of real humans, creating the only solution that can sustain uniqueness and privacy at the scale of seven billion people. The project was originally conceived by Sam Altman, Max Novendstern, and Alex Blania with the mission of empowering humans in the age of AI. Find out more about World at world.org and on X @worldnetwork.
Ethereum is attempting to stabilize after recovering from its June lows, but the broader trend has yet to shift decisively in favor of the bulls. While the daily chart still reflects a bearish market structure beneath key moving averages, the 4-hour timeframe shows improving short-term momentum as price presses against key resistance levels.
Meanwhile, on-chain data continues to provide a constructive backdrop, with exchange balances falling to fresh cycle lows.
Ethereum Price Analysis: The Daily Chart
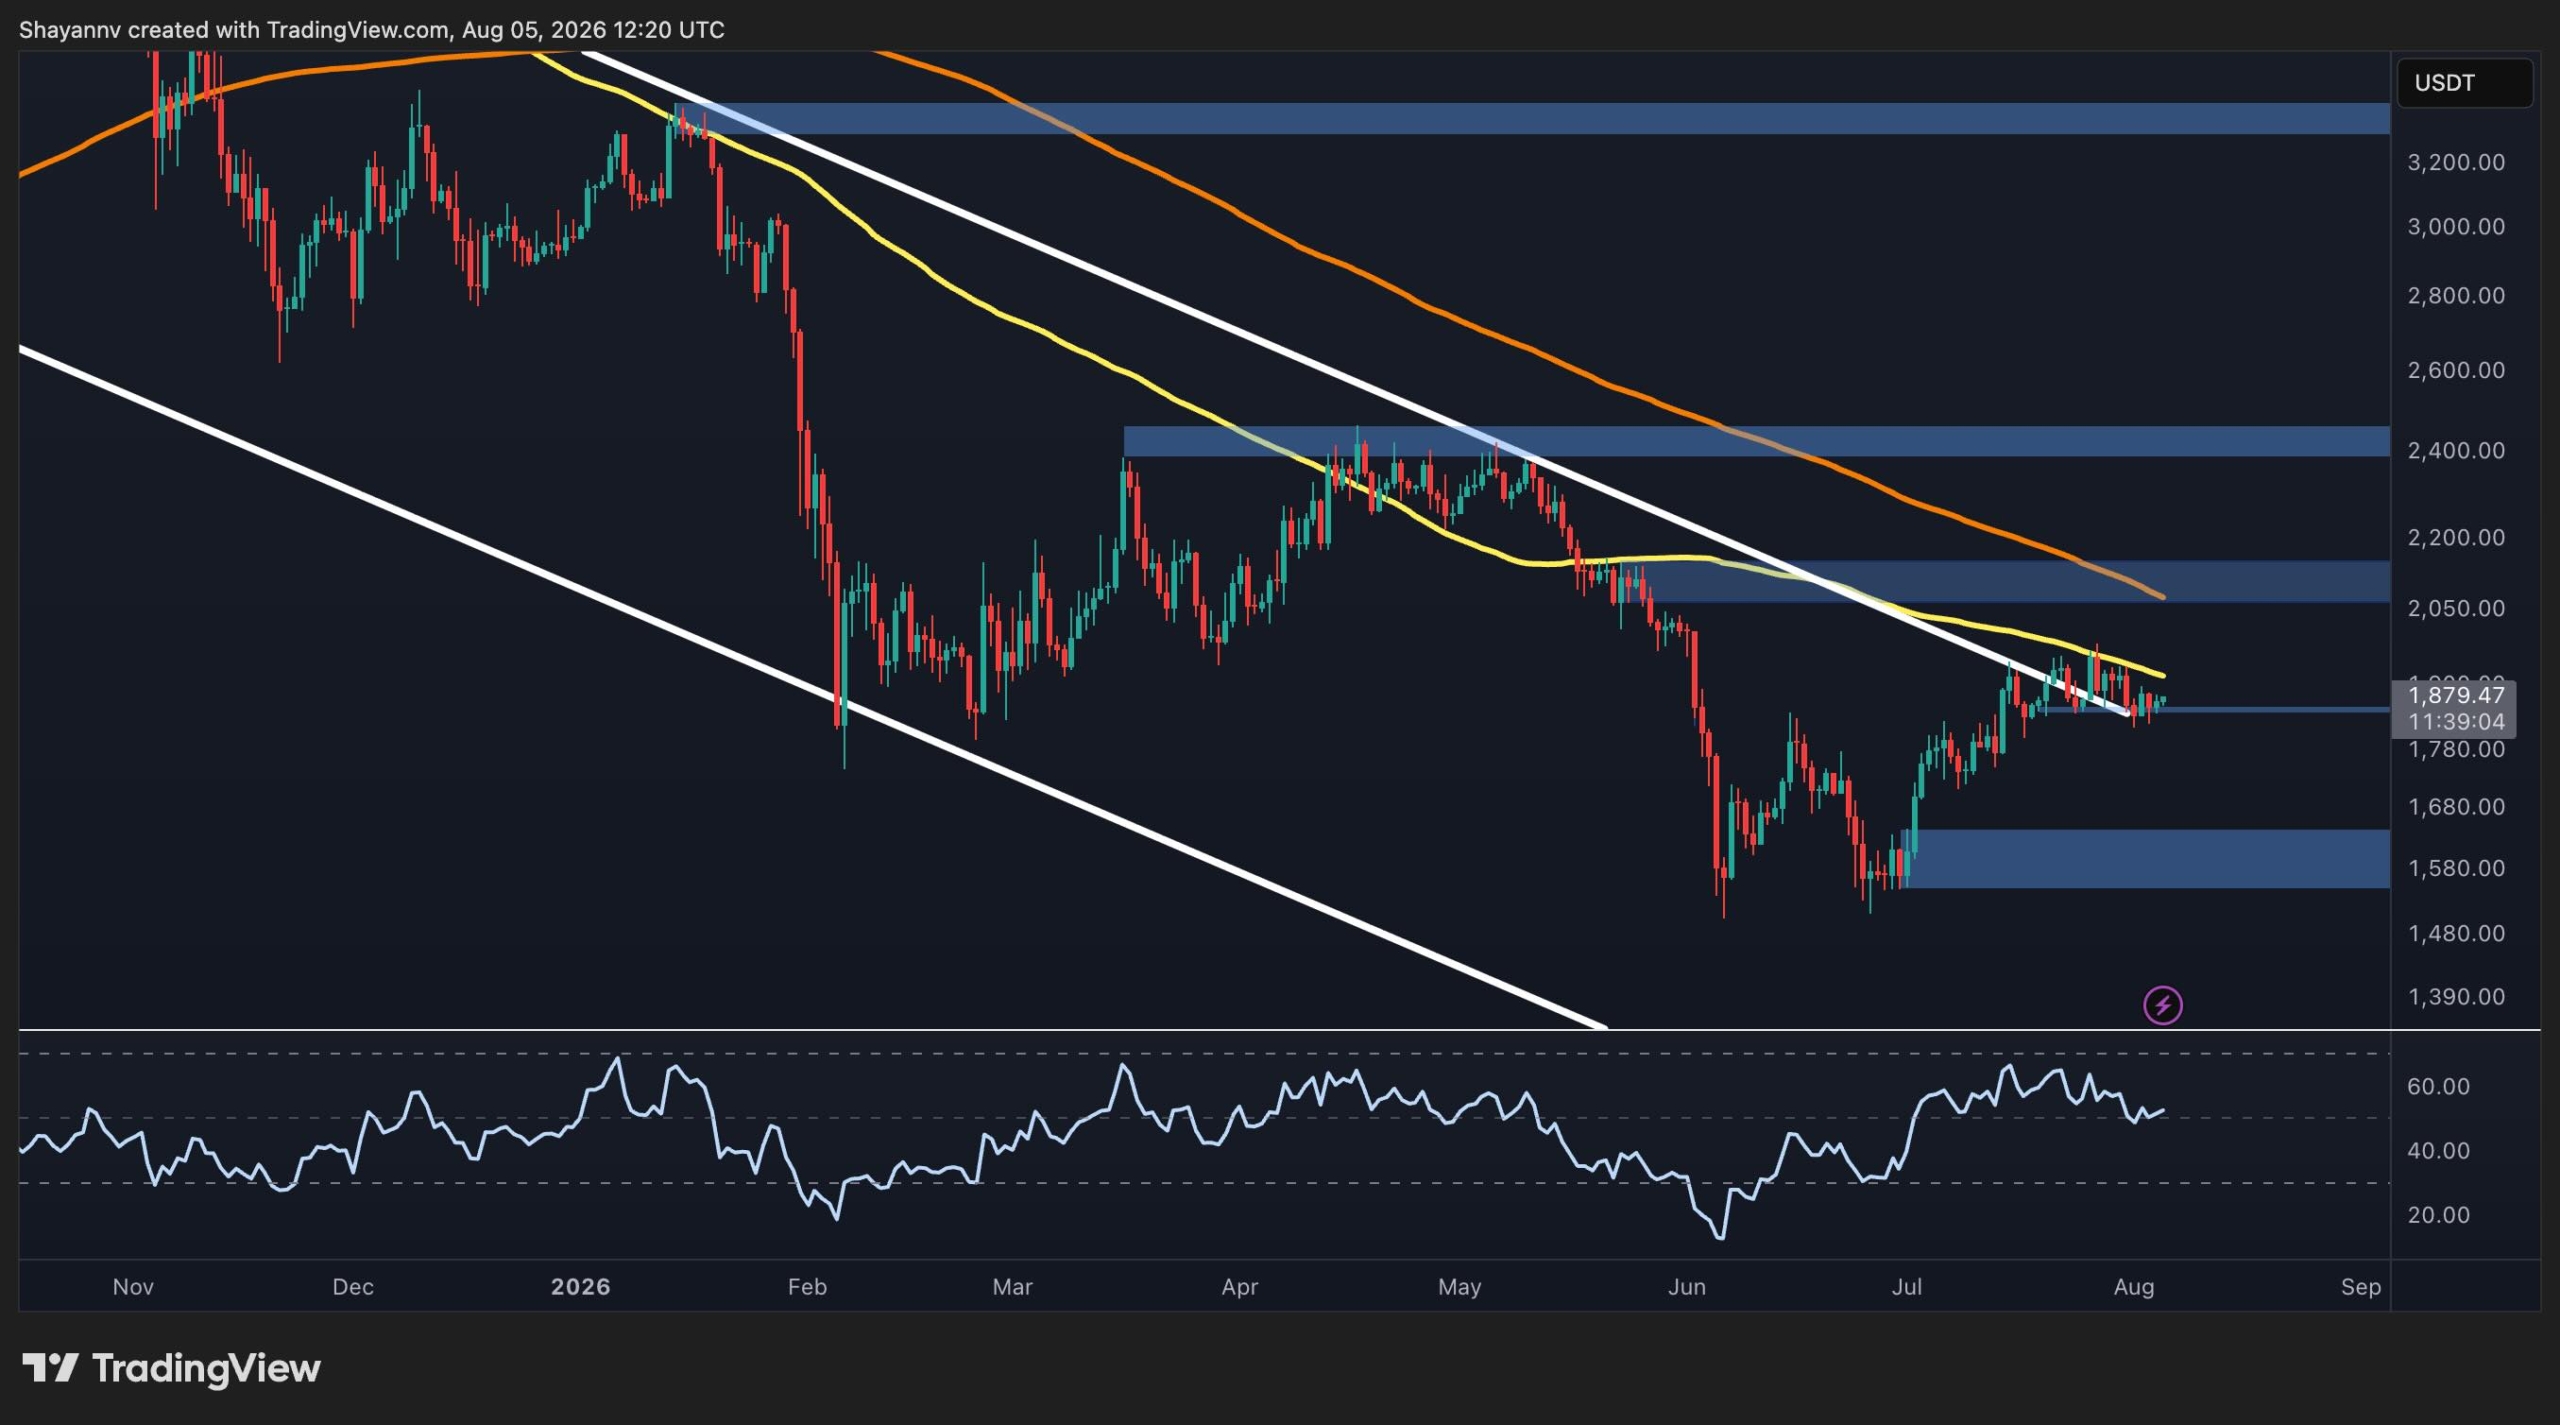
ETH is trading around $1.92K after rebounding from the $1.6K demand zone, where buyers stepped in aggressively following the sharp June selloff. The recovery has carried price back above a major confluence resistance formed by the long-term descending trendline and the 100-day moving average near $1.9K.
Despite the bounce, Ethereum remains below both the 100-day and 200-day moving averages, with the 200-day MA still trending lower near the $2.1K region. As long as the asset remains beneath these dynamic resistance levels, the broader market structure continues to favor sellers.
The first key resistance lies at $2.1K, where the mentioned 200-day moving average intersects with a major supply zone. A successful breakout above this cluster could expose the next resistance zone around $2.4K, which previously acted as a major distribution area.
On the downside, the immediate support is located around $1.85K, followed by the stronger demand zone at $1.6K. Losing the $1.85K area and dropping back inside the descending channel would invalidate the recent recovery attempt and likely reopen the path toward the $1.6K demand zone and potentially lower.
ETH/USDT 4-Hour Chart
The lower timeframe presents a more constructive picture. ETH has spent the past several sessions consolidating above the $1.85K support zone while gradually compressing beneath a descending trendline that has capped the price since the late-July high.
This structure resembles a short-term falling wedge or descending channel breakout attempt, with buyers repeatedly defending higher lows despite continued selling pressure from trendline resistance.
A decisive breakout above the descending trendline could trigger a move toward the psychological $2K level and the larger ascending channel’s upper boundary. Clearing those levels would strengthen the case for a continuation toward the daily resistance cluster near $2.2K and even $2.4K.
However, failure to break the trendline could lead to a breakdown of the $1.85K support, and if that zone gives way, ETH may revisit the broader demand area around $1.75K before buyers attempt another recovery.
On-Chain Analysis
The Exchange Supply Ratio continues to trend lower, reaching approximately 0.127, the lowest reading shown on the chart. This persistent decline indicates that a smaller proportion of Ethereum’s circulating supply is being held on centralized exchanges.
Historically, falling exchange balances suggest investors are moving coins into self-custody or long-term storage rather than preparing them for immediate sale. While this metric does not guarantee higher prices in the short term, it generally reflects declining spot sell-side pressure and improves the medium-term supply dynamics.
The combination of shrinking exchange reserves and ETH holding above a key support zone creates a constructive backdrop. Nevertheless, price confirmation remains essential. A sustained move above the descending trendline and the $2.2K resistance cluster would be needed to align the improving on-chain picture with a confirmed bullish technical reversal.
Mastercard and Borderless.xyz started testing Crypto Credential on Wednesday for cross-border stablecoin payment flows.
The pilot targets firms moving dollars on-chain that want to know who is on the other side of a transaction.
Infinia, Walapay, and Koywe test Crypto Credential
The trial runs over Borderless.xyz’s payments network. Firms that participate embed Crypto Credential’s assurance signals into their transaction approval, screening, and risk management process.
Infinia, Walapay, and Koywe are the first stablecoin payment operators to run assurance signals at network scale with a single-audit compliance model.
Raj Dhamodharan, Mastercard’s executive vice president for Blockchain and Digital Assets, said the tie-up grew out of Start Path, the company’s startup program.
“Today, we’re excited to take the next step together, exploring how Mastercard Crypto Credential can help bring greater trust and confidence to stablecoin payment flows across a growing network of participants,” he said. Infinia, Walapay, and Koywe are Start Path alumni, too.
Crypto Credential standardizes identity and compliance checks for wallet-to-wallet transactions. It uses shared assurance signals that let one party gauge whether a counterparty met the required standards.
Borderless.xyz operates a stablecoin orchestration and liquidity network, connecting wallet infrastructure to 15+ licensed stablecoin providers in 100+ countries, by its own account.
“One of the biggest friction points for stablecoin payment operators isn’t the payments. It’s that compliance doesn’t scale the same way the network does. Every new provider means starting the verification process over,” said Borderless.xyz CEO and co-founder Kevin Lehtiniitty.
He compared it to correspondent banking, where compliance done at the point of origin is trusted downstream, and reasoned that Mastercard is taking that approach to digital asset payments.
Pilot follows Mastercard’s $1.8 billion BVNK buy
Mastercard acquired BVNK for $1.8 billion, an initial $1.5 billion plus up to $300 million, subject to performance. The acquisition deal cleared regulators five months ahead of the year-end timeline Mastercard set when it announced the purchase on March 17.
BVNK, based in London, runs about $30 billion in annualized stablecoin volume across 130 markets. It holds 25+ regulatory licenses.
Mastercard started regulated settlement for stablecoins, including USDC, PYUSD, and RLUSD, in June. Cryptopolitan reported that the network would process card transactions across eight blockchains with six regulated stablecoins.
Mastercard kicked off a Crypto Partner Program in March with 85+ crypto-native companies, payment providers, and financial institutions for cross-border remittances, settlement, and payouts.
Don’t just read crypto news. Understand it. Subscribe to our newsletter. It’s free.
[PRESS RELEASE – Kingstown, Saint Vincent and the Grenadines, August 5th, 2026]
The former TON executive joins as Director of Strategic Partnerships to form the connections behind ChangeNOW’s next phase.
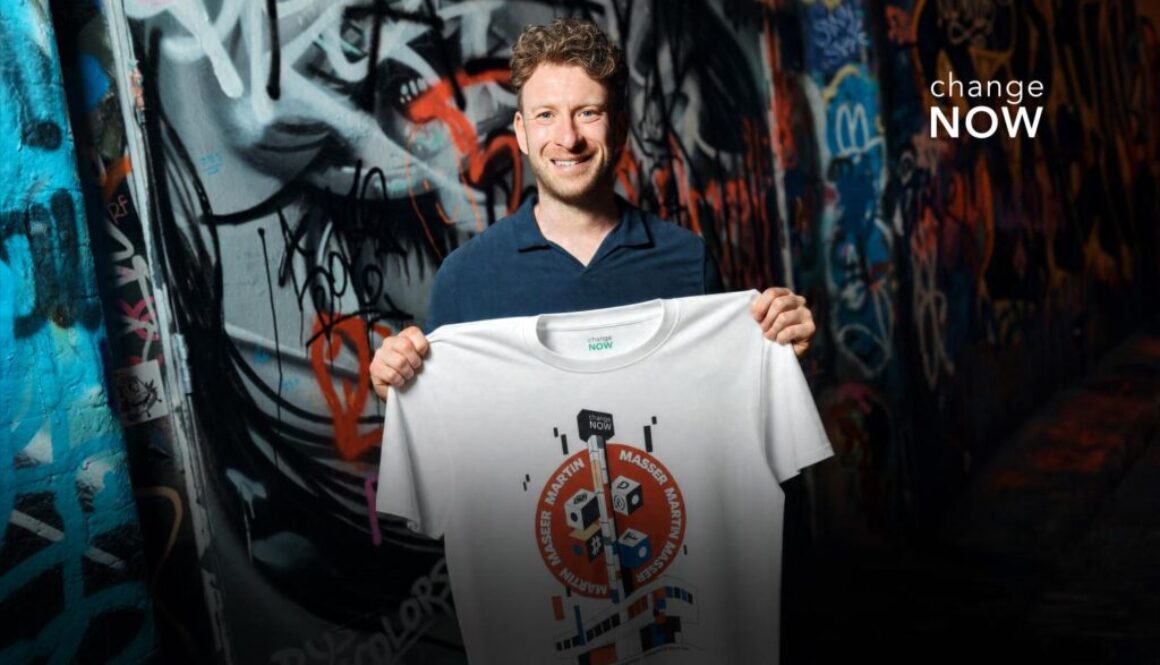
Former TON executive Martin Masser joins ChangeNOW to build strategic partnerships, ecosystem relationships, and media momentum behind its next phase.
Masser comes with experience across traditional banking, Web2 and Web3, including senior growth and business development roles within the TON space. At ChangeNOW, he will lead strategic relationships with blockchain networks, wallets, fintech companies, payment providers and other infrastructure partners.
His appointment comes as ChangeNOW grows beyond standalone crypto services, transitioning to one connected product where users can buy, store, swap, trade, send, receive and grow digital assets. The industry has already built most of the individual components. What it hasn’t solved is the experience of using them together; clients are still expected to switch between platforms, understand different networks and connect the pieces on their own. ChangeNOW’s super app strategy is designed to move that complexity beneath the product.
“Martin brings a rare mix of commercial relationships, product and media understanding,” said Pauline Shangett, Chief Strategy Officer at ChangeNOW. “He knows what the technology can do, what the business needs and how to make the market pay attention. That is exactly the perspective we need as we build the ChangeNOW super app.”
Masser’s role will focus not on accumulating partnership announcements, but on identifying relationships that can make ChangeNOW’s infrastructure more complete and remove unnecessary steps from the сlient experience.
“The best partnerships create access, adoption and attention. My focus is to build relationships that make the product stronger, simpler and more useful, and then help the market understand why they matter. If you are building wallets, networks, payments, stablecoins, fintech infrastructure, consumer crypto or Web3 products, I want to hear from you,” said Masser.
For consumers, ChangeNOW is combining the core activities of managing crypto within one environment. For businesses, it is developing an integrated set of tools for crypto payments, exchange, stablecoin settlement, digital asset management and Web3 integrations.
As ChangeNOW expands into a crypto super app, its next phase is connecting the right networks, wallets and partners. Masser’s role will be central to building those relationships and turning them into product value, adoption and market momentum.
About ChangeNOW
ChangeNOW.io is a crypto super app built for every crypto move, giving newcomers, professionals, and businesses the tools they need to access Web3 finance in a simple and secure way.
Since 2017, ChangeNOW has grown from a fast, secure, and limitless instant exchange into a trusted platform where storage, swaps, trading, staking, and asset management are covered in one simple experience for millions of clients worldwide.
About Martin Masser
Martin Masser is Director of Strategic Partnerships at ChangeNOW, where he is building partnerships around the company’s expansion into a crypto super app. His career covers traditional banking and capital markets in London and Web3, including his previous role as Head of Growth at TON Foundation. Martin works at the intersection of growth, infrastructure, and partnerships, connecting products and industry players to make crypto services work as one seamless user experience.
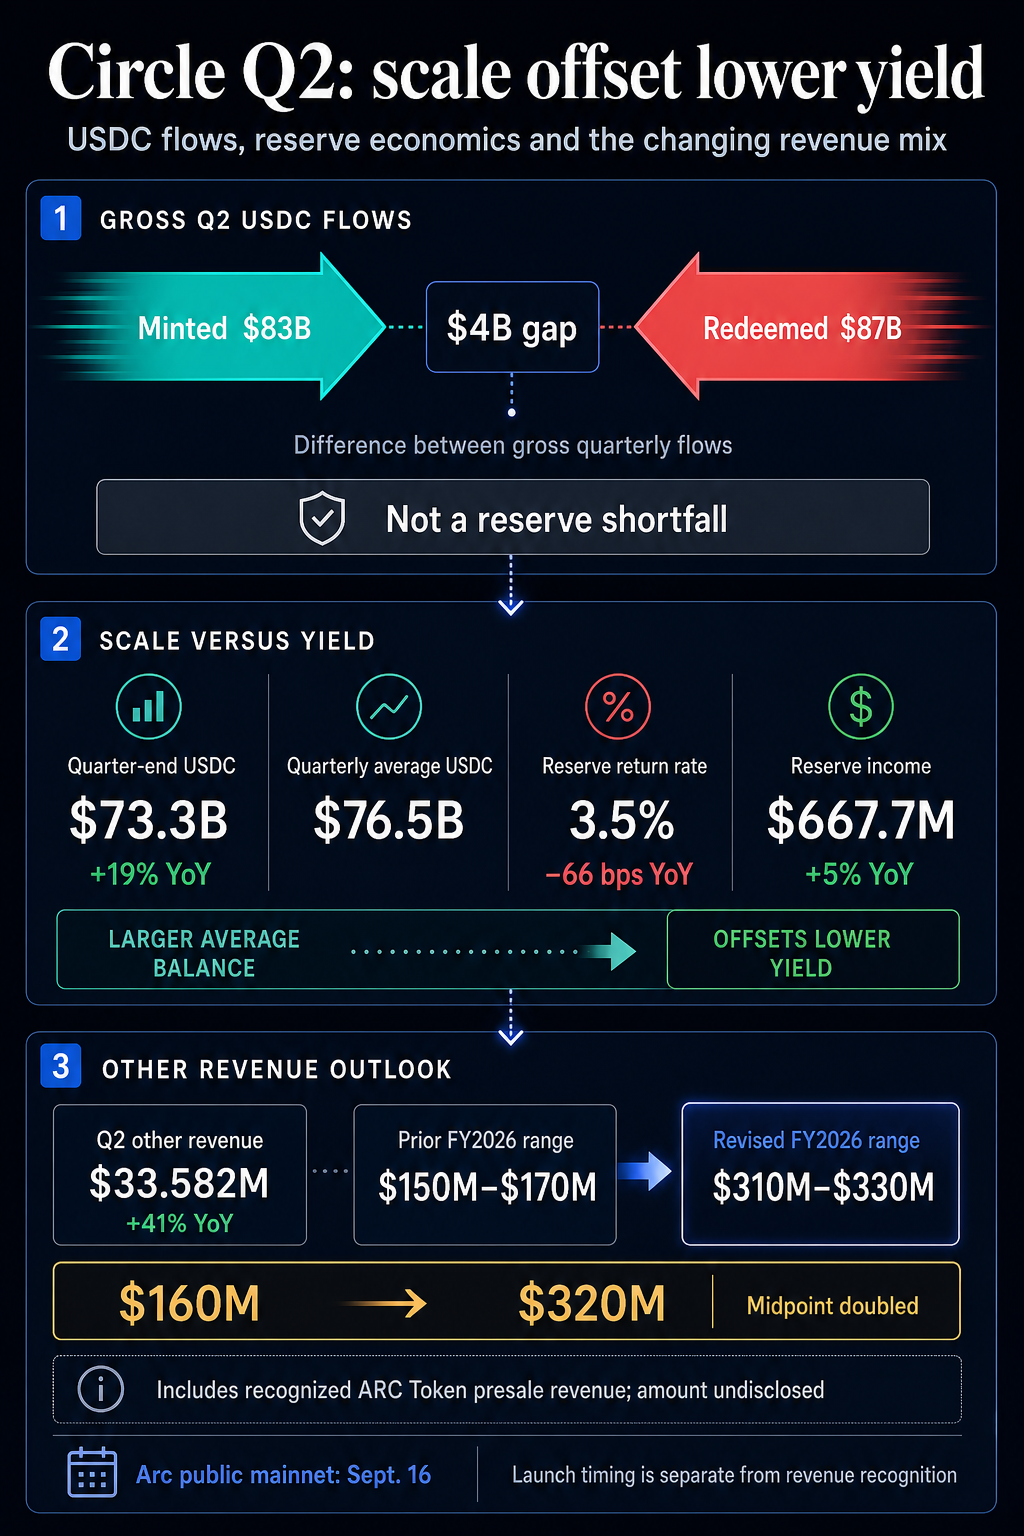
Circle’s reserve engine absorbed a tough second quarter. Gross USDC redemptions exceeded mints by about $4 billion, and reserve yield slipped, while a larger balance base kept reserve income growing.
Its biggest opportunity sits outside its reserves. Circle doubled the midpoint of its full-year other revenue outlook, which includes an undisclosed contribution from the ARC Token presale.
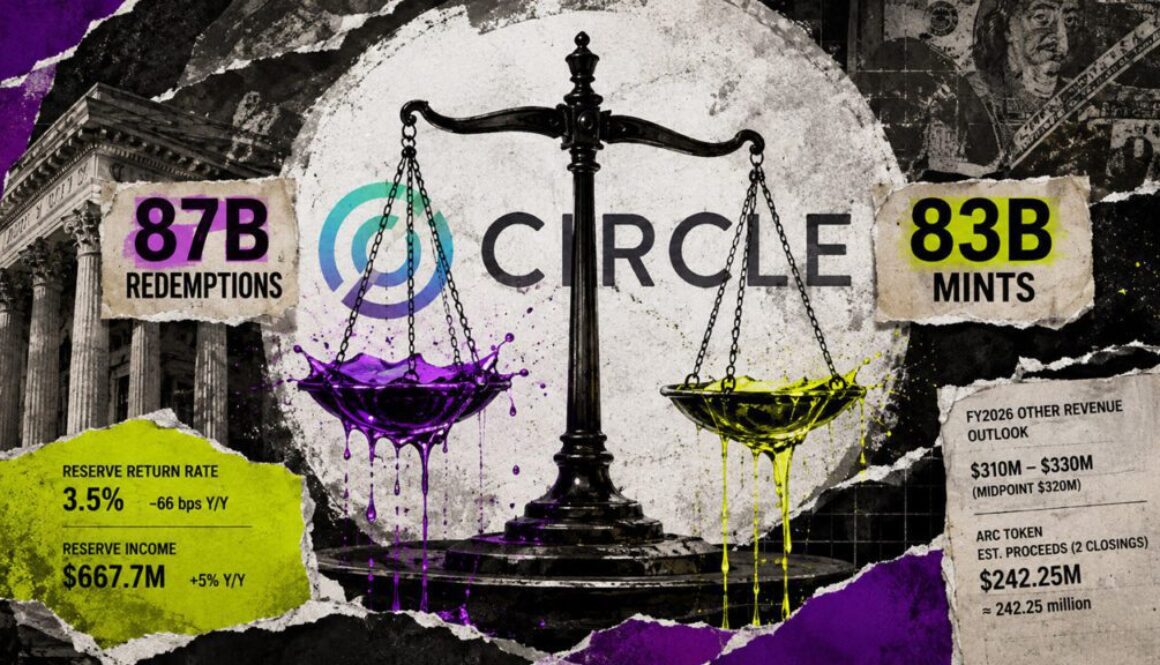
Circle’s Aug. 5 earnings release puts the gross flows at $87 billion redeemed and $83 billion minted. Those rounded figures produce the roughly $4 billion gap.
For Circle Mint customers, minting turns fiat into USDC, and redemption turns USDC back into fiat, according to Circle’s regulatory filing. The $4 billion difference describes customer flow activity, separate from reserve adequacy.
Quarter-end USDC circulation was $73.3 billion, against a $76.5 billion quarterly average. It remained 19% higher than a year earlier.
Circle’s reserve return rate fell 66 basis points year over year to 3.5%. The larger average USDC balance absorbed the rate hit, lifting reserve income 5% to $667.7 million.
The 66-basis-point drop is a year-over-year comparison. The Federal Reserve held its target range at 3.50% to 3.75% in both April and June. Circle’s 3.5% figure measures the return on its reserve portfolio.
Other revenue remained small beside reserve income, though it climbed 41% year over year to $33.582 million. Circle rounded that to $34 million and credited growth in subscription and services revenue.
The outlook changed much faster. Circle raised FY2026 other revenue guidance to $310 million to $330 million from the $150 million to $170 million range issued in May. The midpoint leaped from $160 million to $320 million.
The revised range includes recognized ARC Token presale revenue. Circle provided no breakdown for that contribution, leaving presale revenue mixed with the rest of the outlook.
Arc is Circle’s blockchain network. The company previously disclosed about $222 million in estimated gross proceeds from the initial ARC Token closing, plus another $20.25 million from a second closing. The two closings total about $242.25 million in estimated proceeds. That figure is different from recognized revenue, and the purchase agreements carry repayment rights under specified circumstances.
A $20 million options trade pays off only if SpaceX stock nearly triples by Friday. More than 450,000 contracts sit at a $330 strike before Tuesday’s earnings.
That price sits almost three times (3x) above where the stock trades now. Options analysts doubt small investors built the position, and point to a bank instead.
Who Is Behind the $20 Million SpaceX Options Trade
Space Exploration Technologies (SPCX) changed hands near $124 on Tuesday afternoon, up by over 8% on the day. The company priced its June 12 offering at $135, according to its prospectus filed with the Securities and Exchange Commission.
SpaceX has never traded anywhere near $330. Its record high is $225.64, and the median analyst target sits at $225. The strike clears both by about 46%.
The $330 line expiring August 7 holds at least seven times the open interest of the next busiest contract, CNBC reported. Those contracts control 45 million shares, worth roughly $14.8 billion if the stock ever reached the strike.
That is about 7% of a public float of only 639 million shares. Brent Kochuba founded options-flow platform SpotGamma. He said the buying pattern matches neither hedge funds nor market makers nor small investors.
“My guess is that banks own these calls as a hedge, maybe against some kind of structured product or some other short exposure they have.”
SpotGamma figures cited by CNBC put Monday’s buying at about 90,000 contracts for $2.2 million. Because the calls grew cheaper as the stock fell below its IPO price, the accumulated premium reaches near $20 million.
Open interest by strike for the SpaceX options chain expiring Aug. 7, showing a 450,000-contract spike at $330, Source: OptionCharts
What Traders Expect From SpaceX Stock After Earnings
SpaceX reports after Tuesday’s close, its first results since the June listing. Traders have already mapped the top earnings scenarios investors are weighing.
Contracts on the August 7 expiry price a swing of about $20.30, or 16.57%. That implies a band of $102.17 to $142.77. The strike sits 131% above the top of it.
CNBC put the earnings-specific move at 14%. Against a market value near $1.5 trillion, one print could move roughly $207 billion of shareholder value.
Implied volatility near 133 keeps even distant strikes liquid, according to ThinkOrSwim data cited by CNBC. Volatility usually cools once results clear.
Jay Pestrichelli is chief trading officer at Tidal Financial Group, which manages more than $60 billion across 420-plus exchange-traded funds. He argued the calls can turn profitable well before the strike, putting that zone near $215 by Wednesday morning.
“It’s not a speculative moon shot … you don’t buy the highest strike in the chain unless you’re trying to reduce the cost of a hedge.”
SpaceX options expected move chart for the Aug. 7 expiry, showing a $102.17 to $142.77 range against a $123.69 spot price, Source: OptionCharts
Even $215 would leave SpaceX short of its own record. Whether the $330 line was cheap insurance or a real directional trade should resolve by Friday. That lands one day after the float more than doubles.
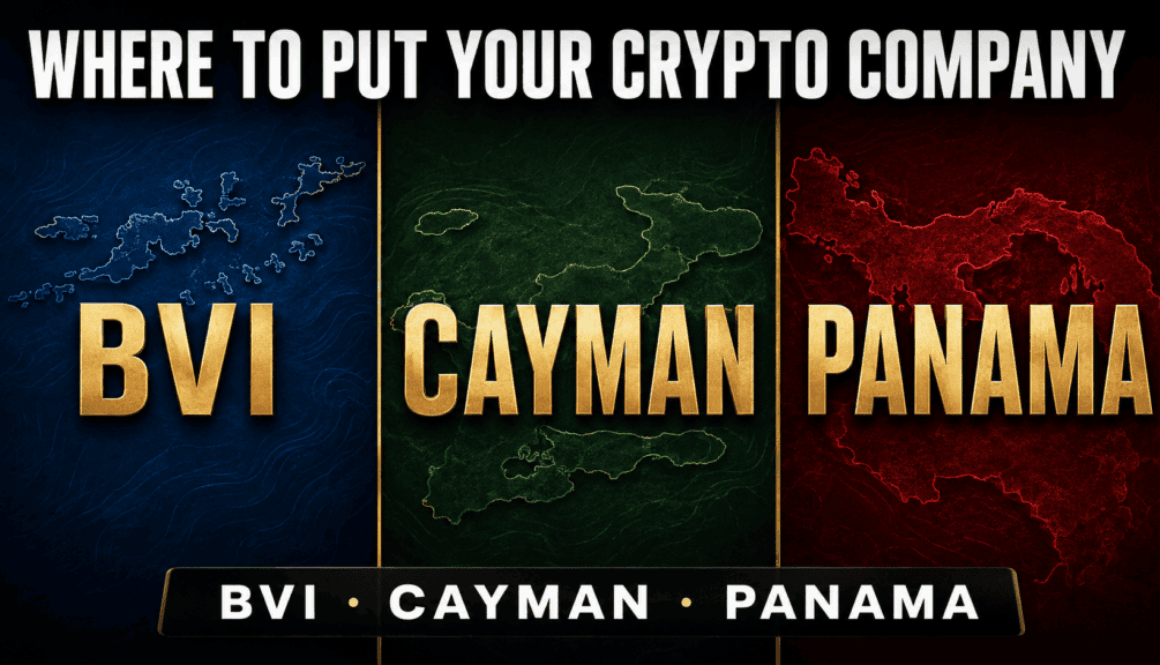
While founders debate the Clarity Act, crypto lawyer Dave Rodman has been using the same offshore structure since 2023 — and says it works whether Washington acts or not. Here’s exactly how it works.
By Ashton Addison·Crypto Coin Show — Blockchain Interviews·12 min read
Jurisdiction 01
British Virgin Islands
Token Issuance
The anchor jurisdiction for any project launching a token. The answer has been BVI for years — and still is.
Jurisdiction 02
Cayman Islands
Orphanization & Top Co
Home of the foundation company — an entity with no owners. The cleanest structure for true decentralization.
Jurisdiction 03
Panama
Operations & DeFi
Crypto is legal but unregulated. Anything the US would call “objectionable” has a home here — legally and cost-effectively.
The Interview
Most founders call a lawyer too late. Dave Rodman has seen it a thousand times.
Dave Rodman has spent his entire legal career in the spaces that scare other lawyers off — cannabis, psychedelics, venture capital, and for the last decade, crypto. As Founder and Managing Partner of The Rodman Law Group, he has facilitated over a billion dollars in digital asset transactions and watched the regulatory landscape twist in every direction imaginable. He sat down with Crypto Coin Show to talk about what actually matters for crypto founders right now — and it isn’t the Clarity Act.
“It certainly isn’t boring,” Rodman told us when asked about his career. “It’s been intellectually stimulating and wildly frustrating and rewarding all at the same time.” For a lawyer who chose his specialty long before big law firms had even assigned a practice group to the space, that tension has become familiar territory.
“Move fast and break stuff doesn’t work when the underlying product either is a financial instrument, functions like one, or looks like one.”
— Dave Rodman, Founder, The Rodman Law Group
The single most expensive mistake crypto founders make, according to Rodman, is waiting. Not waiting on legal counsel specifically — waiting on any structured thinking about compliance. The analogy he borrowed from our conversation: it’s like skipping the gym to save time, then paying for it in medical bills later. A lawyer on day one is an investment, not a cost.
Why the Clarity Act doesn’t change Rodman’s playbook
If you’ve been following crypto policy, you know the Clarity Act has been the marquee legislative promise of the current cycle — a framework that would finally resolve whether digital assets are securities or commodities, and who gets to regulate them. Rodman’s take? It won’t pass this year. And even if it does, it won’t matter as much as people think.
“There has never been an example where a thing is regulated by one agency until a nebulous point that no one understands, and then magically regulated by another,” he said. “I think both the SEC and CFTC are going to try to regulate that project at that moment — and there are going to be nasty results.”
The GENIUS Act passed, bringing some clarity to stablecoins. But Rodman points out it was gutted in a critical area: you can’t get yield-bearing stablecoins in the US. His clients’ response? Go offshore and get them permissionlessly anyway.
His broader thesis is more unsettling than any specific piece of legislation: the US is grasping at straws. A country in late-stage capitalism trying to maintain financial dominance over an industry whose entire value proposition is that borders don’t matter. He predicts a well-developed country in the global south — likely in Africa — will eventually take the position that tokens are not securities, allow programmatic revenue distribution, and leapfrog the entire regulatory tangle the way the African continent jumped from landlines directly to smartphones.
The three jurisdictions — and exactly how to use them
This is where the conversation gets practical. Rodman’s firm has refined its offshore structure since 2023, and uses the same three jurisdictions for nearly every client. The stack isn’t arbitrary — each jurisdiction does a specific job, and the combination was engineered to hold up across the scenarios crypto companies actually face.
BVI for token issuance. It’s always been BVI. The British Virgin Islands has the longest track record in the space for this use case, and nothing about the current landscape has changed that calculus. If you’re issuing a token, your issuing entity goes here.
Cayman for orphanization. The Cayman foundation company, introduced around 2020, was a structural breakthrough. It’s an entity with no owners — which makes it the ideal vehicle for decentralization. When you need a top-co that no individual can claim ownership of, Cayman is the answer. Rodman’s standard model: BVI token issuer, Cayman foundation on top.
Panama for everything else. This is the workhorse for operations — especially anything the US would classify as sensitive. Crypto in Panama is legal but unregulated, which gives founders something rare: a jurisdiction where you can operate legitimately while the rest of the world sorts out its rules. Rodman’s firm works with a sister firm on the ground there to produce legal opinions confirming each project is viable.
“If you’re going to have a social media company that needs a token — issue in BVI, orphanize with Cayman, run the social company in the US. It plugs in. And if Facebook wants to acquire you, you unplug the token and sell them a clean US company.”
— Dave Rodman
For founders who want a more regulated path and have the budget for it, Rodman also flagged Bermuda as an underrated option — a jurisdiction where startups can legitimately obtain a financial license, sit with regulators to agree on operating rules, build a compliance track record, and eventually transition to the US when the laws are ready. Rare that clients take him up on it, but the path exists.
Watch the Full Interview
AI agents, liability, and why “code is law” is still wrong
The conversation shifted to an area that’s getting more relevant by the month: AI agents operating autonomously in crypto — managing wallets, executing trades, running DAOs. Who is legally liable when one of them does something wrong?
Rodman’s answer is straightforward, if unsatisfying to founders hoping for a loophole: there are no special AI laws. The liability framework that applies is the same one that’s always applied. Did your product break? Did you disclose its limitations? What did your terms of service say? The existing reasonable-person standard, applied to whoever built the system and whoever deployed it, is the legal reality for now.
He’s also a practitioner of what he preaches. He told us he’s about a month away from having his first AI employee at the firm — built using the same tools available to anyone. If a lawyer can do it, he says, the developers in this space are inches from full agentic operation.
The compliance rule nobody’s talking about: CARF
Before wrapping, Rodman raised something that caught our attention — a framework most DeFi founders have never heard of, called CARF: the Crypto Asset Reporting Framework. It’s a worldwide compliance standard that most major countries have already signed, including the US, Panama, and Cayman. It requires DeFi protocols to report users’ gains and losses to tax agencies.
The mechanism of enforcement is still murky. How do you force a decentralized protocol to comply with a reporting requirement? Rodman doesn’t have a clean answer — nobody does. But the ticking clock is real: the US component takes effect in January. Some other jurisdictions come online in 2028. Projects who get caught in the first enforcement wave won’t be able to say they weren’t warned.
CARF in plain terms: most major countries — including the US, Panama, and Cayman — have signed a framework requiring DeFi protocols to report user gains and losses to tax agencies. America’s component kicks in this January. Most founders in the space have never heard of it.
His closing note on AI and legal risk was pointed: using Claude — his word — to ask whether something is legal is discoverable. If AI advice tells you something is illegal and you do it anyway, a prosecutor can use that. Attorney-client privilege cannot. It’s a distinction worth understanding before the next project launch.
The Rodman Law Group
Building in crypto and haven’t talked to a lawyer yet?
The Rodman Law Group works with crypto founders and Web3 companies on incorporation, token launches, offshore structuring, regulatory compliance, and everything in between. They serve clients across DeFi, DAOs, NFTs, and Web3 globally — and they operate in all three jurisdictions covered in this interview.
Ripple’s cross-border token has plunged by 5% over the past month to the current $1.07.
This is just above the crucial $1.06 zone, which, according to some analysts, can trigger the next decisive breakout.
Bulls vs. Bears
Ali Martinez believes that “everything comes down to $1.06 for XRP.” In his view, holding the line could open the door to a rally to $1.35 and even $1.64, whereas losing it might result in a potential slump to as low as $0.62.
X user ChartNerd has also stressed the importance of that level. The analyst noted that XRP found support at $1.06, but claimed there is heavy resistance remaining above the $1.08-$1.23 range and “prior ascending support was lost.”
“$1.16 remains the main roadblock ahead of the EMAs. Downward pressure remains until otherwise,” they added.
Shortly after, ChartNerd touched upon XRP’s bearish outlook amid the challenging times. They suggested that the asset may sweep even below $1 in the near future and that “would not be utterly surprising” given the market structure. At the same time, the analyst described such a potential downtrend as “another golden ticket entry in disguise.”
“The next few months are setting the stage for the next market repricing. Maybe the biggest yet,” they added.
Additional Forecasts
EGRAG CRYPTO and JAVON MARKS also gave their two cents. The former opined that XRP has lost the 50 MA and is approaching the 100 EMA, a zone that has historically provided strong long-term support.
The analyst labeled a possible retrace to the $1-$0.95 range as a “healthy macro retest while holding the 100 EMA.” They set $0.80 as “maximum downside” if XRP tumbles to the lower boundary of the long-term channel, but said the targets of $15, $27, and $50+ don’t shrink and rise in time.
As of now, it’s hard to imagine an explosion to even $15 since it will require the token’s market capitalization to skyrocket to nearly $1 trillion. But then again, no one really knows what the future holds.
JAVON MARKS was also bullish, albeit presenting a far more modest prediction than EGRAG CRYPTO. They claimed that XRP has shown a clear breakout of a key resistance trend and the price can respond by jumping beyond $3.50.
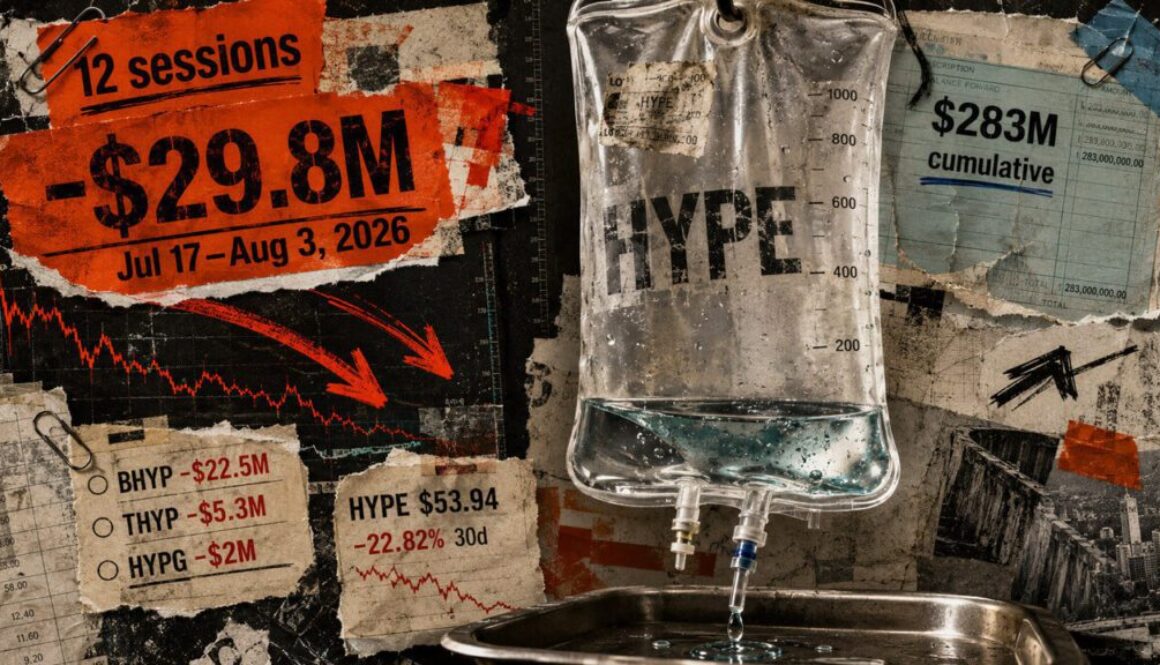
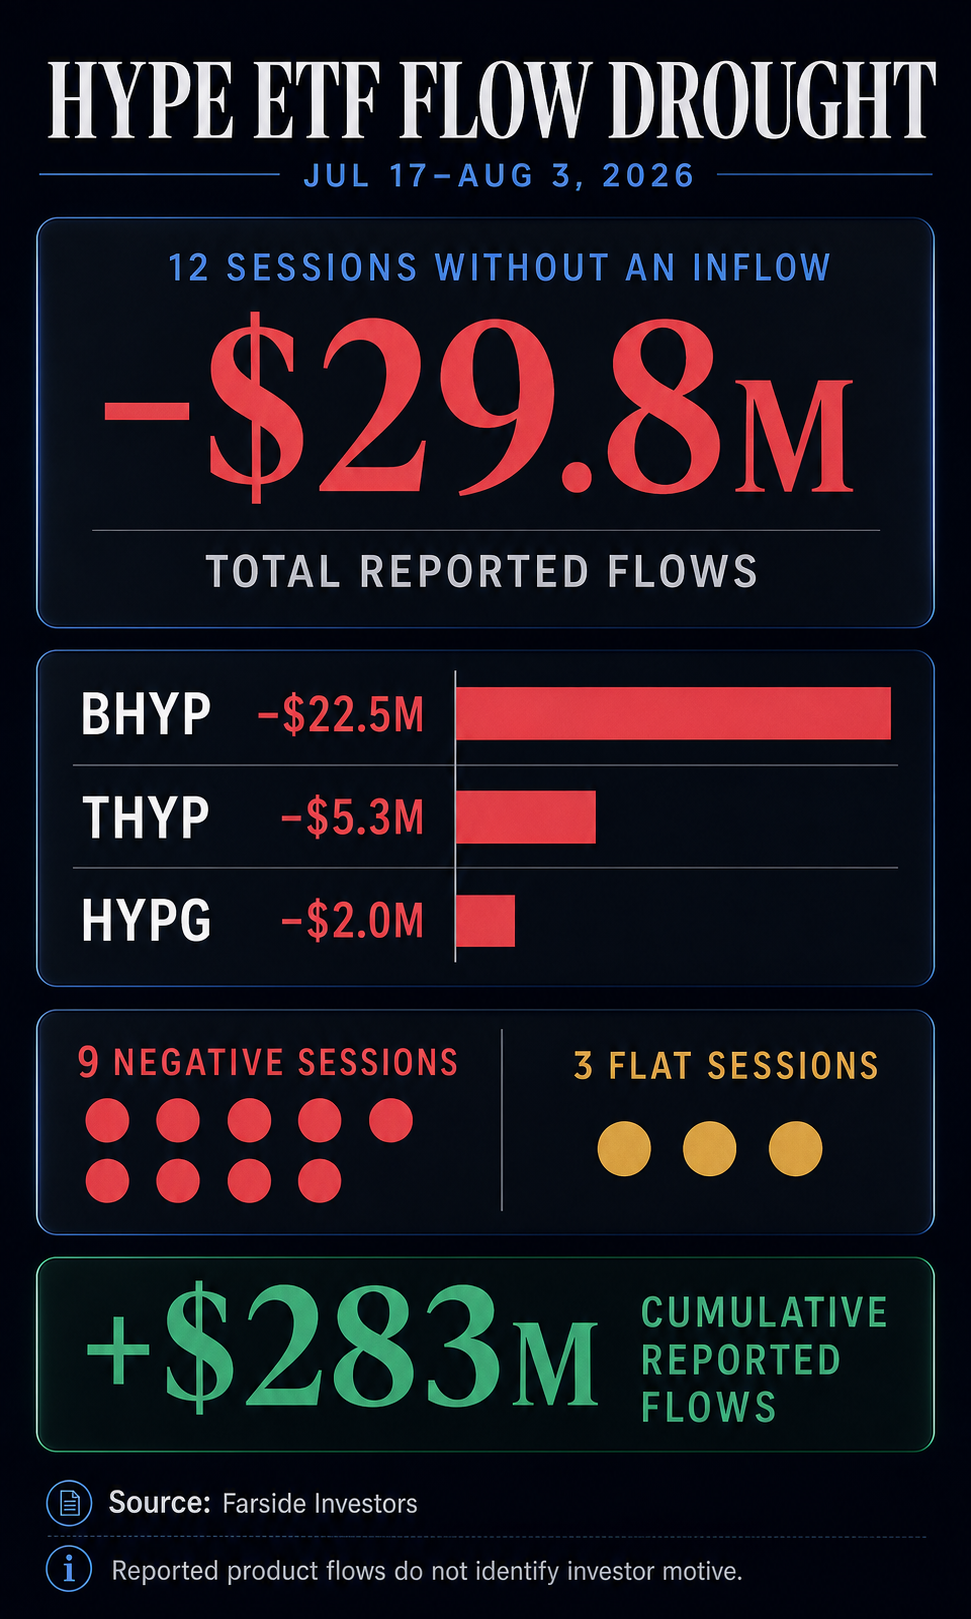
Hyperliquid’s HYPE ETFs went 12 trading sessions without a single inflow from July 17 through Aug. 3, 2026, recording $29.8 million in reported net outflows. The drought counted nine negative sessions and three flat ones.
According to Farside Investors, BHYP absorbed $22.5 million of the outflows, far more than THYP’s $5.3 million and HYPG’s $2 million. Farside’s Aug. 3, 2026 entry added a $1 million HYPG outflow; BHYP and THYP were flat.
Earlier inflows across the HYPE ETFs left a deep cushion. Farside’s table through Aug. 3, 2026 showed about $283 million of cumulative reported flows across the category, with $106.3 million for BHYP, $50 million for THYP and $126.9 million for HYPG.
The token was sliding at the same time. After CryptoSlate’s Aug. 3, 2026 market refresh, HYPE traded at $53.94, down 4.53% over seven days and 22.82% over 30 days. HYPE ETFs can see their asset values move with the token separately from share creations and redemptions.
Dated issuer figures show how AUM can drift away from cumulative flows. Bitwise listed $92.36 million of BHYP AUM and 3.03 million shares on Aug. 2, 2026, with 70% of assets staked. 21Shares listed $50.95 million of THYP AUM and 1.67 million shares on July 31, 2026. Its prospectus describes an intended 30% to 70% staking range. Grayscale listed $109.35 million of HYPG AUM, 5.67 million shares and 94.31% of assets staked on Aug. 3, 2026. Prices, staking rewards, fees and distributions keep those balances moving.
Daily flow tables track dollars while investor identity and motive stay hidden. Farside’s page omits end-investor identities and a full methodology. The THYP and HYPG prospectuses add another moving part. Authorized participants create and redeem shares to keep market prices near net asset value, activity that can shape daily flows.
The HYPE ETFs’ flow story has moved from early accumulation to a live durability test. The next print will show whether the drought is breaking or digging in.
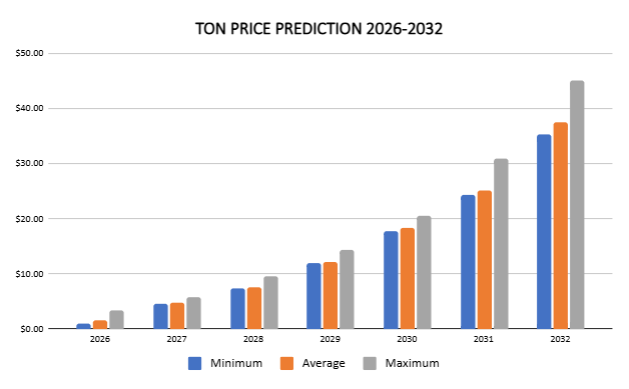
Our GRAM (prev. TON) price prediction anticipates a high of $3.35 in 2026.
In 2028, it will range between $7.26 and $9.49, with an average price of $7.60.
In 2030, it will range between $17.71 and $20.42, with an average price of $18.27.
In June, the TON community voted in favor of renaming Gram to Gram, with the ticker changing from GRAM (prev. TON) to GRAM. The change took effect on June 15, 2026. The blockchain itself stays The Open Network. Only the token’s name, ticker, and logo change.
Our GRAM (prev. TON) price prediction expects Gram to reach a high of $3.35 in 2026, move above $10 in 2029, and climb to an average price of $37.37 by 2032. For traders, investors, and crypto enthusiasts tracking Gram, this forecast explains the token’s current price, historical performance, technical analysis, market sentiment, and the price outlook from 2026 through 2032 so readers can make more informed investment decisions.
GRAM (prev. TON) (The Open Network) is a decentralized protocol developed by Telegram for the community. The protocol is a distributed supercomputer, or “super server,” comprising GRAM (prev. TON) Blockchain, GRAM (prev. TON) DNS, GRAM (prev. TON) Storage, and GRAM (prev. TON) Sites. The native token for the GRAM (prev. TON) ecosystem is called Gram (TON).
Gram is the native cryptocurrency of The Open Network and is used for transactions, digital payments, and network-level services, including Telegram Premium and ad purchases. Because Telegram integration gives GRAM access to more than 900 million monthly active users, changes in adoption, sentiment, and utility can materially affect future demand and price growth in a volatile crypto market.
Overview
Cryptocurrency
Gram
Symbol
GRAM
Current price
$1.39
Market cap
$3.81B
Trading volume
$97M
Circulating supply
2.73B
All-time high
$8.24 on Jun 15, 2024
All-time low
$0.3906 on Sep 20, 2021
24-hour high
$1.42
24-hour low
$1.32
GRAM price prediction: Technical analysis
Metric
Value
Volatility (30-day variation)
6.91% (High)
50-day SMA
$1.56
200-day SMA
$1.52
Market sentiment
Bearish
Green days
12/30 (40%)
Fear and Greed Index
25 (Extreme Fear)
GRAM (prev. TON) price analysis
Gram price movements are shaped by supply and demand, and by fundamental factors such as hacks or other market events, while investor sentiment can also affect GRAM price movements and quickly increase price volatility.
Large holders, or whales, can influence short-term price movements, and investors also contribute to short term volatility through financial speculation in the GRAM (formerly TON) market.
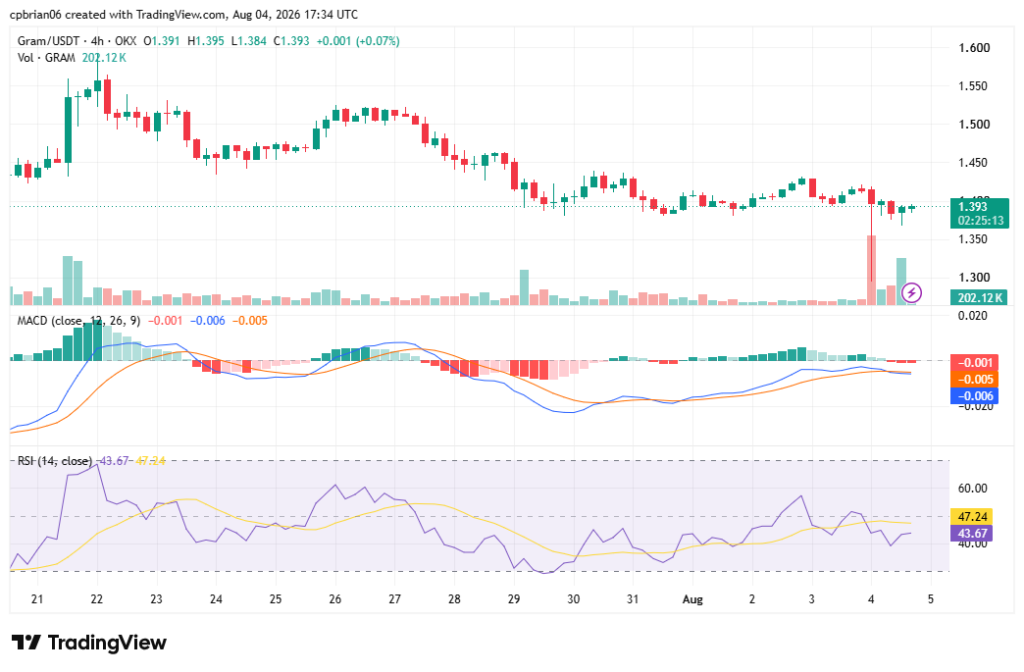
GRAM on Aug 4 was down 1.33% in 24h and down 21.48% in 30 days. Its short-term current forecast is based on technical factors and broader market conditions.
GRAM (prev. TON) turned bearish this month with key support at $1.36. The run was accompanied by rising trading volumes.
Each candle shows the opening, closing, highest, and lowest prices for the session. The latest candlestick pattern on candlestick charts suggests an undecided market – short candles. Traders can use Fibonacci retracement to identify key price levels and spot potential price pullbacks.
Traders use this price action view to predict Gram and to gauge momentum using indicators such as the RSI. The Relative Strength Index (RSI) is a momentum oscillator: readings above 70 can signal overbought conditions, and below 30 can signal oversold conditions, while the current RSI of 40.47 points to a neutral market as traders also watch resistance zones when judging a breakout attempt.
The 4-hour chart shows GRAM producing long candles this week, with negative market momentum. Many traders watch this timeframe for short-term moves and near-term market trends. Traders are now watching to see whether GRAM (prev. TON) breaks below the $1.35 psychological support zone; a recovery above $1.43 could restore upward momentum and increase buying pressure. In the coming days and into next week, direction will likely depend on whether GRAM (prev. TON) can defend that level and reverse from overbought territory. Its RSI is at 47.24.
GRAM (prev. TON) technical indicators: Levels and action
In technical analysis, moving averages use the average closing price over selected periods to help spot support levels and resistance levels.
Daily simple moving average (SMA)
Period
Value ($)
Action
SMA 3
1.41
SELL
SMA 5
1.41
SELL
SMA 10
1.44
SELL
SMA 21
1.47
SELL
SMA 50
1.56
SELL
SMA 100
1.70
SELL
SMA 200
1.52
SELL
Daily exponential moving average (EMA)
Period
Value ($)
Action
EMA 3
1.41
SELL
EMA 5
1.42
SELL
EMA 10
1.43
SELL
EMA 21
1.47
SELL
EMA 50
1.55
SELL
EMA 100
1.59
SELL
EMA 200
1.69
SELL
What to expect from the GRAM (prev. TON) price analysis next?
If GRAM (prev. TON) fails to hold the key support near $1.36, price could slip back toward lower support around $1.30, setting near-term targets in that zone. The relative strength index remains neutral, and broader crypto sentiment could determine whether this setup turns into renewed weakness or a recovery, though the current technical picture does not yet confirm fresh downward momentum. Multiple technical quantitative indicators and moving averages support a neutral GRAM forecast over the short term.
Is GRAM (prev. TON) a good buy?
According to Cryptopolitan price predictions, GRAM (prev. TON) will trade higher in the years to come. However, both technical analysis and fundamental analysis Toncoin can support or invalidate this bullish case for investors deciding whether to buy Gram. Even so, GRAM (prev. TON) remains highly risky, so readers should do their own research before deciding whether GRAM is a good investment.
Will GRAM (prev. TON) reach $10?
Yes, GRAM (prev. TON) should rise above $10 in 2029. Some toncoin price prediction models project a peak near $10 as early as 2027, though this forecast is more conservative. The move will come as the market recovers to previous highs.
Will GRAM (prev. TON) reach $100?
Per the Cryptopolitan price prediction, GRAM (prev. TON) is unlikely to reach $100 before 2031.
Will GRAM (prev. TON) reach $1,000?
According to the Cryptopolitan price prediction, GRAM (prev. TON) is unlikely to reach $ 1,000 before 2031.
Does Gram have a future?
GRAM has been on a bullish run since its inception, despite seasonal market corrections. Future growth will depend in part on the development of more decentralized applications, decentralized storage, and mini apps on the TON network, while future performance will also hinge on user adoption and a growing ecosystem within Telegram, where Gram enables smart contracts for various applications and supports real-world utility. Gram also serves as a fee for cross-chain transactions, and growing demand for toncoin ton as a utility asset across payments and applications could further support its value. The GRAM blockchain has a vibrant community of users and developers, with access to a broad base of Telegram users, and strong network activity, such as transaction volume and on-chain activity, can signal long-term strength. Looking ahead, Gram has the potential to trade higher in the coming years.
Recent news
Russia’s Federal Security Service (FSB) has charged Pavel Durov, founder of Telegram, with facilitating terrorist activity and placed him on an international wanted list, a direct escalation of a criminal case that first surfaced in February 2026.
GRAM (prev. TON) price prediction August 2026
The GRAM (prev. TON) August 2026 GRAM coin price prediction is an expected range of $1.67 to $2.30. It will average at $1.32. Even over a single month, future prices can still be affected by short-term sentiment swings.
Period
Potential low ($)
Potential average ($)
Potential high ($)
August
1.67
1.32
2.30
GRAM price prediction 2026
As 2026 unfolds, GRAM remains bullish within the broader cryptocurrency market, though the outlook will still depend on macroeconomic conditions. The price will range between $0.97 and $4.35, with the average TON price for 2026 projected at $2.23.
Year
Potential low ($)
Potential average ($)
Potential high ($)
2026
0.97
1.63
3.35
GRAM (prev. TON) price prediction 2027-2032
Long-range TON coin price prediction models often combine quantitative and qualitative inputs. Analysts may also use multiple scenarios to estimate future prices over 2027-2032.
Year
Potential low ($)
Potential average ($)
Potential high ($)
2027
4.48
4.80
5.71
2028
7.26
7.60
9.49
2029
11.84
12.22
14.29
2030
17.71
18.27
20.42
2031
24.31
25.16
30.81
2032
35.21
37.37
45.12
GRAM price prediction 2027
The GRAM (prev. TON) token prediction climbs even higher into 2027. According to the prediction, the toncoin price will range from $4.48 to $5.71 in 2027, with an average of $4.80, though regulatory developments and investor sentiment could affect the path toward that range.
GRAM price prediction 2028
The analysis suggests a further acceleration in TON’s price. GRAM (prev. TON) will trade between $7.26 and $9.49. It will average at $7.60.
GRAM price prediction 2029
According to the Gram forecast for 2029, the price of GRAM (prev. TON) will range from $11.84 to $14.29, with an average of $12.22. Even if the longer-term outlook stays bullish, regulatory uncertainty could slow momentum.
GRAM price prediction 2030
The GRAM price prediction for 2030, reflecting the expected toncoin ton price range, is $17.71 to $20.42. The average price of Gram will be $18.27.
GRAM (prev. TON) price prediction 2031
The Gram price forecast for 2031 has a high of $30.81. However, when the market corrects, GRAM (prev. TON) will reach a minimum price of $24.31 and an average of $25.16. Whether it reaches that upper target will also depend on broader market conditions and the adoption of digital assets.
GRAM price prediction 2032
In 2032, there will be more bullish momentum. According to the GRAM (prev. TON) price prediction, it will range between $35.21 and $45.12, with an average trading price of $37.37.
Our predictions indicate that GRAM (prev. TON) will reach a high of $3.35 in 2026. In 2028, it will range between $7.26 and $9.49, with an average of $7.60. In 2030, it will range between $17.71 and $20.42, with an average of $18.27. Note that the predictions are not investment advice. Seek independent professional consultation or do your research before making any investment decision. Crypto assets are highly risky, and there may be limited regulatory recourse for losses from such transactions.
GRAM is the native cryptocurrency of The Open Network, which launched in 2018 as the Telegram Open Network before being renamed and taken over by the TON Foundation. The chain uses proof of stake to support smart contracts and low-cost transactions, and its ties to the Telegram ecosystem provide access to a large user base.
In June 2020, all Gram tokens (98.55% of the total supply) became available for mining, further widening access to that user base.
The tokens were placed in special Giver smart contracts, enabling anyone to mine until 28 June 2022. Users mined around 200,000 GRAM (prev. TON) daily.
All the tokens were mined in two years, marking the completion of the distribution event.
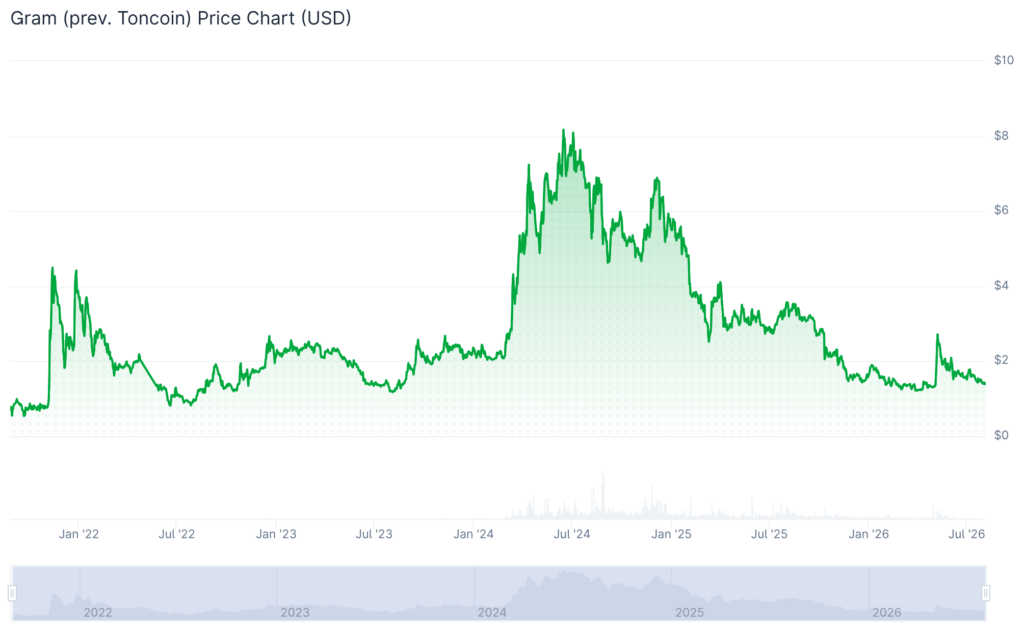
On September 20, 2021, GRAM (prev. TON) reached its all-time low of $0.3906.
Its first significant break came in November 2021. Over the past few days, the coin has slid from $0.8 to $4.5.
It corrected in 2022, reaching a low of $0.9.
In 2023, it ranged between $1.1 and $2.5.
In 2024, it registered another bull run, rising from $2.11 to its all-time high of $8.24 on Jun 15, 2024.
It corrected later, trading at $ 5.20 in October and $4.98 in November, when it began to recover.
The recovery saw the coin rise above $6.5 in December.
It then crossed into 2025, trading at $5.5. From there, it entered a bear market, falling below $3.8 in February and $3.0 in May. It crossed into June at $3.20 and maintained that level into August. In October, it fell to $3.00, and in November to $2.50, with shifts in network activity and user adoption helping shape sentiment through the decline.
In December, it traded at $1.60 and rose above $1.80 in January 2026.
The trend reversed in February, falling below $1.40. In May, at $1.35. In June, it crossed above $1.50, and in July, it crossed above $1.80 as activity improved during the rebound.