The lead research analyst at Glassnode has highlighted how the Bitcoin supply clustered at the top levels might have to shift down before a sustained recovery can take shape.
Bitcoin Cost Basis Distribution Shows Massive Supply Above $80,000
In a new post on X, Glassnode lead research analyst CryptoVizArt has discussed how the Bitcoin supply is looking from the perspective of the Cost Basis Distribution (CBD). The CBD is an on-chain indicator that tells us about the amount of BTC that was purchased at each of the levels that the cryptocurrency has visited during its history. Below is the chart for the metric shared by CryptoVizArt.
As is visible in the graph, there is a decent amount of Bitcoin supply that was purchased at recent price levels. This supply cluster has built up as the asset has consolidated in the region since February.
While this cluster isn’t small, it’s still less dense than some other zones. From the chart, it’s apparent that there are regions above $80,000 that host the break-even level of an extreme amount of supply approaching the 495,000 BTC mark.
These zones extend up to the top levels from the 2025 bull market. Earlier, the levels near $126,000 used to be even more dense, but as the digital asset sector has gone through this downturn, supply has changed hands at lower levels, weakening these clusters. However, the zones continue to be dominant relative to the clusters below $80,000.
“The Cost Basis Distribution heatmap shows a dense supply cluster in the $80k–$126k range, representing coins still held by buyers near cycle highs,” noted the analyst. Naturally, all of these holders are in a notable amount of unrealized loss right now.
Generally, underwater investors act as an impediment to price surges as they sell near their break-even. This effect could in part be what capped out the recovery rally in May. CryptoVizArt explained:
For a sustained recovery to take shape, this supply needs to gradually migrate into new buyers’ hands at lower cost basis levels. As that wall softens, the overhang pressure eases and demand has room to build conviction.
In the past, the process has often taken some time to occur for Bitcoin. “This transition can be achieved through deeper correction and/or bear market continuation,” said the Glassnode researcher.
It now remains to be seen how the CBD will develop for Bitcoin in the near future, particularly in terms of whether the top buyers finally capitulate to new investors.
BTC Price
Bitcoin plummeted to $59,000 last week, but the asset opened on Monday with some recovery as its price is now floating around $63,200.
Solana (SOL) price fell about 17% over the past week, but the real damage sits beneath the chart. Capital left the ecosystem, long-term holders capitulated, and trading activity faded together.
The price drop was the surface. On-chain, three measures show the selloff ran deeper than a routine pullback, and they explain why the bounce off $60, the latest low, still looks fragile.
Capital Actually Left the Solana Ecosystem
The first crack is in total value locked, or TVL. It is the dollar value of assets deposited in a network’s DeFi protocols. Solana’s DeFi-only TVL sits near $4.87 billion (excluding liquid staking), down about 9.55% over the past week and roughly 15% over 30 days.
A falling TVL means users pulled liquidity out of Solana’s apps rather than simply marking existing deposits lower. That points to capital leaving the network, not just prices dropping.
Want more token insights like this? Sign up for Editor Harsh Notariya’s Daily Crypto Newsletter here.
The exit raises a sharper question about who was selling, and the holder data provides the answer.
Even Long-Term Solana Holders Left
The deepest damage shows in the holder’s behavior. Hodler net position change, a metric that tracks whether long-term holders of 155 days or more are adding or reducing supply, fell sharply amid the TVL and price decline.
The figure dropped from about 3.27 million SOL on May 31 to roughly 2.36 million SOL by June 6, as the price slid toward its low. When the most patient holders sell into weakness, it shows conviction broken, not just speculative interest.
That loss of long-term confidence is the clearest sign the selloff was structural, and the trading data confirms it.
Trading Activity and DEX Dominance Both Slid
The cooling shows in volume. Centralized exchange volume for SOL peaked at $7.03 billion on June 6, the height of the selloff, then dropped back as the panic eased, leaving turnover at its lowest since that spike.
Do note that the 7-day rising trend is due to the high volume days on June 5 and June 6.
Solana’s DEX dominance, its share of total decentralized exchange volume across crypto, is also slipping. It sits near 22.6%, below its 60-day average of 23.3% and down from a near-term high of about 30.4% on June 4.
Falling dominance shows the weakness is structural, not just a SOL price move, as capital rotates away from Solana’s on-chain trading.
Together, the three measures explain what really broke during the crash.
The Rebound Looks Fragile Until One On-Chain Level Clears
There is one tentative positive. As Solana price bounced about 13% off its June 6 low near $60, hodler net position change turned higher again. This hints that long-term holders started buying once the price stabilized.
This is not a price prediction, but the on-chain cost basis shows the hurdle ahead. The cost basis distribution heatmap, which maps the prices at which holders actually acquired their SOL, shows a dense cluster of supply near $74 to $75.
Holders who bought there tend to sell when the price returns to their entry, creating resistance.
Until DeFi TVL stabilizes and that supply zone clears, the rebound stays fragile. Whether long-term holders keep buying or fading activity wins out will decide whether Solana’s price builds on its bounce or slips back toward its low.
OpenAI started rolling out Lockdown Mode to personal and business accounts. It’s an optional security setting that stops ChatGPT from connecting to the web and other external services. The goal is to help users who handle sensitive data reduce the risk of information being extracted through prompt injection attacks.
Lockdown Mode stops external data channels
Lockdown Mode stops live web browsing, deep research, agent mode, and file downloads for data analysis. The feature stops external data channels from interacting with the AI model.
Search results are limited to cached content, which may be incomplete or outdated. Image retrieval from the web stops working, too. However, a user can still upload their own images and use image generation.
The restriction list is specific. First, Canvas code loses network access. Moreover, Certain connected experiences, including financial tools and shopping agent features, stop working entirely.
Lockdown Mode will not prevent prompt injections from appearing in content that ChatGPT processes. Malicious instructions hidden in cached web pages or uploaded files can still alter how the model responds. Lockdown Mode essentially blocks the final step where exfiltrated data would leave OpenAI’s systems and reach an attacker.
“Lockdown Mode is not intended for everyone,” OpenAI states in its documentation. “It is designed for people and organizations that handle sensitive data and want stricter protection from data exfiltration risks related to prompt injection.”
Who can use OpenAI’s Lockdown Mode?
Free, Go, Plus, and Pro personal accounts are eligible, along with ChatGPT Business accounts. The rollout is gradual, and if a user doesn’t see the feature in the settings, they need to wait.
Enterprise accounts admins can create custom Lockdown Mode roles and assign them to specific members or groups.
The user can toggle the feature under advanced security. Lockdown Mode can also be turned off for individual chats without disabling it through the full account.
Lockdown Mode and Developer Mode cannot run simultaneously; enabling one automatically turns off the other.
OpenAI is trying to solve prompt injection attacks
Prompt injection is one of the hardest security issues facing AI products. Attackers embed hidden instructions in documents, web pages, or other content that a chatbot processes. The goal is tricking chatbots into sending sensitive information or performing other malicious actions.
OpenAI has many layers of cybersecurity protection, including sandboxing, URL filters, monitoring, and audit logs. Lockdown Mode is an extra layer that stops stolen data from leaking.
OpenAI acknowledged in a December 2025 blog post that capture-the-flag security challenge scores jumped from 27% to 76% across model generations in just three months.
Lockdown Mode does not change ChatGPT’s memory settings, file upload capabilities, conversation sharing options, or whether conversations are used for model training. Those remain separate toggles, and the feature also has no effect on Codex.
OpenAI ranks third-party integrations into three risk levels. Write actions for untrusted apps that carry the highest exfiltration risk. Sync connectors have a lower risk because data is already stored within OpenAI’s systems. However, they can still be a source of sensitive information that attackers go after.
A leading crypto analyst has further expressed their confidence that Dogecoin could be set for a bullish run in the current market cycle. This comes thanks to renewed buyer interest in the coin following its recent drop.
Rising Volume Signals Strong Demand for Dogecoin
In an X post, Crypto analyst Emilio Crypto Bojan described the latest drop in DOGE as a “generational entry” point. According to Bojan, trading volume began rising soon after the coin hit its low point, suggesting that many investors bought the dip rather than selling.
The meme coin fell by about 14% to $0.07763 during last week’s high-volatility period, when Bitcoin fell to $59,000. Bojan considers this a perfect moment to buy this coin at a low price.
Since then, DOGE has recovered to around $0.08529. The coin has also maintained strong interest among traders, with a 24-hour trading volume of about $812.7 million and a market value of roughly $14.5 billion.
Analysts are now closely watching the $0.099 price level. This is seen as an important resistance point for Dogecoin. Bojan believes that if the meme coin can move above $0.099 and stay there, it could confirm that buyers have regained control of the market. He expects the cryptocurrency to “pump hard” after reclaiming that level.
Meanwhile, data from Santiment shows that wallets holding between 100 million and 1 billion DOGE have been reducing their holdings in recent weeks. These wallets now control 23% of Dogecoin’s circulating supply. The decline marks the lowest level in five months.
At the same time, wallets holding more than 1 billion DOGE, which are often associated with crypto exchanges, have increased their share of the circulating supply. Their holdings have risen to 47%, suggesting high activity among retail investors.
Bullish DOGE Sentiment Builds Up Among Analysts
Another analyst, Trader Tardigrade, recently pointed to a chart pattern that mirrors Dogecoin’s historic bull cycle. The analyst noted that the coin appears to be repeating the same sequence seen between 2014 and 2017, where the coin went through a long consolidation period, followed by a falling wedge formation and then a breakout.
During the previous cycle, DOGE rallied by an astonishing 29,000% after the pattern was completed. Trader Tardigrade believes the current market structure looks quite similar, raising expectations that another powerful move could be developing.
Adding to the bullish outlook, Ali Martinez noted that Dogecoin recently reached his target price of $0.0883. He said the meme coin is now testing the lower boundary of its current trading channel, which could determine its next move.
As long as the coin remains above this support level, the analyst believes a recovery toward $0.1019 and possibly $0.1156 remains likely. At press time, the coin was valued at $0.08522, according to data from CoinMarketCap.
Sam Bankman-Fried has filed a formal clemency application with the White House via the Justice Department’s Pardon Attorney’s Office.
This caps months of public overtures toward President Donald Trump from his federal prison cell.
The request faces long odds as Trump said in January he would not pardon the convicted FTX founder, and the White House reiterated on Sunday that it has no plans to grant one.
From tweets to formal petition
The formal application comes after a sustained, visible campaign by Bankman-Fried to curry favor with the Trump administration.
The former crypto executive has used posts on X to praise the president’s economic agenda, commend his approach to deregulation, and encourage offshore crypto firms to return to the United States, according to Cryptopolitan’s earlier reporting.
When asked in a prison phone interview with FOX Business correspondent Susan Li whether he wanted a pardon, Bankman-Fried replied without hesitation, “Absolutely,” adding, “It would be obviously, you know, ultimately up to the president, not up to me.”
He refused to say whether his parents or anyone else was lobbying the administration on his behalf, telling Li that he can’t speak for them.
Li noted on X that the White House “has said they have no intentions of granting him one.”
What is SBF saying about the charges that led to his conviction?
Throughout the interview, Bankman-Fried maintained the position he has held since his arrest, which is that he did not commit fraud.
“I didn’t steal user funds either,” he told Li.
Pointing to the FTX bankruptcy estate’s payouts, he claimed that customers have received roughly 170% of their deposits back and called it “a great disservice to them that it has taken three years.”
However, the federal jury that convicted Bankman-Fried on seven felony counts, including wire fraud and conspiracy in November 2023, saw it differently.
Judge Lewis Kaplan sentenced him to 25 years in March 2024. According to court findings, FTX customers lost $8 billion, equity investors lost $1.7 billion, and lenders to Bankman-Fried’s hedge fund Alameda Research lost $1.3 billion.
Trump pardoned CZ and Ulbricht, not SBF
President Trump has pardoned a few crypto executives since resuming office in 2025. Notable names are Silk Road founder Ross Ulbricht, who was pardoned in January 2025, and former Binance CEO Changpeng Zhao in October 2025.
Trump told The New York Times in January that he had no intention of pardoning Bankman-Fried, grouping him with music producer Sean Combs and former Senator Robert Menendez as people who would not receive clemency.
What legal appeals are still in play?
Bankman-Fried is not exploring the pardon route as the only avenue in securing his freedom.
His legal team appeared before the US Court of Appeals for the Second Circuit in November 2025, seeking to overturn the conviction. If the appeals court upholds the conviction, he could petition the Supreme Court for review.
In April, Bankman-Fried withdrew a separate motion for a new trial, writing to Judge Kaplan that he might refile after his direct appeal concludes and the case is reassigned.
Prediction markets skeptical
Bettors on the prediction market platform, Polymarket, price the chance of Bankman-Fried leaving custody by the end of 2026 at 6%, with roughly $383,000 in volume on the contract.
Presidential pardons are rare, discretionary, and typically involve a lengthy Justice Department review process.
The Second Circuit’s ruling on Bankman-Fried’s appeal could land at any time. A favorable decision would reshape his legal position far more than a pardon request the White House has already signaled it will reject.
Don’t just read crypto news. Understand it. Subscribe to our newsletter. It’s free.
A 24-year-old former OpenAI researcher has turned a gloomy essay about artificial intelligence into one of the hottest trades on Wall Street. Leopold Aschenbrenner’s AI hedge fund, Situational Awareness, now manages about $20 billion.
The fund gained roughly 270% after fees this year through May, according to figures reported by the Wall Street Journal. In plain terms, money left there in January would have nearly quadrupled by spring.
The Big Idea, Explained Simply
Think of the AI boom as a gold rush. Aschenbrenner is not betting on who finds the most gold. He is betting on whoever sells the shovels.
His shovels are electricity and computers. Powerful AI needs huge amounts of both. He argues those physical limits, not clever software, will decide who gets rich.
He laid this out in a 165-page essay in 2024, and it went viral. Some of the shovel sellers he favors are Bitcoin miners hosting AI instead of mining coins.
What the AI Hedge Fund Actually Owns
His biggest public holding is Bloom Energy, a company that makes fuel cells to generate power on site. He also owns CoreWeave, which rents out AI computing power, plus several former mining data centers now running AI.
Here is the clever twist. While betting on power, he is also betting against the chipmakers everyone loves. He has wagered more than $1.5 billion that Nvidia’s stock will fall, and over $2 billion against a basket of chip stocks.
Traders call these short bets. His reasoning is simple. Chip prices already assume everything goes perfectly, while the real shortage will be electricity.
He bought in during February 2025, when Anthropic was worth about $60 billion. By May 2026 that price tag had jumped to $965 billion after a fresh funding round. That one bet now makes up roughly a fifth of the whole fund.
His firm even shows up among Anthropic’s listed investors, and the AI maker has since moved toward an Anthropic confidential IPO.
Jane Street, a secretive trading giant that rarely backs outsiders, has also put money into the fund.
The Catch
Betting big on one idea cuts both ways. If companies slow their AI spending or the power crunch eases, the fund could fall just as fast as it rose.
For now the wager is paying off, and much rides on whether Anthropic’s soaring private valuation holds up. The coming months will show whether shovels really do beat gold.
The United Kingdom’s asset regulator, the Financial Conduct Authority (FCA), has proposed a new standing for investment funds which would allow them to have up to 10% of their assets in crypto exchange traded notes (ETNs), in a move geared towards opening regulated funds to digital asset exposure.
This proposal was published as part of the FCA’s 52nd quarterly consultation paper, with the consultation window closing on July 13.
FCA proposal
Portfolio managers at authorized funds could be allowed to hold crypto ETN positions so long as the total allocation stays at or below 10% of the entire asset holding, according to the published proposal. Fund managers would also need to show that any ETN holdings align with the fund’s stated investment objective and risk profile.
The FCA has set a 10% cap to limit risk exposure and prevent funds from being pushed into “restricted mass market investment” territory at higher allocation levels, which could complicate their regulatory classification as retail products.
Based on the proposal plan, funds will be permitted to hold crypto ETNs listed on recognized investment exchanges in the UK. Products traded in the EU and other global markets that satisfy existing market criteria for eligibility are also expected to qualify for listing.
Possible proposal benefactors
The proposal covers a wide scope of financial institutions and investment funds, but still has clear boundaries on who it applies to and who it doesn’t. Some investment schemes serving professional investors and individuals with a high net worth would face no allocation cap.
Long-term asset funds and non-UCITS retail schemes structured as alternative investment funds would be excluded entirely from holding crypto ETNs.
However, the FCA’s stance on direct crypto ownership has not changed in the slightest. Ownership of cryptocurrency by these funds is still off the table. Funds can gain exposure only through listed and approved crypto ETNs.
The FCA said it would revisit that position after assessing how its forthcoming crypto regulatory framework and client-asset protection rules affect fund structures.
UK crypto ETN market
The recent proposal comes after a sequence of shifts in the regulatory market, with the FCA lifting its ban on retail investors accessing crypto ETNs in October 2025, a change that reopened a market that had been closed for four years. Financial institutions, including 21Shares, Bitwise, WisdomTree, and BlackRock, then listed physically backed Bitcoin and Ether products on the London Stock Exchange.
In April 2026, British investors became allowed to hold crypto ETNs in Innovative Finance ISAs after the HMRC had previously blocked new acquisitions within conventional stocks-and-shares ISAs.
The current proposal addresses what the FCA sees as a regulatory gap, as individual retail investors could already access crypto ETNs directly but the funds managing their money could not.
Jon Allen, head of innovation and operations at the Investment Association, called the proposal “a practical step” that would let funds gain crypto exposure through regulated ETN products.
This move from the UK FCA is on track with recent trends across Europe, where regulators in Germany, Switzerland, and the Netherlands have already allowed similar financial products for investment funds.
Ethereum’s slide to its lowest level in more than a year is testing the Wall Street trade that brought the token deeper into institutional portfolios.
Data from CryptoSlate shows that the second-largest cryptocurrency fell to as low as $1,506 during the last 24 hours, its weakest level since April 2025, extending a broad crypto selloff that has already drained leverage from derivatives markets and pushed traders toward defensive positioning.
Crucially, the downswing is not confined to ETH’s spot market as the digital asset is also experiencing a broader deterioration across regulated ETF flows, centralized exchange deposits, and derivatives positioning.
This situation comes at a time when the broader crypto market sentiment has significantly weakened, with Bitcoin falling toward a four-month low near $60,000, while Ethereum has erased much of its market support.
ETF outflows weaken Ethereum’s institutional bid
The pressure has been most visible in the ETF market, where the products that gave institutions a regulated way to buy Ethereum have turned into a source of persistent outflows.
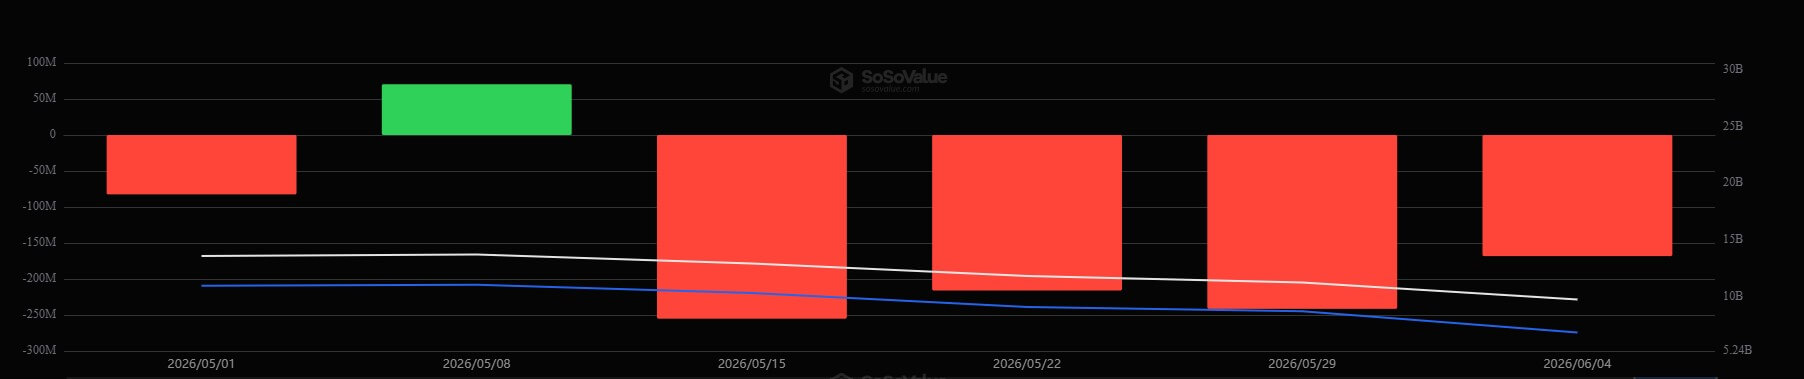
Data from SoSoValue shows that spot ETH ETFs have recorded four straight weeks of withdrawals totaling more than $870 million.
Ethereum ETFs Weekly Flows (Source: SoSoValue)
During that period, the funds posted a 17-day outflow streak interrupted by only one day of inflows, when investors added $19.3 million.
As a result, sosoValue data show total spot Ethereum ETF assets have declined more than 70% from their $30 billion peak to $8.71 billion, which is equal to about 4.01% of Ethereum’s circulating market capitalization.
The reversal has weakened one of the main arguments behind Ethereum’s institutional expansion. The ETFs were expected to broaden access to the asset, deepen liquidity, and give traditional investors a cleaner way to gain exposure without handling tokens directly.
However, that demand has softened as ETH’s price moved lower and investors have reduced risk across digital assets.
Exchange inflows add another supply risk
As institutional demand-side forces abated, the physical supply available on liquid trading platforms experienced a sudden and substantial expansion.
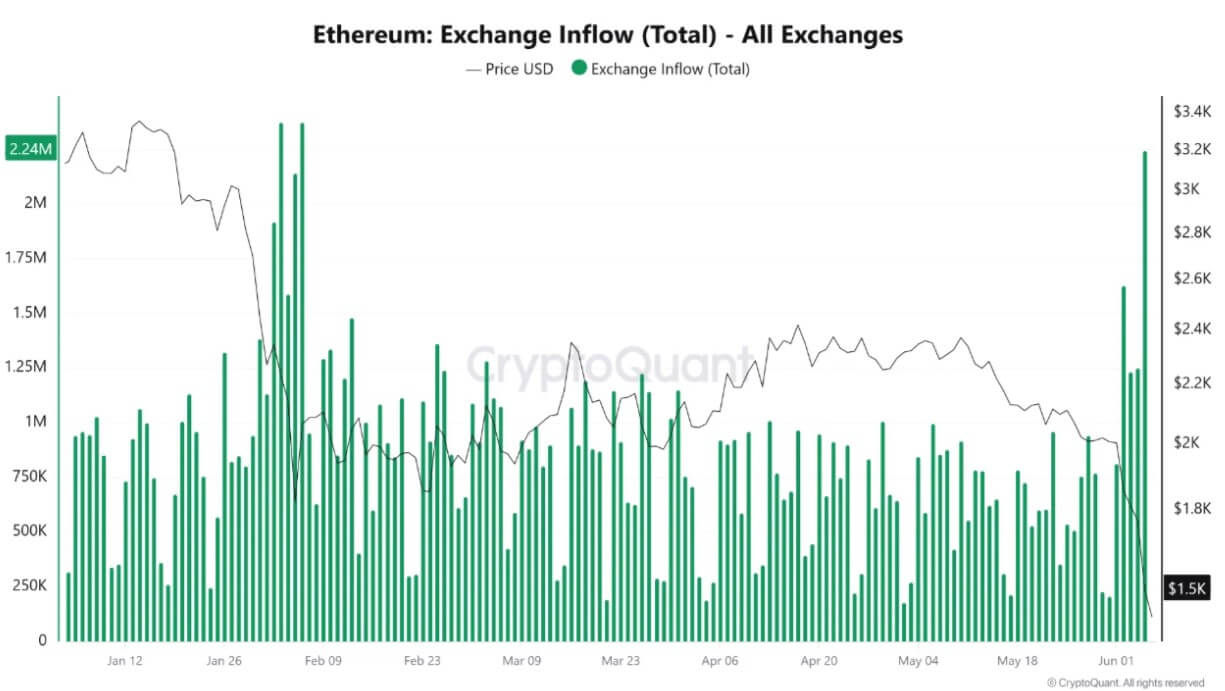
CryptoQuant data show Ethereum inflows to trading platforms climbed to about 2.24 million ETH in a single day, the highest level in four months. Binance accounted for more than 1.16 million ETH of those inflows, representing more than half of the total.
Ethereum Exchange Inflows (Source: CryptoQuant)
This surge in active supply can be seen in high-profile on-chain movements that served as glaring evidence of the liquidity migration.
Notably, a wallet linked to Ethereum co-founder Joseph Lubin awoke after more than three years of dormancy, mobilizing 80,001 ETH, valued at roughly $122 million.
The massive transfer epitomized the broader trend where long-inactive capital breaks from cold storage to seek out active trading venues and liquid architectures amid the mounting market stress.
Large inflows to trading platforms do not automatically mean investors are selling. They can reflect market-making activity, collateral movement, internal transfers, or portfolio restructuring during periods of stress.
However, traders watch the metric closely because coins held on exchanges are easier to sell or use in derivatives activity than coins sitting in private wallets.
The timing has made the increase harder to dismiss. Ethereum was already trading near $1,580 when the inflows accelerated, while Bitcoin had fallen toward $59,000. That combination suggested investors were moving assets during a marketwide reset rather than during a routine period of repositioning.
If exchange deposits remain elevated, the market could face additional short-term volatility.
Derivatives deleveraging deprives market of rebound capital
The velocity of the current crypto market decline has been accelerated by an extensive deleveraging cycle across leveraged futures platforms.
As spot valuations rapidly deteriorated, automated liquidation engines on major exchanges systematically closed out underwater long positions to protect clearinghouse integrity, amplifying organic selling pressure.
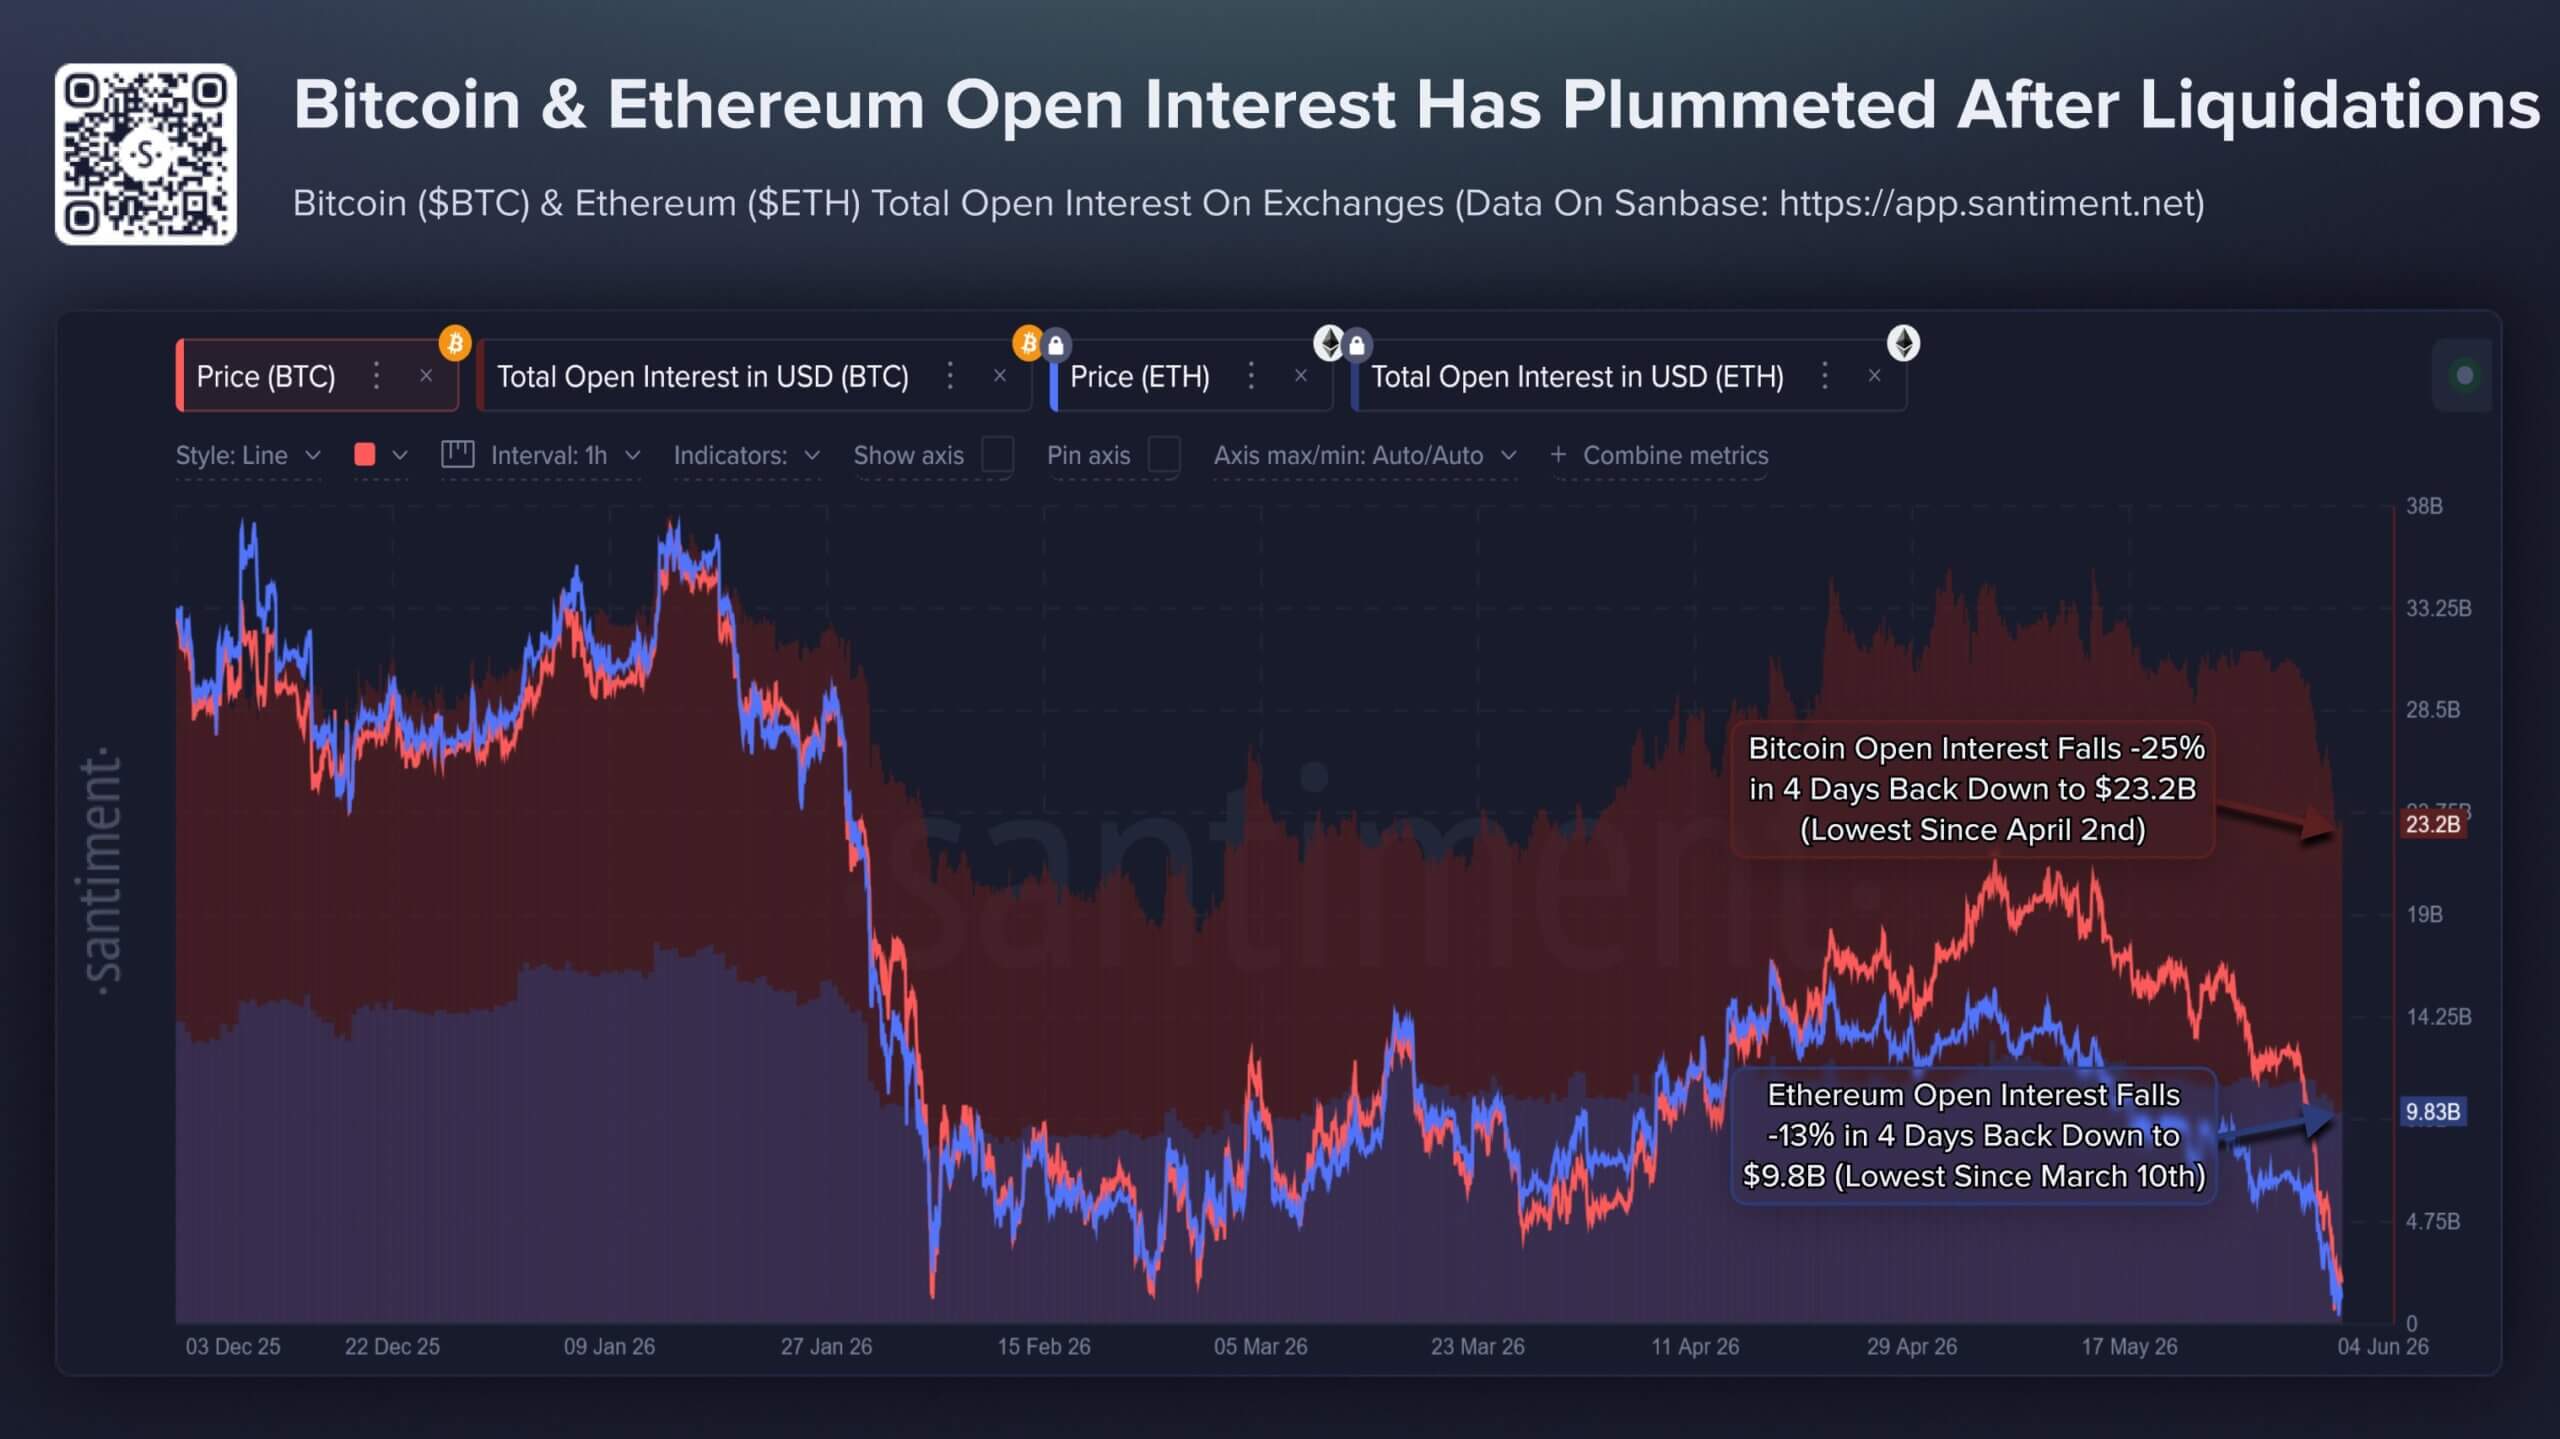
Data analyzed by Santiment illustrates that this liquidation wave effectively flushed out a massive block of speculative capital over a narrow four-day window:
Bitcoin Total Open Interest: Contracted by approximately 25%, dropping to $23.2 billion, which is its lowest operational aggregate since early April.
Ethereum Total Open Interest: Decreased by 13%, settling at $9.8 billion, a structural low point not seen since March.
Bitcoin and Ethereum Open Interest (Source: Santiment)
While this aggressive deleveraging leaves the underlying market structurally healthier by purging speculative excess and over-extended margin, it introduces an immediate liquidity vacuum.
The severe drop in open interest demonstrates that the speculative floor has thinned, leaving the market highly vulnerable to further spot pressure due to the lack of immediate leveraged capital available to front-run a classic V-shaped recovery.
Consequently, retail crowd sentiment has cratered to its most pessimistic footing since mid-February.
The firm noted that social metrics reveal an exponential increase in the phraseology of capitulation, with organic social discussions increasingly pairing terms like “Bitcoin” and “altcoins” alongside terminal descriptors such as “dead,” “finished,” “over,” and “ending.”
Traders hedge for a break below $1,500
The buildup of stress across ETFs, exchange flows, whale cost bases, and leveraged markets has shifted attention to ETH’s options market, where traders are paying more to protect against another leg lower.
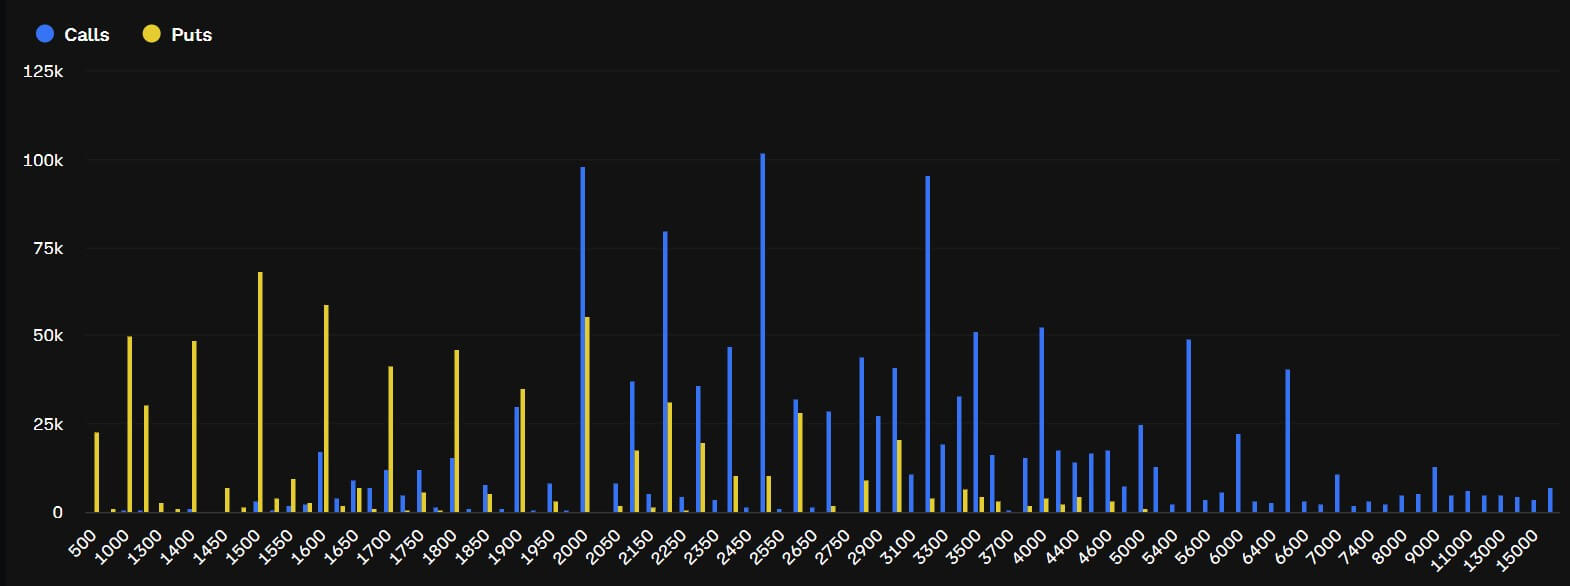
Deribit data show demand for downside protection has increased sharply. The ETH options put-to-call premium rose to 3.7 times on Friday and has shown consistent excess demand for put options since Monday. Put contracts give holders the right to sell at a set price, making them a common hedge when traders expect further losses or want protection against a disorderly move.
ETH’s open interest has clustered around several downside strikes. Traders have built roughly $108 million in open interest around the $1,500 strike, while the $1,400 strike has attracted about $75 million. The $1,000 strike has drawn about $78 million in positioning.
Those levels do not mean the market expects ETH to fall to $1,000 immediately. Instead, they show that traders are paying for protection after several support signals weakened at the same time.
BlockScholes data show the shift has also appeared in volatility pricing. ETH short-dated implied volatility has jumped from a year-to-date low of 36% to 67%, signaling that traders now expect larger near-term price swings.
The move has been accompanied by a sharper skew toward out-of-the-money puts. The seven-day ETH options skew has moved to about -14%, compared with roughly -3% to -4% in late May. Additionally, the demand for puts has also spread across 7-day, 14-day, 30-day, and 90-day maturities.
That broadening shows traders are not just hedging a single event or one short-term move. They are preparing for the possibility that Ethereum’s weakness could extend if ETF outflows continue, exchange inflows stay elevated, and large holders remain below key cost levels.
The next test is whether $1,500 becomes a floor or a trigger. A stabilization in ETF flows and a decline in exchange deposits could help ease pressure.
Without that, the options market’s focus on downside strikes may become the clearest signal of where traders expect the next phase of the selloff to concentrate.
Andrei Grachev, co-founder of DWF Labs, warned on X that Strategy (formerly MicroStrategy) and BitMine could trigger the largest crypto market crash in history, urging investors to imagine Bitcoin falling to $10,000-$20,000.
This warning lands at one of the most fragile moments for both companies.
A crypto treasury crash happens when major corporate holders are forced to liquidate large positions, pushing prices into a self-reinforcing downward spiral. Grachev believes MicroStrategy and BitMine could become exactly that kind of trigger event.
He framed his post as a thought exercise. The DWF Labs co-founder said he hopes the scenario does not unfold, yet he wants investors to genuinely consider their trading strategy if Bitcoin slides toward the $10,000-$20,000 range.
BitMine and Strategy have all the chances to create the largest market crash in the history of crypto Fingers crossed that it won’t happen, but if it did, what’s your strategy for BTC crash to 10-20k$?
Grachev has consistently warned about leverage and structural risk. He previously described the October 2025 cascade as a “nuclear bomb” event and has spoken about ongoing “liquidity wars” that keep wiping out billions across crypto markets repeatedly.
His core argument focuses on concentration. Two corporate giants now hold massive crypto positions, and any forced selling under financial pressure could amplify weakness across already fragile market conditions and trigger panic among retail and institutional holders.
🚨RETAIL HAS VANISHED FROM THE CRYPTO MARKET
CEX spot volume collapsed to $679 billion, the lowest level since October 2023, as per CryptoQuant.
Spot trading is now down 46% YoY, a staggering -67% drawdown from its October 2025 peak.
Why MicroStrategy and BitMine Sit at the Center of the Storm
MicroStrategy recently incurred approximately $13 billion in unrealized Bitcoin losses, its largest paper loss ever recorded. The firm holds more than 843,000 BTC across its corporate balance sheet.
The pressure runs through its capital stack. Strategy’s variable-rate perpetual preferred stock STRC slipped below $95, according to TradingView data. Meanwhile, MSTR shares have pulled back sharply, and the company recently sold 32 BTC for the first time since 2022.
BitMine sits on a similar problem. The Ethereum-focused treasury holds around 5.28 million ETH and carries over $10 billion in unrealized losses, after acquiring its stack at an average price near $3,500 per token.
FTX Imploded In 2022 And Left Customers With Over $8 Billion In Losses.
Today, Tom Lee’s Ethereum Position Is Down More Than $10 Billion. That’s Over $2 Billion Worse Than One Of Crypto’s Biggest Disasters.
Grachev does not predict the crash. He simply asks investors to mentally prepare for a scenario in which two corporate Bitcoin and Ethereum giants tip the market toward levels not seen since the previous deep bear-cycle low.
Solana co-founder Anatoly Yakovenko publicly rejected Senator Bernie Sanders’ AI jobs warning. The senator argues artificial intelligence (AI) and robotics could wipe out millions of American jobs.
Sanders paired the warning with a renewed call to ban super PACs. Yakovenko answered with a string of posts defending markets, profit, and decentralized finance (DeFi).
Sanders’ AI Jobs Warning Meets a Free Market Rebuttal
The Vermont senator said Congress has abandoned workers threatened by automation because of industry money.
Is Congress doing anything to help the millions of workers who could lose their jobs to AI and robotics? No.
They’re intimidated by the hundreds of millions the AI industry is pouring into super PACs.
The spending claim tracks with disclosures. Leading the Future, an AI super PAC network backed by OpenAI president Greg Brockman and Andreessen Horowitz, raised $125 million in late 2025.
The group has pledged at least $100 million for the midterms.
“Senders [Sanders] is focusing on hypothetical sci fi problems because he is completely f’ing useless at solving any real problems,” the Solana co-founder posted in the thread.
Capital, Trillionaires, and the DeFi Defense
Yakovenko widened the argument across more than a dozen replies. Billionaires hold capital rather than hoarded wealth, he argued, and surplus production is what raises living standards.
He also claimed 500 more trillionaires would roughly double the global standard of living, all else equal. Reportedly, his family left the USSR with $50 per person, he shared, casting central planning rather than AI as the real threat to workers.
The thread looped back to crypto. Any profitable market will be rebuilt endlessly as a smart contract, he wrote, months after he gave away code for a perpetuals exchange.
There is no last train. Anything that is generating a profit that can be built as a smart contract will be built, over and over. That’s the whole point of DeFi. Reduce the cost of finance to the cost of software.
Solana (SOL) traded at $65.36 at press time, up nearly 6% in 24 hours. The coming primaries will test whose framing carries more weight with lawmakers.