Ripple Price Analysis: The Next Few Trading Days Will Be Essential for XRP
XRP is approaching a critical consolidation breakout after weeks of range-bound trading, with the next few sessions likely to determine whether the asset breaks higher or resumes its broader downtrend. For institutional traders, this compression phase presents a defined risk-reward setup as volatility contracts ahead of what technical analysts expect to be a significant directional move.
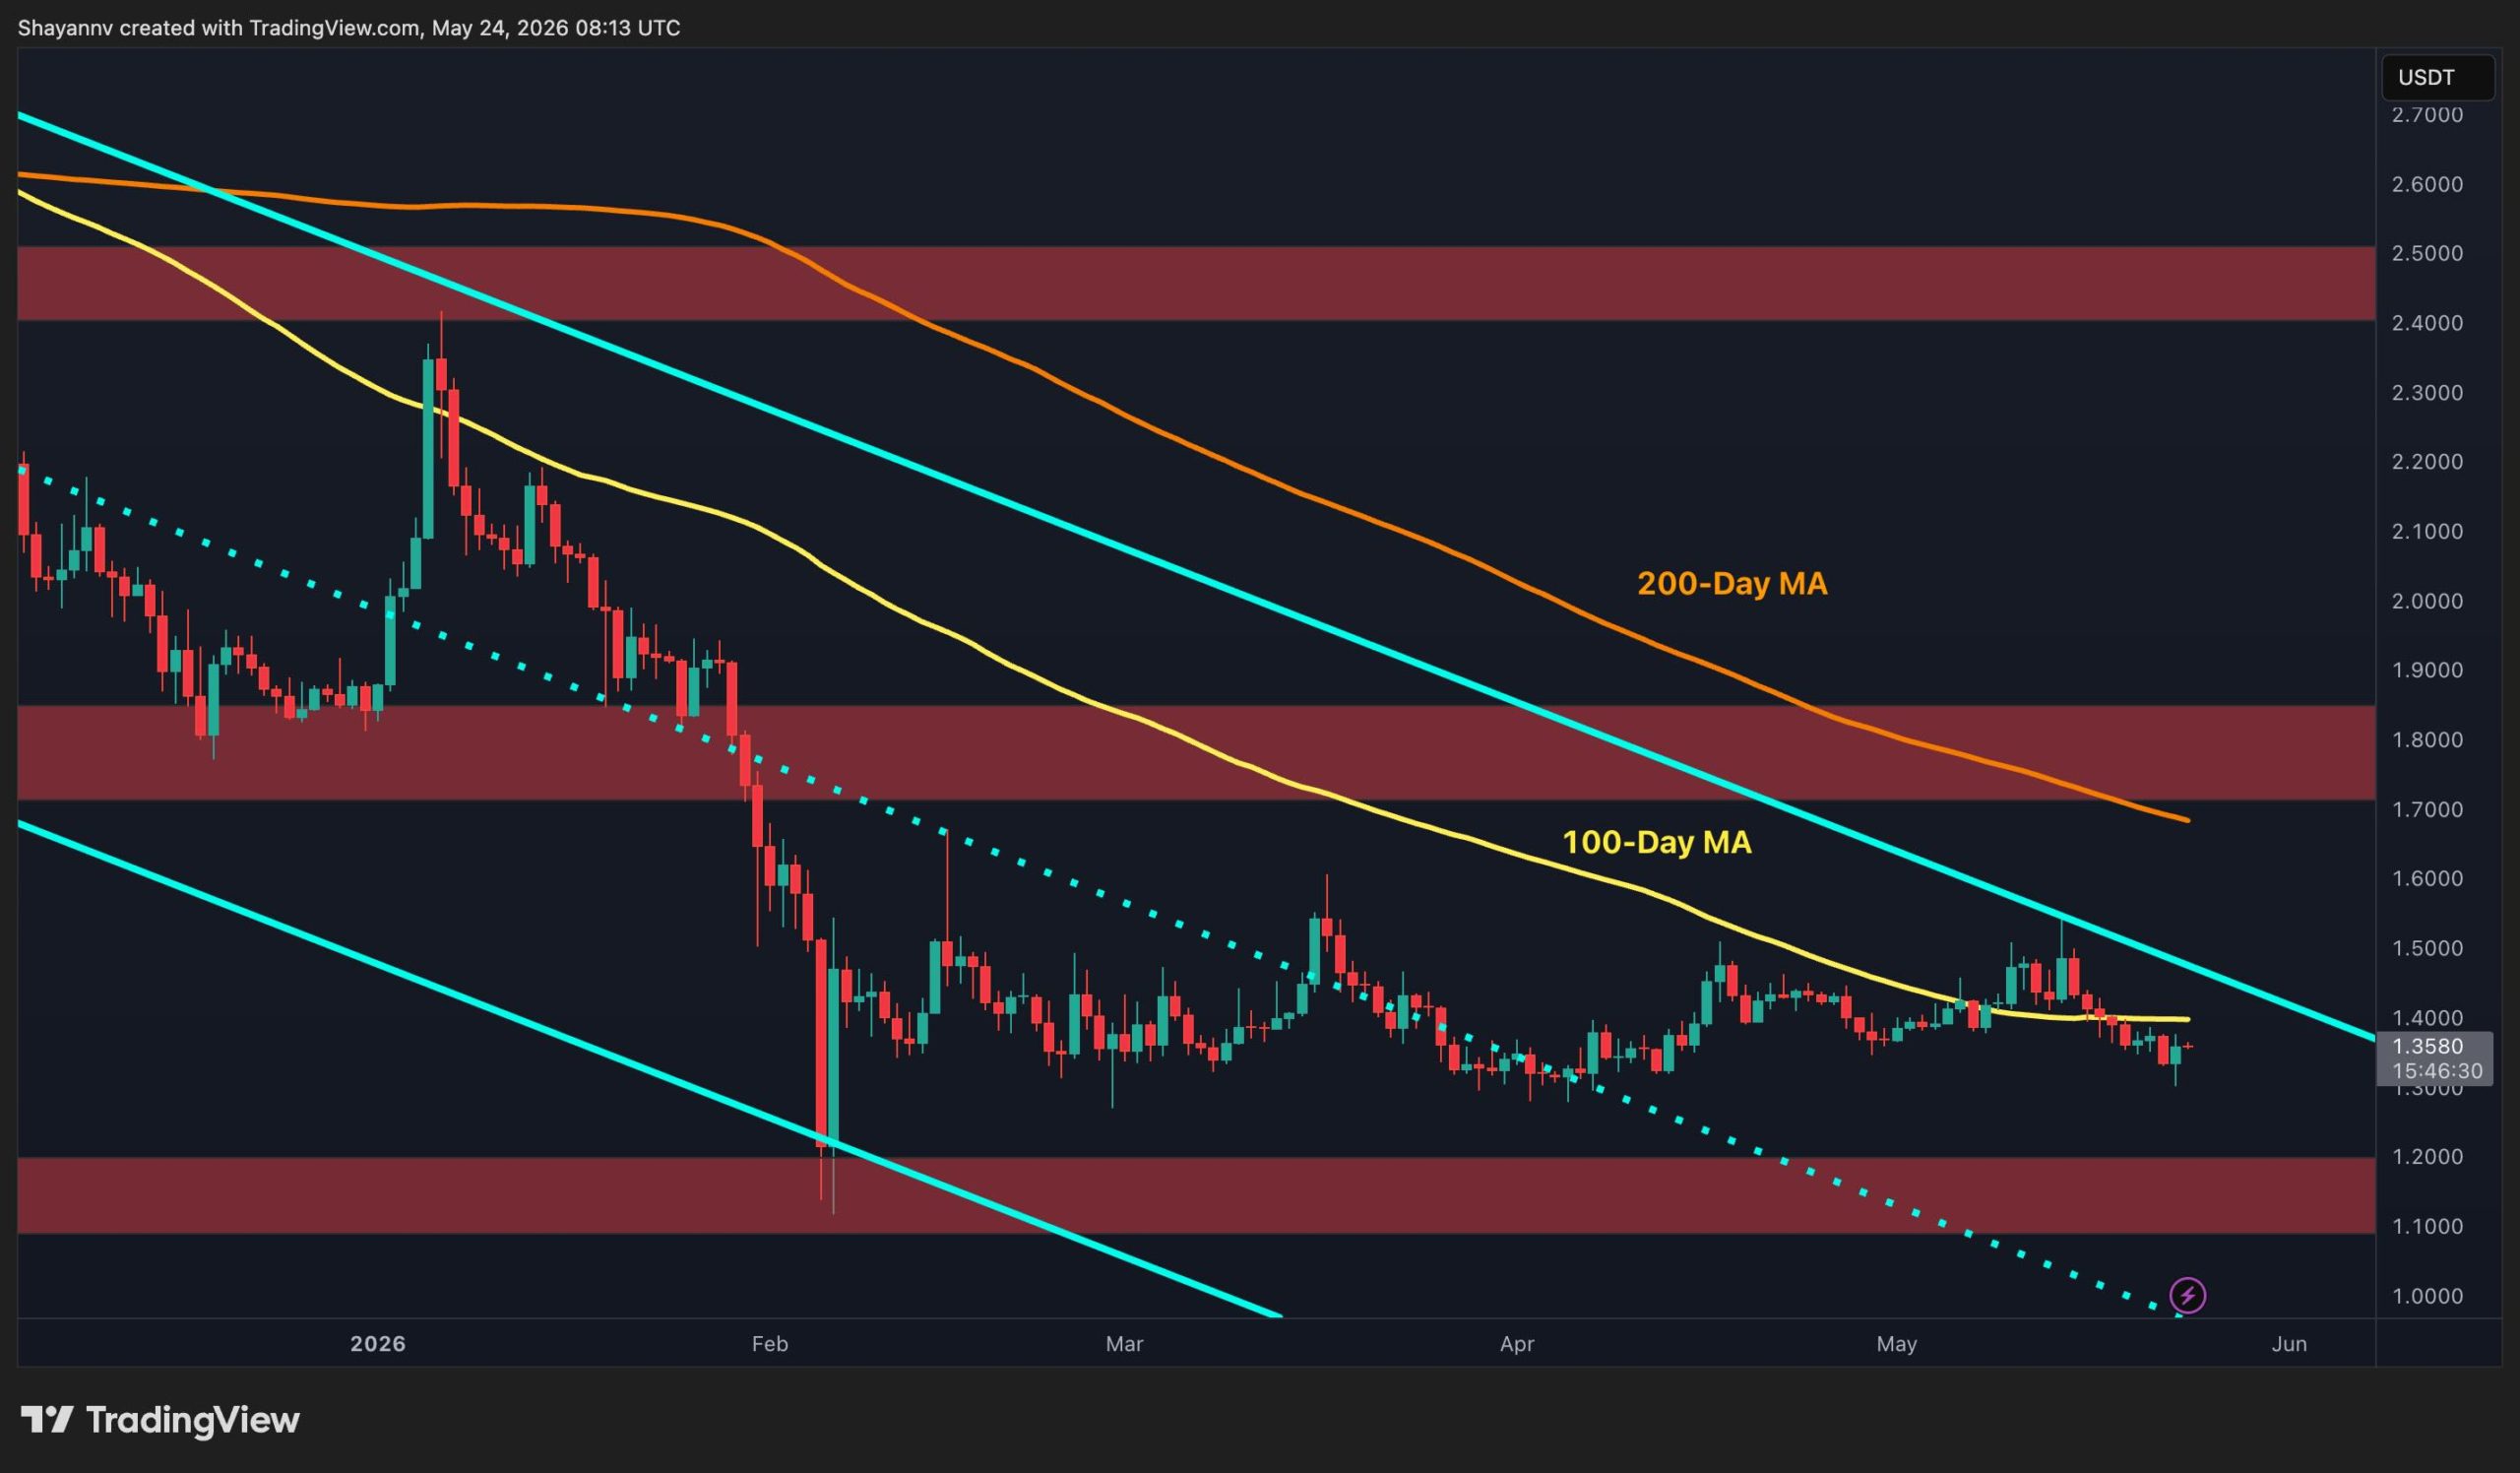
- XRP is trapped in a $1.27, $1.57 range on the 4-hour chart after repeatedly testing support near $1.30 over several weeks
- The daily chart shows the asset struggling below the 100-day moving average at $1.38 while approaching a narrowing descending channel structure
- A breakout above $1.40, $1.45 could trigger recovery toward $1.75, $1.85 resistance, while a breakdown below $1.30 would expose support near $1.10, $1.20
- $1.38 100-day moving average level acting as dynamic resistance on daily timeframe
- $1.30 Critical support zone on 4-hour chart tested repeatedly over recent weeks
- $1.75, $1.85 Primary resistance target if bullish breakout from consolidation confirms
XRP is entering a decisive technical window after extended price compression, with volatility contracting on longer timeframes while shorter-term charts reveal repeated buyer defense at established support levels. The asset has oscillated between $1.27 and $1.57 for several weeks on the 4-hour timeframe, forming a relatively stable consolidation range.
At the same time, the daily chart shows XRP trapped beneath a descending long-term trendline and struggling around the 100-day moving average near $1.38, where sellers have repeatedly prevented sustained upward momentum.
This two-timeframe structure, range-bound consolidation on shorter intervals combined with a compressing descending channel on daily charts, typically precedes either a sharp directional breakout or exhaustion of one side of the market. Technical analysts monitoring the asset expect the next few trading sessions to clarify which scenario unfolds.
Buyers Hold Support Near $1.30 as Range-Bound Trading Persists
On the 4-hour chart, XRP has established a relatively tight trading band with support anchored around $1.27, $1.30 and resistance near $1.53, $1.57. The asset revisited the lower boundary of this range most recently and triggered another bullish reaction, suggesting that buyers continue to defend the support zone.
This repeated defense of support is significant because it indicates demand remains present at lower prices, even as the broader downtrend has persisted over longer timeframes. However, technical structure suggests this strength may be temporary rather than the start of a durable recovery.
As long as XRP maintains the $1.30 level, the path toward upper resistance around $1.53, $1.57 remains open for a short-term corrective move.
Repeated tests of support tend to weaken demand over time, and institutional traders monitor how many times a level can be retested before it breaks. Failure to maintain the $1.30 support zone would invalidate the 4-hour consolidation range and signal renewed downside pressure toward the $1.10, $1.20 demand zone.
For now, the market structure on this timeframe favors continued ranging behavior, with the upper resistance zone near $1.55 serving as the primary target for any short-term recovery before the asset faces the larger structural resistance overhead.
Daily Chart Narrowing Channel Signals Imminent Breakout Likelihood
The daily timeframe reveals a broader technical narrative. XRP remains trapped beneath the descending long-term trendline while simultaneously struggling around the 100-day moving average near the $1.38 region. This moving average has recently acted as dynamic resistance, consistently preventing buyers from sustaining upward momentum through it.
The price action is also approaching the narrowing section of the broader descending channel structure, a pattern that technical analysis associates with compression periods that typically resolve into impulsive moves.
Volatility compression on higher timeframes often precedes significant directional moves, and XRP appears to be entering exactly such a decision zone where prolonged consolidation becomes less likely to persist. The primary resistance on the daily chart remains the $1.75, $1.85 supply region, with stronger resistance located around the 200-day moving average near $2.0.
The key support on the downside sits around the $1.10, $1.20 demand zone, representing a meaningful floor if the consolidation range breaks lower. The most probable near-term scenario is continued compression around the 100-day moving average at $1.38, followed by an impulsive breakout in one direction or the other.
A bullish breakout above the descending channel and the $1.40, $1.45 area could trigger recovery toward the $1.75, $1.85 resistance region.
Breakout Direction Will Determine Next Institutional Trading Setup
For institutional traders positioning ahead of this resolution, the directional outcome carries significant portfolio implications. A bullish breakout above the descending channel and $1.40, $1.45 zone would represent a break of the daily moving average and a shift in the intermediate trend structure.
Such a move could trigger recovery momentum toward the $1.75, $1.85 resistance region, with the next meaningful resistance at the 200-day moving average near $2.0. This scenario would require sustained buying pressure to overcome the historical resistance established at these levels.
Conversely, rejection from current levels would reinforce the broader bearish trend and expose the lower support zone around $1.10, $1.20 once again. This downside scenario becomes more probable if XRP fails to hold the $1.30 level on the 4-hour chart or struggles to close above the 100-day moving average on the daily timeframe.
The risk-reward structure appears asymmetrical depending on which side of the consolidation range the breakout occurs, with bullish scenarios offering larger profit targets but also requiring conviction buying, while bearish scenarios offer tighter risk management at the upper boundary of the range.
The next few trading sessions will determine whether the volatility compression resolves upward or downward. Institutional traders should monitor whether XRP can close above the 100-day moving average at $1.38 on the daily timeframe, as this level will serve as the critical inflection point for the medium-term trend.
Simultaneously, watching whether the 4-hour support at $1.30 holds or breaks will provide early warning of a potential larger breakdown. A confirmed close above $1.40, $1.45 would signal the start of a recovery phase, while a breakdown below $1.30 on multiple 4-hour closes would indicate the consolidation range has failed and lower targets are in play.
The decision is expected to unfold within the next 3-5 trading days based on current technical structure. Watch for a daily close above $1.40, $1.45 to confirm breakout bias upward toward $1.75, $1.85, or a failure to hold the 4-hour support near $1.30 to indicate downside acceleration toward $1.20 and below.
Regulatory Clarity and Spot ETF Expectations Reshaping XRP Institutional Positioning
XRP’s technical setup is unfolding against a backdrop of shifting regulatory perception, particularly following the SEC’s settlement with Ripple Labs in 2023 and subsequent classification guidance that has softened institutional resistance to the asset.
Since the regulatory clarity emerged, XRP inflows into spot trading vehicles have accelerated, with several asset managers filing or expressing intent to launch spot XRP products, a structural shift absent from prior consolidation cycles.
This regulatory tailwind contrasts sharply with 2021-2022, when XRP faced SEC litigation that depressed institutional adoption and contributed to sustained downward pressure during prior consolidations.
The timing of this technical breakout window coincides with industry expectations for spot ETF approvals in major markets, a catalyst that historically precedes sustained institutional capital reallocation.
Should regulatory approval materialize within the next quarter, analysts anticipate such a decision would provide fundamental support for a breakout above $1.40, $1.45 resistance, potentially collapsing the current consolidation range within days rather than weeks.
Conversely, regulatory delays or adverse guidance could reinforce the $1.30 support floor and extend the range-bound structure into late 2025.
Market participants are monitoring the next U.S. Securities and Exchange Commission comment period or guidance issuance on spot XRP products, with several industry sources indicating preliminary filing submissions expected by Q1 2025, a decision that would either validate the bullish technical setup or force traders to reassess the risk-reward of holding positions ahead of regulatory headwinds.
Original reporting: cryptopotato.com