Binance co-founder Changpeng Zhao (CZ) confirmed he is officially divorced and offered OKX founder Star Xu a $1 billion bet to prove it.
The challenge came after Xu questioned CZ’s marital status as part of a broader dispute triggered by CZ’s 457-page memoir “Freedom of Money,” released on April 8.
I typically ignore all these false claims attacks. But…
You can apologize now. I am officially divorced.
I won’t post any legal docs online, as I respect privacy of my ex-wife, and I appreciate the time we spent together.
Xu demanded that CZ produce a divorce agreement signed by both parties.
He said he would publicly apologize if CZ could present the document. If not, he argued, the claim would amount to public misrepresentation.
I typically ignore all these false claims and attacks. But… You can apologize now. I am officially divorced,” wrote CZ.
CZ responded by confirming his divorce and proposing a permanent wager of $1 billion. He stated he would not share legal documents online out of respect for his ex-wife’s privacy.
However, he offered to have lawyers verify the agreement if Xu accepted the bet.
“I am happy to bet $1 billion USD (or any number you choose) that: I am officially divorced (way before today),” CZ added.
He gave Xu a 24-hour window to respond, adding that silence would reveal who had been misleading the public.
A Feud Rooted in a Decade of Rivalry
The divorce dispute is the latest front in a conflict that dates back to 2014. CZ served as chief technology officer at OKCoin, the predecessor to OKX.
Their falling out over equity, a Bitcoin.com domain contract, and forgery allegations have resurfaced multiple times.
CZ’s memoir also claims Huobi founder Li Lin told him in 2025 that Xu had reported him to Chinese authorities. Xu has denied that claim.
“Both OKX and Binance are regulated by multiple regulators. As the UBO of a regulated company, publicly offering a $1 billion bet is hardly professional conduct,” Xu responded to CZ’s invitation.
The OKX executive also called on the attention of Binance’s regulators to CZ’s offer, questioning whether Changpeng Zhao’s Binance stake has been legally separated with his ex-wife.
“Bill Gates and Jeff Bezos have already shown what proper asset separation looks like in a divorce,” he added.
Yi He, the co-CEO of Binance, is the long-term life partner (romantic and business) and the mother of three of CZ’s children. Reportedly, CZ has five kids total, two from his previous marriage.
They met in 2014 while working at the crypto exchange OKCoin (she recruited him), and became a couple around that time, and co-founded Binance together in 2017.
Amid the ongoing talks between CZ and Star Xu, Yi He has come to her own defense, highlighting her role as the second largest shareholder and Co-CEO of Binance.
“I’m not some delicate wife literature female protagonist; I’m the second largest shareholder and Co-CEO of Binance who continues to fully suppress competitors even after CZ stepped down,” she articulated.
Binance is successfully courting institutional trading activities, but a growing wave of data security alarms on its retail front threatens to complicate the firm’s ambitions.
The world’s largest cryptocurrency exchange by market capitalization has started 2026 with explosive momentum in its over-the-counter trading division. In January and February alone, Binance’s OTC platform recorded 25% of its total volume for all of 2025.
Captcha Bypass Exposes 1.5 Million Binance Users in Scraping Attack
This sharp rise reflects a broader market maturation, as large-cap investors and institutional players increasingly seek private execution channels for massive trades.
Binance CEO Richard Tengexplained that these entities prioritize deep liquidity to avoid slippage and market disruption. The exchange’s OTC desk allows buyers and sellers to execute block trades directly, shielding their strategies from public order books.
On March 28, cybersecurity platform VECERT reported that a threat actor operating under the alias PexRat offered a private database containing the personal information of 1.5 million Binance users for sale.
Our Analyzer platform has detected one of the most critical threats to the cryptocurrency sector so far this year. Threat actor PexRat has put up for sale a private database affecting approximately 1.5… pic.twitter.com/IjgHL3DwMR
The leaked data purportedly includes full names, email addresses, phone numbers, and Know Your Customer verification statuses.
More alarmingly, the threat actor claims to possess victims’ last-login IP addresses, device user agents, and two-factor authentication statuses. This includes whether users rely on SMS, email, or dedicated authenticator apps.
Meanwhile, the potential exposure of 2FA logs and KYC data presents a severe operational risk. It leaves compromised users highly vulnerable to targeted SIM-swap attacks and sophisticated phishing campaigns.
Crucially, VECERT’s analysis of the authentication logs and sample data revealed that Binance’s internal servers were not directly breached. Instead, the firm outlined a sophisticated credential stuffing and scraping operation.
“The evidence suggests that the attacker managed to bypass or abuse security mechanisms (such as Captcha) in the login interface or some platform API, allowing a constant flow of unblocked requests,” VECERT explained.
This incident follows a January report by cybersecurity researcher Jeremiah Fowler, who uncovered roughly 420,000 Binance-linked credentials exposed via similar infostealer malware.
Ultimately, these events present a critical stress test for Binance’s cybersecurity practices, as the exchange cannot afford the continued automated scraping of its users’ data.
The Kansas City Federal Reserve Bank is being investigated by Senator Maxine Waters for granting Kraken access to a limited-purpose master account.
On the other hand, an investigation into Balmain’s ties to President Trump’s family has been launched just days after Eric Trump publicly claimed the family’s crypto ventures have generated over $1 billion in revenue.
Rep Waters pushes investigation into Kansas City Federal Reserve Bank
Representative Maxine Waters, the ranking Democrat on the House Financial Services Committee, has launched an investigation into the Federal Reserve Bank of Kansas City over its decision to grant the crypto exchange firm, Kraken, a limited-purpose master account.
In a letter sent to Kansas City Fed President Jeff Schmid, Waters pointed out that neither federal statute nor the Federal Reserve Board’s Account Access Guidelines mentions a “limited purpose account” as a valid account type.
She requested that Schmid clarify the account’s terms and provide information about the approval process.
Waters’ questions include whether Kraken’s account gives it access to FedACH, Fedwire, or FedCash services, and whether the exchange faces any balance limits, overdraft restrictions, or enhanced supervisory requirements beyond Wyoming’s Special Purpose Depository Institution rules.
The Kansas City Fed granted the account to Payward Financial, which does business as Kraken Financial, for an initial one-year term. The regional bank said at the time it was trying to maintain a system that “supports a level competitive field and reinforces the stability and resilience” of Fed payment systems.
The Bank Policy Institute said it was “deeply concerned” that the approval came before the Federal Reserve concluded on a policy framework for such accounts. The group criticized the lack of transparency around both the approval process and risk measures.
Waters gave the Kansas City Fed until April 10 to respond. She described the matter as one of “critical importance to the development and oversight of our financial system.”
Bitmain and Trump family ties under scrutiny
Senator Elizabeth Warren has written to the Commerce Department specifically requesting for records of communications between Bitmain and Eric Trump and Donald Trump Jr., as well as communications between the company and Commerce Department officials.
She also requested information about the specific actions the agency has taken to keep the Commerce Department’s national security decisions uninfluenced by firms that have business ties to the Trump family.
In late 2025, the Department of Homeland Security reportedly launched an investigation codenamed “Operation Red Sun” to examine whether Bitmain’s ASIC miners could be remotely accessed for espionage or to disrupt the U.S. power grid.
Previous shipments of Bitmain equipment have been halted, and the use of its mining machines near U.S. military bases has been flagged as a significant national security concern.
Bitmain has so far denied the allegations. American Bitcoin Corp, a Trump-backed company, previously purchased 16,000 Bitmain mining machines for $314 million.
The senator is in the minority in the Senate, so she cannot force a response from the Commerce Department, but her request for documents puts public pressure on the agency.
Trump family’s billion-dollar crypto earnings
Days before either investigation was launched, Eric Trump publicly claimed that his family’s crypto projects, including a memecoin, NFT collections, and the World Liberty Financial platform, have brought in over $1 billion in revenue
The TRUMP memecoin, launched in early 2025, contributed approximately $350 million in revenue from token sales and trading activity.
The family also entered the NFT market between 2022 and 2024, releasing four collections of Trump-themed digital collectibles.
World Liberty Financial (WLFI), a crypto platform associated with the family that includes a governance token and a dollar-backed stablecoin called USD1, has reportedly raised substantial funds through token sales and partnerships.
“Crypto’s been incredible and it came out of us being debanked,” Eric Trump said. “It is the future of finance and as a family we’re all in.”
The Hyperliquid price prediction anticipates a high of $58.45 by the end of 2026.
In 2029, it will range between $136.37 and $155.85, with an average price of $146.11.
In 2032, it will range between $233.78 and $253.26, with an average price of $243.52.
Hyperliquid is a leading decentralized exchange (DEX). It has its own Layer 1 blockchain, and HYPE is its native token, which is used for staking, governance, and payments within the ecosystem.
One of the key features of Hyperliquid, along with its high-speed platform, is that it offers crypto perpetual futures for trading by its users without the need to own the asset. The platform supports a number of cryptocurrencies, including but not limited to BTC, ETH, SUI, AVAX, and SOL, to name a few.
Technically, the Hyperliquid blockchain is based on two protocols, namely HyperEVM and HyperBFT; combined, they help provide high-speed trading and Ethereum-based smart contracts with reliability to support the Hyperliquid ecosystem.
The Hyperliquid platform revolves around community participation, as token holders have voting rights to govern and influence developments taking place on the platform.
On November 29, 2024, Hyperliquid conducted an airdrop of its native token, HYPE, but unlike other players, it was selective in allocating the airdrop to only 94,000 users with an average value of $45,000 to $50,000, making it one of the most worthy airdrops in crypto history.
Let’s take a deep dive into what the future holds for the HYPE token in Cryptopolitan’s Hyperliquid price prediction for 2026 and beyond.
Overview
Cryptocurrency
Hyperliquid
Token
HYPE
Price
$38.41 (-1.44%)
Market Cap
$9.85B
Trading Volume
$260.05M
Circulating Supply
256.39M HYPE
All-time High
$59.30 (Sep 18, 2025)
All-time Low
$3.2 (Nov 29, 2024)
24-hour High
$39.32
24-hour Low
$38.08
Hyperliquid Price Prediction: Technical Analysis
Metric
Value
Price Prediction
$28.87 (-24.77%)
Price Volatility (30-day variation)
12.63%
50-Day SMA
$33.47
200-Day SMA
$34.22
Market Sentiment
Bullish
Fear & Greed Index
13 (Extreme Fear)
Green Days
17/30 (57%)
Hyperliquid Price Analysis
TL;DR Breakdown:
Hyperliquid price analysis confirms a downward trend at $38.41.
Cryptocurrency has lost 1.44% of its value.
HYPE token faces strong resistance around the $43.29 range.
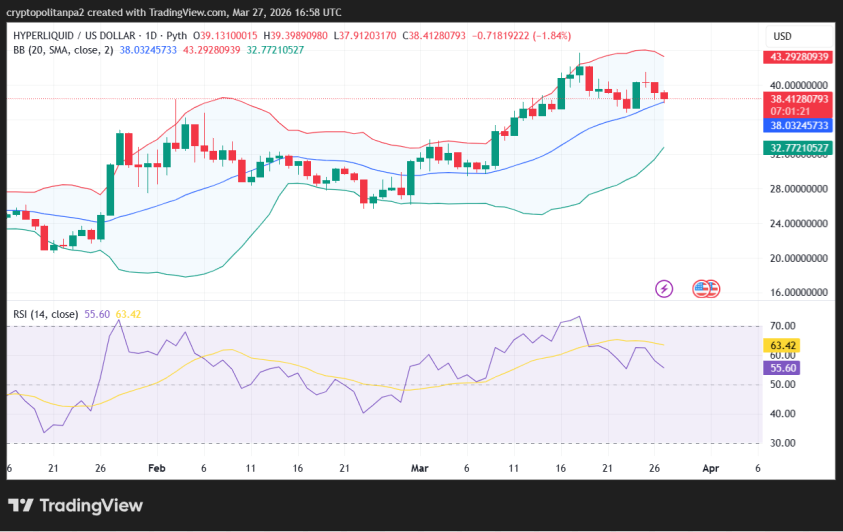
On March 27, 2026, Hyperliquid price analysis revealed a downward trend for the altcoin. The coin is trading at $38.41 after finding resistance at $40.36. From an overall perspective, the currency lost a significant 1.44% in its value in the last 24 hours. The decrease creates relatively unfavorable circumstances for investors, as the altcoin is now shedding value. However, market conditions appear risky, as the token may continue to correct following the recent dip.
HYPE/USDT 1-day chart analysis
The one-day price chart of Hyperliquid Coin confirmed a bearish trend in the market. The cryptocurrency’s value decreased to $38.41 during the day, as bears strive to suppress the price further. At the same time, a red candlestick on the price chart signifies the presence of bearish elements. Sellers are leading the price action, as the coin is losing value as a result of the return of the bearish trend.
The distance between the Bollinger Bands defines the level of volatility. This distance is wide, leading to high volatility levels, as the bands are expanded. Moreover, the upper limit of the Bollinger Bands indicator, indicating resistance, has shifted to $43. Conversely, its lower limit, indicating support, has moved to $32.
The Relative Strength Index (RSI) indicator is trending in the neutral region. The indicator’s score has decreased to 55 today. This condition is reflected by a downward-pointing RSI curve. If selling activities continue to intensify, the indicator’s reading can decrease further towards the index 50.
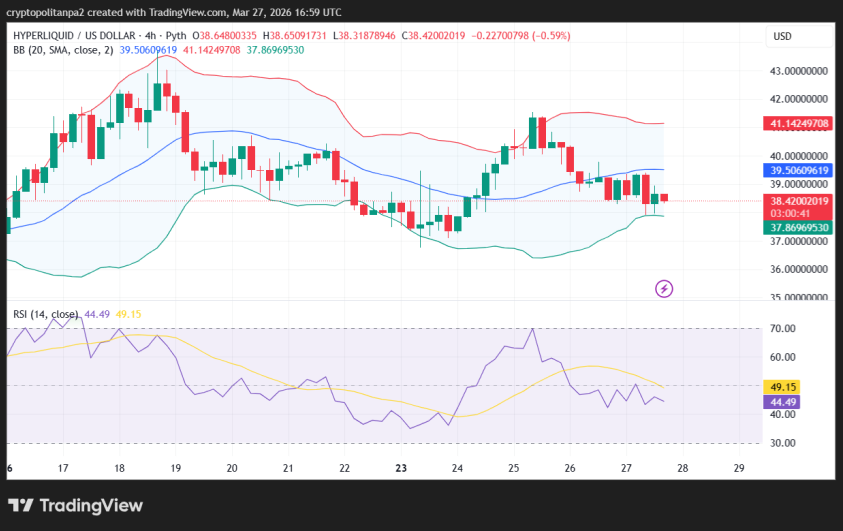
HYPE/USDT 4-hour chart analysis
The four-hour price analysis of Hyperliquid also indicates negative sentiment in the market. The HYPE/USD price has decreased to $38.42 over the past few hours as selling pressure returns. The increasing volatility also suggests a high probability of an imminent reversal or further price depreciation.
The Bollinger Bands have slightly diverged as the distance between them has increased, resulting in high volatility levels. This condition typically signifies more market unpredictability. Technically, the upper Bollinger Band has shifted to $41, indicating a resistance level. Conversely, the lower Bollinger Band has moved to $37, indicating a strong zone of support.
The RSI indicator is trending in the neutral region for now. The indicator’s value has decreased to 44 in the last four hours. Overall, selling activity remained high during the last four hours of the day, which has resulted in a decrease in the indicator’s score.
Hyperliquid Technical Indicators: Levels and Action
Daily simple moving average (SMA)
Period
Value ($)
Action
SMA 3
35.63
BUY
SMA 5
36.06
BUY
SMA 10
38.13
BUY
SMA 21
36.65
BUY
SMA 50
33.47
BUY
SMA 100
29.91
BUY
SMA 200
34.22
BUY
Daily exponential moving average (EMA)
Period
Value ($)
Action
EMA 3
36.01
BUY
EMA 5
34.01
BUY
EMA 10
31.26
BUY
EMA 21
29.10
BUY
EMA 50
29.76
BUY
EMA 100
32.98
BUY
EMA 200
34.79
BUY
What to expect from Hyperliquid price analysis?
Hyperliquid price analysis gives a bearish prediction regarding ongoing market events. The coin’s value decreased to $38.41 in the past 24 hours, as it is receiving negative sentiment today. According to an overall analysis, the currency lost 1.44% in its value today. Technical indicators give bullish signals, but the price charts showcase a bearish market scenario at the time of writing.
Why is Hyperliquid down?
The cryptocurrency market is showing negative trends, and HYPE is receiving the same sentiment. Moreover, it is encouraging that HYPE marked a new ATH a few months ago, on September 18, 2025. However, from a broader perspective, the HYPE price decreased to $38.41, losing 1.44% in its total value today.
Is Hyperliquid a Good Investment?
HYPE has growing utility, and its Ethereum compatibility helps it steal a share of DeFi industry. While the technical analysis can change from bullish to bearish, price predictions paint a different picture. However, a risk analysis is recommended.
Will Hyperliquid reach $50?
The current price action does justify predicting a $50 target. In the cryptocurrency market, things change rapidly, but if the token maintains its price levels, a rally can be initiated. It can be expected that HYPE will reach above $50 by any time in 2026 once again, as it did in September and October.
Can Hyperliquid Coin reach $100?
According to Hyperliquid price prediction, HYPE price might surpass $100 in 2028. The highest price HYPE could attain that year is expected to be above $123.38.
Will Hyperliquid reach $500?
According to crypto analysts’ price predictions, Hyperliquid may not reach this level in the next five years. Considering the current market cap of the token, it seems like far target.
Will Hyperliquid reach $1000?
Per the Cryptopolitan’s HYPE price prediction, Hyperliquid is unlikely to reach $1000 before 2032.
How high can Hyperliquid go?
The highest expected price for Hyperliquid is $253.26, which it will achieve in 2032.
Does Hyperliquid have a good long-term future?
Hyperliquid is trading higher than its December 2025 price levels, making it an ideal time for buyers to enter the market. Given its current price and a favorable future valuation of $253.26 by the end of 2032, the asset appears to be a worthwhile investment.
Recent News/Opinions on Hyperliquid
Cryptopolitan reported that Hyperliquid is now offering Brent and WTI futures. The oil trades are available through the HIP-3 framework on the XYZ exchange, as traders bet high on oil as it smashed through $100 for the first time in years. It is important to remember that XYZ:CL, representing WTI oil, entered the top 5 of the most traded futures in the past week.
The Hyper Foundation announced that it will contribute 1 million hype tokens to support the creation of the Hyperliquid Policy Center. The Foundation said the policy center will have a positive impact in favor of clear regulations for decentralized finance.
The Hyper Foundation will contribute 1M HYPE tokens to support the creation of the Hyperliquid Policy Center.
The tokens will be unstaked later today. The Hyperliquid community will benefit from having representation in Washington, D.C., and we are confident that under… https://t.co/Vgo95Nrr17
This month, Hyperliquid is expected to reach a high of $40.48, with an average price of $29.32 and a minimum trading price of $19.78.
Hyperliquid Price Prediction
Minimum price
Average price
Maximum price
Hyperliquid price prediction March 2026
$19.78
$29.32
$40.48
Hyperliquid Price Prediction 2026
The price of HYPE is predicted to reach a minimum value of $14.31 in 2026. Traders can anticipate a maximum value of $58.45 and an average trading price of $48.70 throughout this year.
HYPE Price Prediction
Minimum price
Average price
Maximum price
Hyperliquid price prediction 2026
$14.31
$48.70
$58.45
Hyperliquid Price Predictions 2027 – 2032
Year
Potential Low ($)
Potential Average ($)
Potential High ($)
2027
71.43
81.17
90.91
2028
103.90
113.64
123.38
2029
136.37
146.11
155.85
2030
168.84
178.58
188.32
2031
201.31
211.05
220.79
2032
233.78
243.52
253.26
Hyperliquid (HYPE) price prediction 2027
The year 2027 will experience more bullish momentum. According to the Hyperliquid price prediction, it will range between $71.43 and $90.91, with an average trading price of $81.17.
Hyperliquid crypto price prediction 2028
The Hyperliquid price prediction climbs even higher into 2028. According to the projections, the price of HYPE will range between $103.90 and $123.38, with an average of $113.64.
Hyperliquid coin price prediction 2029
According to our Hyperliquid (HYPE) price prediction for 2029, we expect a maximum price of $155.85, a minimum price of $136.37, and an average price of $146.11.
Hyperliquid price prediction 2030
As per the HYPE price prediction for 2030, it will reach a maximum price of $188.32 and a minimum price of $168.84, with an average price of $178.58.
Hyperliquid price prediction 2031
The Hyperliquid forecast for 2031 suggests a price range of $201.31 to $220.79 and an expected average trading price of $211.05. This long-term prediction also hinges on HYPE’s rising global recognition and adoption.
Hyperliquid prediction 2032
The Hyperliquid price forecast for 2032 is a high of $253.26. According to the HYPE coin price prediction, it will reach a minimum price of $233.78 and average at $243.52.
While the short-term sentiment keeps flickering, we anticipate Hyperliquid will trade higher in the coming years. The coin will achieve a high of $58.45 before the end of 2026. In 2027, it will range between $71.43 and $90.91, with an average of $81.17. However, you should note that HYPE is still quite volatile. Negative market sentiment, such as market crashes, could derail the predictions.
The native token of Hyperliquid, called HYPE, was launched on November 29, 2024, through an airdrop targeted at a limited number of only 94,000 users.
This was one of the most lucrative airdrops, with an average allocation of value of $45,000 to $50,000.
Hyperliquid kept away from venture capitalists, who usually get most of the tokens in usual airdrops; rather, 76% of the supply was slated for user-centric initiatives.
Usually, tokens dump after airdrops until the market momentum picks up, but Hyperliquid’s approach helped garner trust, and the token jumped from $4 to $35 from November 2024 to December 22, 2024.
Hyperliquid’s market cap improved during this period, reaching above $8 billion, showing significant growth, as it received super positive market sentiment.
In late December and early January 2025, the HYPE token corrected down to $20.24, shedding significant value as per crypto market data.
Price stabilized through February as it traded in a range of $19.92 to $27.42 before taking a dive at the end of February, when the broader trend turned bearish again.
HYPE stumbled to $12.34 by mid-March, and it touched a low of $10.21 on April 7, 2025, which significantly decreased the market capitalization.
The token saw nothing but improvement in the remainder of the month of April, and its price surged to $18.57 by the end of the month.
On June 16, 2025, HYPE reached a high price of $45.57. A month later, on July 14, it marked another all-time high of $49.75, and on August 27, it discovered the $50.99 level with changing market dynamics.
On September 18, HYPE achieved its ATH at $59.30, and in October, it corrected to $50. At the start of December, the HYPE token price fell to the $31 range.
At the start of 2026, the HYPE token was trending near $25, and in March, it increased to the $33 range, with the broader crypto market still in bearish mode.
Bitcoin’s Coinbase Premium Gap has maintained positive territory for 25 consecutive days—the longest streak since October 2025—signaling renewed institutional buying pressure from American traders. This metric, which measures price differential between Coinbase and Binance, has historically correlated with BTC spot price movements and institutional participation. For institutional investors, this extended premium suggests a potential inflection point in market structure with meaningful implications for capital allocation and exchange selection strategies.
Data from on-chain analytics providers reveals that Bitcoin’s Coinbase Premium Gap has remained in positive territory for the past 25 days, marking the longest sustained streak in several months. This technical indicator—which measures the price difference between Bitcoin traded on Coinbase’s USD pair versus Binance’s USDT pair—has become an increasingly watched metric among institutional market participants seeking to understand where large capital flows are concentrating. The observation comes as Bitcoin has recovered to above $70,000 following a brief pullback from its $75,000 intraweek high, and institutional participation metrics suggest growing confidence among American-based traders and asset managers who predominantly route their cryptocurrency exposure through Coinbase’s regulated platform.
Understanding the Coinbase Premium as an Institutional Signal
The Coinbase Premium Gap functions as a barometer for relative buying and selling pressure across two of the world’s largest cryptocurrency exchanges. When the metric turns positive, it indicates that Bitcoin commands a higher price on Coinbase than on Binance, implying that Coinbase traders are either applying stronger accumulation pressure or experiencing lower selling intensity compared to their Binance counterparts. Conversely, negative readings suggest that Binance traders are driving the market higher, typically reflecting either retail-dominated flows or international capital sources. The significance of this distinction lies in the institutional composition of each platform’s user base: Coinbase serves as the primary custodial and trading venue for American institutions, spot exchange-traded funds, and regulated asset managers, while Binance caters to a more globally distributed and retail-heavy audience.
Historical analysis reveals a pronounced correlation between the Coinbase Premium Gap’s trajectory and Bitcoin’s spot price movements, particularly since the beginning of 2024. During Bitcoin’s descent from its January peak, the 30-hour moving average of the Coinbase Premium Gap deteriorated significantly into negative territory, suggesting that selling pressure among Coinbase users—predominantly institutional entities—was a material driver of the downside. This correlation underscores the outsized influence that American institutional capital exerts on Bitcoin’s price discovery, especially given the concentration of spot ETF custody arrangements on Coinbase and the platform’s status as the preferred trading venue for institutional investors navigating regulatory frameworks and compliance requirements.
The recent 25-day positive streak represents a meaningful shift from the earlier weakness observed in 2024. Beginning in late February, the indicator’s 30-hour moving average began reversing course, transitioning from the negative zone and entering sustained positive territory. This directional shift has maintained upward momentum through the present period, indicating that the price of Bitcoin on Coinbase has continued to rise relative to Binance valuations. The persistence of this premium over nearly a month suggests that the pattern is not merely a temporary anomaly but rather reflects a structural change in institutional demand dynamics among American traders and fund managers.
Market Structure and Institutional Capital Flows
The sustained Coinbase premium gain considerable significance when contextualized within the broader institutional adoption cycle that has accelerated following the approval of spot Bitcoin ETFs in January 2024. These products, which rely on Coinbase as a primary custodian and execution venue, represent a material inflow channel for institutional capital into the cryptocurrency ecosystem. When institutional investors gain or lose conviction about Bitcoin’s near-term prospects, their trading activity typically manifests first on Coinbase before diffusing across other venues. The 25-day positive streak therefore suggests that institutional capital has been accumulating Bitcoin positions, or at minimum, has become net buyers rather than net sellers during this period.
The relationship between Coinbase premium readings and Bitcoin’s price trajectory has proven particularly reliable during periods of institutional repositioning. Earlier in 2024, when the premium gap was deeply negative, Bitcoin was in the midst of a significant selloff, reflecting institutional de-risking and profit-taking. Institutional managers, faced with redemption pressures, margin calls, or tactical portfolio rebalancing, would have been sellers into strength on Coinbase, pushing the platform’s prices below Binance levels. The reversal of this dynamic—with Coinbase now commanding consistent premiums—indicates a fundamental shift in institutional sentiment from defensive to constructive.
The 30-hour moving average chosen by market analysts provides an appropriate time frame for filtering out noise while capturing meaningful shifts in institutional behavior. Monthly and quarterly rebalancing cycles, institutional position reviews, and macro reassessments typically manifest over periods spanning days to weeks. The 30-hour window thus captures medium-term institutional sentiment without overfitting to minute-to-minute volatility or single-day trading anomalies. The consistency of positive readings over this extended period provides stronger evidence of genuine institutional demand than would a few isolated days of Coinbase premium.
Implications for Institutional Investors and Market Structure
For institutional investors, the sustained Coinbase premium gain offers several actionable insights. First, it suggests that American institutional capital has shifted from defensive positioning to constructive accumulation, which carries implications for liquidity provision, execution strategies, and portfolio construction across cryptocurrency allocations. Institutions seeking to establish or expand Bitcoin positions would benefit from monitoring whether this premium persists, as continuation could indicate further institutional demand approaching, while compression or reversal might signal an inflection point. Second, the extended positive streak validates the use of exchange-specific premium metrics as leading indicators for institutional flows, reinforcing the value of on-chain and exchange-level data analysis for investors developing systematic approaches to cryptocurrency trading.
Bitcoin’s concurrent recovery above $70,000, following the earlier retracement from $75,000, demonstrates that price appreciation has accompanied the premium expansion. This correlation strengthens the argument that institutional buying pressure is a material driver of the recent recovery. Rather than price strength emanating from speculative retail activity on global exchanges, the Coinbase premium data suggests that American institutions—the most regulated and professional segment of the cryptocurrency market—are actively participating in the rebound. This distinction carries meaningful implications for the sustainability and institutional credibility of the current price rally.
Looking forward, maintaining the positive Coinbase premium for an extended period would indicate sustained institutional conviction and potentially signal that Bitcoin could establish higher trading ranges. Conversely, a compression or reversal of the premium would warrant attention as a potential warning signal of institutional profit-taking or renewed caution. Institutional traders should continue monitoring this metric alongside other structural indicators, including spot ETF inflows, futures market positioning, and regulatory developments, to maintain a comprehensive view of institutional market dynamics. The 25-day positive streak represents a notable inflection point that warrants close observation as a potential marker of a more durable shift in institutional positioning and market structure.
Kraken Gets a Federal Reserve Master Account. Banks Are Panicking.
For the first time in US history, a crypto bank has direct access to the Federal Reserve’s core payment infrastructure. The banking lobby responded within hours — and their reaction tells you everything about what’s really at stake.
Ashton Addison
Founder & Host, Crypto Coin Show
📡 Reuters/Refinitiv Syndicated
For decades, there was an invisible wall between crypto and real money. Not a regulatory wall. Not a technical wall. A plumbing wall. The Federal Reserve’s master account system — the pipes that move actual dollars between actual institutions — was sealed off from the crypto industry. You could build the best exchange in the world and still had to beg a bank to touch the rails.
That changed this week.
Kraken Financial became the first crypto bank in US history to receive a Federal Reserve master account, granting it direct access to the central bank’s core payment systems including Fedwire. The approval came from the Federal Reserve Bank of Kansas City and marks a historic milestone for an industry that has spent years fighting for legitimacy in the eyes of traditional finance.
1st
Crypto Bank with Fed Access
Fedwire
Direct Settlement Access
<24h
Banking Lobby Response
What a Master Account Actually Means
Until now, Kraken relied on partner banks to move US dollars in and out of its platform. Every deposit and withdrawal passed through an intermediary — adding friction, cost, and counterparty risk. A Federal Reserve master account eliminates that dependency entirely.
With direct Fed access, Kraken can settle transactions itself through Fedwire, the real-time gross settlement system used by virtually every major financial institution in the United States. This means faster deposits and withdrawals for institutional clients, lower operational costs, and — critically — the credibility of operating as a directly connected participant in the US banking system rather than a peripheral player relying on others.
What is a Master Account?
A Federal Reserve master account gives an institution direct access to the Fed’s payment services, including Fedwire for real-time settlement. It is considered essential infrastructure for operating as a bank nationally in the United States. Until this week, access was limited to federally insured depository institutions — traditional banks.
The account approved for Kraken Financial is a “limited purpose” or “skinny” master account — a restricted version that provides access to payment rails but excludes certain services available to traditional banks, such as interest on reserves held with the Fed or access to emergency lending facilities. The Federal Reserve has been developing this structure for non-traditional financial institutions.
The Banking Lobby Responded Within Hours
Within hours of Wednesday’s announcement, major banking trade groups released statements criticizing the decision. The reaction was swift, coordinated, and revealing.
We are deeply concerned that the Federal Reserve Bank of Kansas City has approved an account request before the Federal Reserve Board has finalized its policy framework for those accounts. This action ignores public comment and was issued with no transparency into the process for approval.
Bank Policy Institute — representing JPMorgan, Goldman Sachs, Wells Fargo & Bank of America
The Independent Community Bankers of America echoed the concern, warning that granting crypto institutions access to master accounts “poses risks to the banking system.” The American Bankers Association questioned the timing, arguing regulators should complete rulemaking before granting such approvals.
What they didn’t say, but meant: we didn’t plan for this.
What Banks Are Actually Scared Of
The banking lobby’s objections are framed around process and risk — but the underlying fear is competitive. If Kraken can access the Fed’s settlement infrastructure, every crypto-native institution will apply next. The moat that has protected traditional banks from crypto competition — exclusive access to sovereign payment rails — has developed a crack for the first time.
Kraken Financial operates as a Wyoming Special Purpose Depository Institution, meaning it is not federally insured like traditional banks. Banking advocates argue this creates asymmetric risk: crypto firms gaining the benefits of Fed infrastructure without the same regulatory safeguards applied to conventional banks. It’s a legitimate concern — but it’s also the same argument that has been used to slow crypto’s institutional integration for years.
Trump Picks a Side
The Kraken approval doesn’t exist in a vacuum. This week, President Trump posted directly to the banking industry, accusing major banks of holding crypto legislation hostage while posting record profits.
Trump called out the GENIUS Act and Clarity Act by name — the two pieces of legislation that would establish federal frameworks for stablecoins and digital asset market structure respectively. He warned that without legislative progress, the crypto industry would migrate to China and other jurisdictions building friendlier infrastructure.
The Legislation at Stake
GENIUS Act — Establishes the first federal framework for stablecoin issuance in the United States. Banks have lobbied against provisions allowing stablecoin issuers to earn yield, which would threaten their deposit base.
Clarity Act — Defines which digital assets are commodities versus securities, the question that has paralyzed institutional adoption for years. Both bills remain stalled as banks and the crypto industry negotiate terms.
The sitting president is publicly pressuring the banking lobby in real time, on social media, over crypto legislation. That is not a background policy position. It is a direct political signal with market consequences.
What It Means Going Forward
The Kraken approval is a precedent. If upheld, it opens the door for other crypto-native institutions to seek similar Fed access. The Federal Reserve is still finalizing its framework for skinny master accounts — Governor Christopher Waller indicated the structure could roll out broadly later this year.
The institutions that spent ten years calling this industry illegitimate are now watching it connect directly to the central bank. The legislative window is open. The only question is whether Congress moves before the momentum does.
Crypto’s payment infrastructure is no longer peripheral. It just became sovereign.
Bitcoin is experiencing a complex market moment. Even as geopolitical tensions roil global markets and crypto volatility spikes, on-chain analysis reveals a quieter story unfolding beneath the surface: strategic accumulation by large holders. Exchange outflows have turned decisively negative, with approximately 13,500 BTC withdrawing from major trading platforms in recent weeks, signaling that sophisticated participants may be repositioning at current price levels rather than capitulating.
The divergence between headline uncertainty and subdued supply flows offers a window into institutional and whale behavior that price action alone cannot fully capture. Understanding this dynamic requires examining both the macro backdrop and the granular data that often predicts directional shifts.
Macro Stress Tests Liquidity in Real Time
Escalating Middle East conflicts have injected fresh risk into financial markets broadly. Traditional equity and fixed-income markets have reacted unevenly, with scheduled closures and overnight gaps creating disjointed price discovery.
Cryptocurrency, by contrast, trades continuously. This makes digital assets an unfiltered barometer of macro stress, with volatility and positioning shifts reflecting uncertainty in real time. Sharp price swings have accompanied thinning liquidity as traders reduce exposure and reassess their risk appetite.
Crypto trading operates as a real-time barometer of macro stress while traditional markets intermittently close or gap, creating a unique window into how uncertainty propagates across asset classes.
— Market Structure Analysis
Short-term positioning has turned defensive. Yet this defensive posture is only part of the story. Beneath the surface chop, deeper accumulation patterns suggest that not all participants are retreating—some are repositioning.
Exchange Outflows Point to Quiet Accumulation
Exchange netflows—the balance between coins moving onto and off trading platforms—are among the most reliable leading indicators of investor intent. Sustained outflows typically signal that holders are withdrawing assets into cold storage or long-term custody, reducing the immediately available supply available for trading.
Recent patterns have shifted decisively. Rather than flowing into exchanges ahead of potential liquidation, Bitcoin has been flowing out. According to on-chain analysis, Binance—which custodies approximately 665,000 BTC, or roughly 25% of total exchange reserves—has experienced consistent net outflows since late February.
Key Data Point
Approximately 13,500 BTC has withdrawn from Binance in recent sessions, with a single day accounting for 3,848 BTC in outflows—a substantial movement in the context of current market liquidity.
What makes this pattern significant is its persistence. Across major exchanges aggregated together, netflows have remained negative for seven consecutive trading days. This consistency reduces the likelihood of statistical noise and instead points to coordinated positioning behavior among larger participants.
When coins exit exchanges at scale, they move into wallets outside the trading ecosystem—whether hardware wallets, institutional custody solutions, or other long-term holding vehicles. This mechanically reduces the supply immediately available for sale, tightening the float even if price remains range-bound.
Sustained exchange outflows across multiple platforms suggest coordinated positioning behavior rather than random trading activity, a hallmark of strategic accumulation phases.
— On-Chain Analytics
Industry Context: Institutional Adoption and Custody Evolution
The scale of exchange outflows must be understood within the broader context of cryptocurrency market maturation. Over the past three years, institutional adoption of Bitcoin has accelerated significantly, driven by regulatory clarity, spot ETF approvals in major markets, and the emergence of institutional-grade custody solutions.
Traditional market participants—pension funds, endowments, and registered investment advisors—increasingly require segregated custody arrangements rather than exchange-based holding. Services like Fidelity Digital Assets, Coinbase Custody, and third-party providers such as Kraken and BitGo now manage billions in institutional capital.
This structural shift means that exchange outflows today carry different significance than they did in earlier market cycles. Rather than exclusively indicating retail capitulation or accumulation, they increasingly reflect the natural migration of assets from exchange platforms to institutional custody infrastructure. Large holders withdrawing Bitcoin from Binance may be rebalancing between custodians or moving assets into regulated vault solutions.
The 13,500 BTC exodus from Binance specifically gains context when viewed against Binance’s 665,000 BTC total reserves. While significant, this represents a 2% reduction—within normal rebalancing ranges but substantial enough to signal intentional positioning. When aggregated across Kraken, Coinbase, and other major platforms, the cumulative effect tightens overall exchange supply and may meaningfully impact spot market depth.
Price Correction Creates Strategic Entry Window
Bitcoin has retraced roughly 50% from its cycle highs. Historically, corrections of this magnitude tend to recalibrate risk-reward perceptions among market participants. The current price zone around $66,000–$66,800 appears to be viewed as strategically attractive rather than structurally broken.
This distinction matters. In capitulation environments, holders panic-sell regardless of price. In strategic correction phases, accumulation occurs quietly. The current exchange outflow pattern aligns more closely with the latter scenario.
Price consolidation near these levels, coupled with tightening supply on exchanges, creates conditions for range-bound trading in the near term. Demand remains measured, but the reduction in immediately available supply could support prices if inflows into spot markets materialize.
Technical Context
On the 4-hour timeframe, Bitcoin remains locked in a corrective structure following the early-February breakdown. Price consolidation around $66,800 reflects the tension between residual downside pressure and emerging accumulation behavior.
Market Implications and Broader Trend Significance
The current accumulation pattern arrives at a critical juncture for crypto markets. Bitcoin’s transition to a mature asset class has created bifurcated market dynamics: institutional holders operating on multi-month time horizons alongside retail traders reacting to daily volatility and news flow.
Exchange outflows of this magnitude, persisting across multiple platforms simultaneously, suggest conviction among one market segment while headline-driven uncertainty dominates retail positioning. This asymmetry creates the conditions for significant directional moves once consensus begins to shift.
For the broader cryptocurrency market, Bitcoin’s accumulation phase carries outsized implications. Bitcoin represents approximately 50% of total cryptocurrency market capitalization. Strategic accumulation by large holders typically precedes similar behavior in altcoins, particularly Ethereum and other top-tier assets.
Additionally, the timing of this quiet accumulation relative to geopolitical uncertainty deserves attention. Historically, Bitcoin has been perceived as a hedge against macro stress—a narrative that resurfaces during periods of elevated geopolitical risk. If current accumulation reflects this hedging thesis, it may signal that sophisticated market participants are positioning defensively while simultaneously viewing correction-driven prices as attractive long-term entry points.
Implications for Market Direction
Accumulation does not guarantee immediate upside. The withdrawal of coins from exchanges reduces sell-side pressure but does not automatically ignite demand-driven rallies. Near-term price behavior will likely remain choppy, with geopolitical headlines continuing to inject volatility.
However, the behavior of large holders often precedes directional moves by weeks or months. If exchange outflows persist while new capital enters spot markets, the foundation for expansion would strengthen. Conversely, if inflows reverse without demand support, supply tightening alone may only extend consolidation.
For traders and investors monitoring on-chain signals, the key metric to track is whether outflows decelerate or accelerate from current levels. Persistent outflows coupled with rising spot volumes would suggest conviction among accumulators. A reversal toward inflows would signal renewed distribution risk.
The quiet accumulation currently visible in exchange data represents a test of conviction among sophisticated participants. Whether that conviction translates into sustained price appreciation depends on the durability of those inflows and the stability of the macro backdrop. For now, the divergence between headline uncertainty and subdued supply flows offers a rare window into what Bitcoin’s largest holders actually believe about current valuations.
Looking Forward: Consolidation or Confirmation
The coming weeks will prove decisive in determining whether current accumulation patterns evolve into sustained demand pressure. The key variables to monitor include sustained exchange outflows, entry of institutional capital into spot markets, and resolution of near-term geopolitical uncertainty.
If exchange outflows continue while spot buying pressure emerges, the probability of a range breakout to the upside increases materially. If outflows stabilize at current levels without corresponding demand inflows, Bitcoin could consolidate within a $60,000–$70,000 band for an extended period.
What makes this moment analytically valuable is the clarity provided by on-chain metrics. Rather than relying solely on price action or sentiment surveys, exchange data offers objective evidence of large holder positioning. That evidence currently suggests strategic patience and selective accumulation—not capitulation, but measured optimism regarding medium-term prospects.
Key Takeaways
Approximately 13,500 BTC has withdrawn from Binance since late February, with outflows persisting across major exchanges for seven consecutive days
Exchange netflows—a leading indicator of investor intent—have shifted decisively negative, suggesting strategic accumulation rather than distribution
Institutional custody adoption has fundamentally altered the interpretation of exchange outflows, reflecting both rebalancing and genuine accumulation behavior
Bitcoin’s 50% correction from cycle highs appears to be attracting accumulation rather than triggering panic liquidation
Near-term price behavior is likely to remain range-bound, with direction dependent on whether spot inflows materialize to complement tightening exchange supply
On-chain metrics often precede price moves by weeks, making current outflow patterns potentially significant for medium-term positioning
The divergence between headline uncertainty and underlying accumulation patterns creates asymmetric positioning conditions favorable to directional breakouts
Get weekly blockchain insights via the CCS Insider newsletter.
A significant inflow of XRP tokens into Binance—over 31 million coins worth approximately $45 million—has emerged as a potential headwind for the cryptocurrency’s near-term price recovery. On-chain analysis reveals that institutional and whale-sized holders drove the bulk of this deposit activity, raising questions about whether these large participants are positioning for potential selling pressure in coming sessions.
Exchange Inflows Signal Institutional Positioning
The recent movement of XRP onto one of the world’s largest cryptocurrency exchanges reflects a concentrated distribution among sophisticated market participants. Data breakdown shows that addresses holding between 100,000 and 1 million XRP transferred 14.24 million tokens to Binance, while wallets exceeding 1 million XRP sent another 14.49 million coins. These two cohorts alone accounted for the overwhelming majority of the deposit surge.
Smaller retail holders contributed minimal volume to the inflow pattern. Addresses in the 10,000 to 100,000 token range moved just 2.94 million XRP. This concentration among larger stakeholders underscores the institutional nature of recent activity on exchange order books.
Exchange inflows carry inherent ambiguity—they may signal imminent distribution, but could equally reflect repositioning, hedging activity, or operational liquidity needs.
— On-Chain Market Analysis
In isolation, exchange deposits warrant careful but measured observation. Whales and institutions move capital for multiple reasons: hedging positions, rebalancing portfolios, or preparing for potential exits. However, timing matters. The current market backdrop amplifies the significance of these flows.
Key Metric
Over 31 million XRP tokens moved to Binance in a single session, representing approximately $45 million in liquidity now accessible on exchange order books.
XRP’s Role in the Broader Digital Assets Ecosystem
Ripple’s XRP token occupies a unique position within cryptocurrency markets, distinct from purely speculative digital assets. Originally designed to facilitate cross-border payments and settlement, XRP has evolved into a significant component of institutional crypto portfolios and serves as a testing ground for distributed ledger technology adoption in traditional finance.
The token’s market capitalization consistently ranks within the top five cryptocurrencies globally, with a circulating supply structure that differs markedly from Bitcoin and Ethereum. This supply dynamic creates distinct price formation mechanics and holder concentration patterns. The recent whale accumulation on Binance must therefore be understood within the context of XRP’s specific use cases and institutional adoption trajectory.
Ripple’s ongoing partnerships with financial institutions and central banks have historically influenced XRP’s valuation narrative. Regulatory clarity surrounding the token’s classification—particularly following the 2023 SEC settlement—removed significant uncertainty that had previously depressed institutional participation. This regulatory tailwind has attracted a new cohort of sophisticated investors to XRP holdings.
Bitcoin’s range-bound trading pattern has left the cryptocurrency market without clear directional signals. When the largest digital asset lacks decisive momentum, smaller-cap tokens like XRP typically face elevated downside risk during periods of profit-taking.
Sentiment across the sector remains muted. A cohesive macroeconomic narrative—whether bullish or bearish—has failed to materialize, leaving traders without strong conviction in either direction. XRP, in particular, has struggled to maintain support above the $1.40 psychological level, a critical threshold that previously provided stability.
The combination of institutional whale positioning, soft retail engagement, and absent macro catalysts creates an environment where unexpected selling could cascade quickly. The absence of fresh buying pressure leaves limited buffers against liquidation cascades.
Industry headwinds further complicate the near-term outlook. Cryptocurrency exchanges face intensifying regulatory scrutiny globally, with implications for trading volume and liquidity provision. Spot and derivatives markets have experienced compression in activity levels compared to previous bull market cycles, reducing the depth necessary to absorb large sell orders without significant price impact.
Chart analysis reveals a clearly defined downtrend that originated following XRP’s 2025 peak above $3.50. The asset exhibits successively lower highs and lower lows—a textbook pattern indicating sustained selling pressure rather than consolidation or recovery formation.
XRP currently trades below both shorter-term and medium-term moving averages. These moving averages have transitioned into downward slopes and now function as dynamic resistance zones that cap any attempted rallies. When price sits beneath these technical barriers, each bounce typically encounters fresh supply.
The longer-term moving average, while still angled upward, has flattened considerably in recent sessions. This flattening signals that macro-level momentum has begun to dissipate. For bulls to establish renewed conviction, XRP would need to reclaim and hold above the $1.80–$2.00 zone on substantive volume.
Technical Warning
XRP trades beneath multiple moving average levels that now function as resistance. Without recapture of the $1.80–$2.00 zone on volume, intermediate rallies remain vulnerable to renewed selling.
Volume patterns further reinforce the bearish lean. Speculative participation has cooled markedly compared to earlier rally phases. Lower participation creates thinner order books and amplifies the market impact of any meaningful sell orders—precisely the environment where whale liquidations can trigger sharp drawdowns.
Institutional Flow Implications and Market Structure
The concentration of XRP deposits among institutional-sized wallets reflects broader trends in cryptocurrency market maturation. Institutional participants increasingly employ sophisticated exchange deposit strategies to manage execution, minimize slippage, and position ahead of anticipated market moves. The timing of the 31 million token inflow—coinciding with muted trading sentiment—suggests deliberate positioning rather than reactive liquidation.
Binance’s role as the primary exchange for XRP liquidity amplifies the significance of this deposit activity. The platform accounts for the majority of spot XRP trading volume globally, and disproportionate inflows to a single venue create concentrated sell pressure potential. Historical precedent indicates that similar whale positioning scenarios have preceded 10-15% correction cycles in mid-cap digital assets.
Market microstructure data reveals that order book depth for XRP has contracted meaningfully, with bid-ask spreads widening relative to earlier periods. This deterioration in liquidity conditions would amplify the market impact of institutional sell orders, potentially triggering mechanical stop-loss cascades that accelerate downside moves beyond fundamental justification.
Path Forward and Risk Management
For XRP to mount a genuine recovery attempt, the cryptocurrency must clear multiple technical hurdles. First, price would need to reclaim and stabilize above the $1.80–$2.00 support zone. Accomplishing this feat requires substantive volume—currently absent from the market. Second, shorter-term moving averages would need to pivot from downward slopes to flatter or upward angles, signaling momentum stabilization.
External catalysts that could alter this trajectory include positive regulatory developments from major markets, accelerated Ripple adoption announcements, or macro risk-off sentiment that paradoxically benefits digital assets as uncorrelated portfolio hedges. However, relying on uncertain catalysts represents poor risk management for traders with existing XRP positions.
Until these conditions materialize, any intermediate rallies from current levels should be treated as potential selling opportunities by sophisticated traders. The presence of large whale positions on Binance order books heightens the likelihood that any push higher could trigger profit-taking from institutional holders who recently deposited their holdings.
The confluence of whale concentration, soft sentiment, and deteriorating technical structure suggests that XRP remains vulnerable to testing lower support levels. Traders should monitor real-time price levels closely and establish clear risk management parameters before entering positions in this environment.
The cryptocurrency market operates in cycles, and XRP will eventually find footing. However, the evidence currently suggests that such stabilization has not yet arrived. Patience and disciplined risk management remain paramount for anyone with exposure to this asset. Portfolio managers holding XRP should consider rebalancing strategies that lock in core positions while reducing tail risk exposure to potential liquidation cascades.
Get weekly blockchain insights via the CCS Insider newsletter.
Ethereum has retreated below the $3,000 mark as selling pressure resurfaces across cryptocurrency markets, but on-chain data reveals a counterintuitive picture. Exchange reserves have fallen to their lowest level since 2016, suggesting that underlying supply dynamics may be shifting in ways that could matter significantly for price action ahead. This divergence between price weakness and supply tightness has become increasingly relevant as institutional participation in Ethereum markets expands and self-custody adoption grows among sophisticated investors.
Exchange Reserves Hit Historic Lows
Data shows that total Ethereum holdings across centralized exchanges have declined to approximately 16.2 million ETH, a level not seen since 2016. This represents more than a decade-low milestone for available supply sitting on trading venues. The decline reflects a sustained trend rather than a single withdrawal event, indicating a structural change in how investors are managing their holdings.
When fewer coins reside on exchanges, the immediate supply available for liquidation during market downturns shrinks. This matters because exchanges serve as the primary point where holders convert assets to fiat currency or move between positions. With that inventory tightening, markets become increasingly reactive to demand shocks.
Fewer coins sitting on exchanges typically means less immediate supply available for spot selling, especially during periods of market stress.
— On-Chain Analysis
The trend reflects multiple possible behaviors: investors moving funds to self-custody, deploying capital into decentralized finance protocols, or simply holding in place rather than actively trading. Each scenario suggests reduced selling pressure waiting to emerge from exchange order books. The shift accelerated notably following regulatory clarity in major markets and the emergence of institutional-grade custody solutions, which made self-custody more viable for large holders.
Binance’s Ethereum Inventory Under Pressure
The world’s largest cryptocurrency exchange has experienced its own reserve contraction. Binance’s Ethereum holdings have dropped from roughly 4.168 million ETH earlier this year to approximately 4.0 million ETH currently. The drawdown reflects the broader market-wide pattern but carries particular significance given Binance’s role as a primary liquidity hub for both spot and derivatives trading.
What distinguishes this outflow is its timing relative to price weakness. Typically, when markets decline sharply, retail and institutional traders add capital to exchanges to buy on dips. The absence of meaningful inflows during this period suggests that traders lack conviction in deploying fresh capital at current valuations. This contrasts sharply with previous bear market cycles, where reserve declines were often accompanied by substantial deposit surges as traders repositioned.
Binance specifically has undergone significant operational changes over the past eighteen months, including regulatory challenges and leadership transitions. These dynamics may be influencing deposit patterns independent of pure supply-demand considerations. Nevertheless, the reserve decline remains substantial and consistent with broader exchange-wide trends, suggesting the pattern transcends any single platform’s operational challenges.
Key Data Point
Reserve declines without compensating inflows indicate that sellers are not rushing to increase liquid supply, suggesting a preference for holding over distribution.
This dynamic has historical precedent. Previous periods of declining exchange reserves—particularly those unaccompanied by offsetting deposits—often preceded significant rallies once buyers returned. The mechanism is straightforward: with less supply readily available, any genuine demand surge faces resistance from a depleted order book. The 2015-2016 period, when exchange reserves similarly compressed, preceded the subsequent bull run that carried Ethereum from nascent valuations to sustained prominence.
Industry Context and Market Structure Evolution
The decline in exchange reserves reflects broader industry maturation. Ethereum has evolved from a speculative asset primarily traded on centralized exchanges to a genuine utility layer for decentralized finance, layer-two scaling solutions, and tokenized assets. This evolution naturally encourages long-term holding and alternative storage mechanisms rather than active exchange-based trading.
Institutional adoption has accelerated meaningfully, with institutional investors increasingly utilizing custody providers, hardware wallets, and dedicated infrastructure rather than exchange-based accounts. Major financial institutions entering the Ethereum space prefer segregated custody arrangements that reduce counterparty risk. Additionally, the growth of liquid staking platforms has created an alternative to exchange-based holding; investors can now maintain exposure while generating yield through protocols like Lido, further reducing incentives to keep substantial reserves on trading venues.
Decentralized exchange volume has also grown substantially, providing alternative venues for trading without requiring exchange deposits. This structural shift means that reserve levels may signal something different in 2024 than they did a decade ago—they increasingly reflect deliberate capital allocation toward yield generation and risk reduction rather than simple trading convenience.
Price Action Remains Under Pressure
Currently, Ethereum trades near $2,970, having failed to hold above the $3,000 psychological level. The cryptocurrency attempted a recovery toward the $3,300–$3,400 range earlier in the month but encountered renewed selling at those levels. Short-term technical conditions remain weak, with volatility re-emerging and liquidity thinning near key support zones.
Risk appetite has deteriorated across broader crypto markets, placing defensive pressure on major assets. For Ethereum specifically, the inability to break above $3,000 suggests that buyers lack sufficient momentum to challenge seller concentration at higher prices. This environment typically favors continued downside probing. Macroeconomic headwinds, including geopolitical tensions and uncertainty surrounding central bank policy trajectories, have contributed to this weakness.
While price action looks heavy in the short term, on-chain data is flashing a different signal beneath the surface.
— Market Analysis
However, the disconnect between weak price action and tightening supply creates an asymmetric setup. Should demand conditions improve—whether from institutional inflows, sentiment shifts, or technical recovery—the reduced available supply could amplify upside acceleration. Markets with constrained supply respond more violently to demand changes. This principle holds particular relevance for Ethereum given its substantial institutional adoption trajectory.
Market Implications and Strategic Outlook
What Tightening Supply Signals
Reserve declines alone do not guarantee price appreciation. Supply reduction must be paired with eventual demand recovery to produce meaningful rallies. However, they do alter the structural environment in which price discovery occurs. Think of exchange reserves as the “ammunition” available to sellers; depleted ammunition reduces their ability to defend price levels indefinitely.
For Ethereum investors, the current setup presents a two-phase scenario. In the near term, price weakness may persist as broader market sentiment remains fragile and macroeconomic uncertainty dominates trading decisions. But if that weakness eventually exhausts seller conviction—and supply remains constrained—the recovery could be more forceful than typical corrections. This pattern aligns with historical precedent, where reserve compression preceded multi-month recovery cycles.
The implications extend beyond simple price prediction. Constrained exchange reserves suggest that the market structure is shifting toward more distributed ownership and institutional custody arrangements. This democratization of asset control, while positive for security and decentralization principles, reduces the simple supply-demand levers that characterized earlier crypto market cycles. Future price movements will increasingly depend on fundamental utility adoption, institutional capital flows, and macroeconomic conditions rather than retail-driven exchange dynamics.
The key variables to monitor include:
Whether exchange inflows accelerate, suggesting fresh supply entering the market and potential seller desperation
Price behavior at established support levels between $2,800 and $2,900, which could signal capitulation if breached
Volume patterns during any attempted recovery toward $3,000–$3,200, indicating whether buyers possess conviction
Broader cryptocurrency market sentiment and macroeconomic risk appetite, particularly central bank policy trajectories
Institutional capital flows and custody provider activity, which now drive material supply movements
Historically, when exchange reserves approach multi-year lows, even modest demand recovery can produce meaningful percentage gains. This dynamic has played out repeatedly across bull markets, where supply scarcity on exchanges precedes significant rallies. Current conditions align with that pattern, though timing remains uncertain and may depend heavily on factors outside the cryptocurrency ecosystem.
Conclusion: Supply Constraints as Structural Support
The tension between weak price action and tight supply conditions underscores a fundamental principle in digital asset markets: prices can remain under pressure longer than supply conditions might suggest. Sentiment, leverage, and macroeconomic factors often override structural supply metrics in the short term. That said, supply eventually matters, particularly when reserve declines persist without reversing and are driven by genuine capital reallocation rather than temporary trading patterns.
Ethereum’s current positioning reflects a maturing market transitioning from pure speculation to infrastructure status. The decline in exchange reserves, while notable, represents this evolution rather than indicating imminent price movement in either direction. The cryptocurrency faces genuine near-term headwinds from broader market sentiment, but the underlying supply dynamics have shifted in ways that reduce downside risk materially compared to previous cycles.
Traders and investors should consider this environment as potentially setting the stage for meaningful moves once directional clarity emerges. For longer-term holders, declining exchange reserves typically reinforce conviction in remaining positioned rather than liquidating during weakness. For active traders, the pattern suggests watching for capitulation signals that might indicate a bottom is approaching. For institutions evaluating Ethereum as an allocation, the constrained supply environment reduces tail risks associated with sudden liquidation cascades, historically a material concern in cryptocurrency markets.
The next critical phase will emerge when macroeconomic conditions stabilize or when demand resumes despite current weakness. With substantially less supply available on exchanges to meet that demand, Ethereum’s price response could prove more dramatic than historical precedent would suggest. Until then, patience and monitoring of both price action and reserve flows remain prudent strategies.
Get weekly blockchain insights via the CCS Insider newsletter.
Binance has substantially deepened its operational integration with USD1, the stablecoin connected to President Donald Trump’s crypto initiatives, by converting its BUSD collateral reserves into USD1 on a one-to-one basis. The move signals a fundamental shift in how major cryptocurrency infrastructure relates to emerging Trump-aligned financial platforms, while simultaneously establishing USD1 as a core component of exchange operations rather than a peripheral trading option.
On December 11, 2025, the world’s largest cryptocurrency exchange introduced three new spot trading pairs featuring USD1: ETH/USD1, SOL/USD1, and BNB/USD1. Alongside these listings, Binance implemented a zero-fee swap mechanism allowing users to convert USD1 into competing stablecoins without incurring transaction costs.
These announcements represent far more than routine product additions. The exchange disclosed plans to migrate the entire collateral backing its Binance-Peg BUSD token into USD1, a transition expected to conclude within seven days. This structural realignment embeds USD1 directly into Binance’s collateral and liquidity systems, making it foundational to platform mechanics rather than simply another tradable asset.
Market Response and Trading Activity
Markets reacted swiftly to the expansion of USD1 liquidity pathways. Trading activity across multiple assets, particularly BNB, accelerated following the announcement. Price movements reflected increased buying interest as participants gained easier access to USD1 trading options.
The elimination of swap fees between USD1 and other major stablecoins has created broader accessibility within the ecosystem, fundamentally reshaping how traders interact with stablecoin infrastructure.
— Market Analysis, CCS Trading Desk
Analysts attributed the uptick in trading activity to the newly created liquidity pathways and the removal of friction costs. When major exchanges reduce or eliminate transaction fees on specific asset pairs, trading volumes typically expand as cost-conscious participants increase activity on those routes.
BNB, Binance’s native exchange token, benefited directly from enhanced trading pair availability. The addition of multiple USD1 pathways expanded liquidity channels for the asset, supporting price appreciation amid broader market interest in the Trump-connected stablecoin ecosystem.
Key Development
Binance’s conversion of BUSD collateral into USD1 represents a structural integration rather than a simple listing decision. This change makes USD1 integral to the exchange’s core operations and reserve management.
USD1’s Growing Market Position
USD1 has achieved rapid prominence within the stablecoin landscape. The asset maintains backing through US Treasury bills, cash reserves, and equivalent instruments, guaranteeing one-to-one dollar redemption. This structure aligns USD1 with the reserve frameworks of established stablecoins like USDC and USDT.
The stablecoin’s market capitalization has reached approximately $2.7 billion according to recent data. This valuation positions USD1 among the major stablecoins, a remarkable achievement considering the asset’s relatively recent emergence.
Earlier this year, USD1 facilitated a $2 billion capital investment transaction involving major Abu Dhabi-based institutions. This transaction demonstrated institutional confidence in the stablecoin and underscored its utility within high-value financial arrangements.
Industry Context and Stablecoin Market Evolution
The cryptocurrency stablecoin sector has undergone profound transformation over the past four years. Prior to 2021, stablecoins existed primarily as niche infrastructure assets used within decentralized finance protocols. The emergence of major institutional players, regulatory frameworks, and mainstream adoption has elevated stablecoins into critical financial infrastructure components.
Current market estimates indicate the global stablecoin market exceeds $180 billion in total value locked. USDT maintains dominant market share at approximately $120 billion, with USDC holding roughly $35 billion. USD1’s rapid ascent to $2.7 billion represents penetration of this competitive landscape at unprecedented velocity.
This acceleration reflects institutional recognition of stablecoin utility. Beyond cryptocurrency trading, stablecoins enable cross-border payments, settlement mechanisms, and collateral frameworks that traditional financial infrastructure cannot efficiently provide. Major financial institutions now view stablecoins as essential infrastructure rather than speculative assets.
Binance’s historical role in stablecoin adoption deserves context. The exchange launched BUSD in partnership with Paxos in 2019, creating an alternative to USDT and USDC. BUSD reached peak market capitalization of approximately $18 billion before regulatory pressures on Paxos in 2023 forced reduction of new issuance. Binance’s migration from BUSD to USD1 reflects the practical reality that major exchanges require direct control over stablecoin infrastructure rather than relying on third-party issuers.
Institutional Integration and Regulatory Dimensions
The deepening relationship between Binance and USD1 reflects a broader institutional convergence within crypto markets. Major exchanges increasingly embed emerging stablecoins into core infrastructure rather than treating them as peripheral trading options. This integration pattern suggests confidence in USD1’s long-term viability and regulatory positioning.
USD1’s connection to World Liberty Financial and Trump administration crypto initiatives adds a distinctive political dimension to its market positioning. Unlike stablecoins developed by traditional fintech companies or decentralized protocols, USD1 carries explicit alignment with a political figure and administration.
The embedding of a Trump-aligned stablecoin into Binance’s collateral infrastructure represents a significant institutional vote of confidence in both the asset’s durability and its regulatory future under the incoming administration.
— Senior Analyst, CCS Research
This structural integration also raises questions about regulatory treatment. Stablecoins face evolving regulatory scrutiny globally, and USD1’s political associations may influence how regulators in different jurisdictions view the asset. Binance’s decision to convert its primary collateral reserve into USD1 suggests the exchange anticipates stable or favorable regulatory conditions for the stablecoin.
The move also reflects competitive dynamics within stablecoin markets. Stablecoin competition has intensified as new entrants challenge the dominance of USDT and USDC. USD1’s backing by institutional capital and its integration into major exchange infrastructure provide competitive advantages that earlier stablecoins lacked.
Market Implications and Competitive Positioning
Binance’s approximately $1.9 billion migration of BUSD collateral into USD1 carries profound implications for stablecoin market structure. This movement represents the largest single institutional commitment to USD1 since the asset’s inception. For perspective, this transaction alone increases USD1’s collateral base by approximately 70 percent, fundamentally altering market concentration dynamics.
The shift creates competitive pressure for Tether and Circle, the respective operators of USDT and USDC. Both assets have historically benefited from exchange integration and institutional adoption. Binance’s decision to prioritize USD1 signals that even the largest cryptocurrency exchange may reallocate infrastructure investment based on evolving political and institutional considerations.
Smaller exchanges will likely follow Binance’s lead, creating network effects favoring USD1. Exchange integration drives adoption, which increases collateral requirements, which justifies larger institutional backing, which attracts additional exchange integration. This virtuous cycle positions USD1 for potential acceleration within the stablecoin market hierarchy.
Broader Implications for Crypto Infrastructure
Binance’s actions signal how major cryptocurrency infrastructure operators view emerging political alignments in crypto markets. The elimination of swap fees between USD1 and competing stablecoins effectively subsidizes user migration toward USD1, using Binance’s own balance sheet to accelerate USD1’s adoption.
This strategy differs from traditional product launches, which typically generate exchange revenue through transaction fees. Instead, Binance is investing in USD1’s ecosystem development, suggesting long-term positioning rather than short-term monetization.
The zero-fee swap mechanism also standardizes pricing across stablecoin conversions on Binance. Users can move between USD1 and other major stablecoins without fee considerations, reducing traditional friction in stablecoin markets.
Market Structure
Binance’s conversion of BUSD collateral into USD1 represents approximately $1.9 billion in stablecoin reserve migration. This scale of movement substantially increases USD1’s institutional presence and collateral base.
For traders and cryptocurrency market participants, these developments enhance practical liquidity for USD1 trading while reducing transaction costs. For institutional participants, Binance’s integration signals that USD1 meets institutional-grade infrastructure standards.
The timing of these announcements, coinciding with Trump administration transitions, suggests calculated positioning. Major exchanges often adjust product offerings and infrastructure investments based on anticipated regulatory or political developments. Binance’s expanded USD1 support implies confidence in the stablecoin’s regulatory trajectory.
Future Outlook and Market Trajectories
Looking forward, Binance’s integration of USD1 establishes a new competitive baseline within cryptocurrency infrastructure. Similar integration decisions from other major exchanges would further legitimize USD1’s market position and potentially accelerate institutional adoption across financial services.
Conversely, regulatory headwinds affecting USD1 could pressure Binance’s collateral positioning and necessitate operational adjustments. The stablecoin regulatory landscape remains unsettled, with jurisdictions implementing varying approaches to issuance, reserve requirements, and institutional participation. USD1’s political associations create both opportunities and risks relative to traditional stablecoins.
For cryptocurrency market observers, the Binance-USD1 integration exemplifies how political alignment and institutional infrastructure increasingly intersect within digital asset markets. Major platforms are no longer neutral infrastructure providers but active participants in stablecoin ecosystem development and market positioning. This evolution will shape cryptocurrency market structure for the coming decade as infrastructure decisions reflect political considerations alongside traditional financial metrics.
Get weekly blockchain insights via the CCS Insider newsletter.