An anonymous trader turned a $754 bet into roughly $271,000 in under 48 hours, scoring a 357x return. The windfall came from CZ, a BNB Chain meme coin tied to Binance founder Changpeng Zhao.
Here is how the trade unfolded, what powers the token, and why the story is both inspiring and risky.
In less than 2 days, this lucky trader turned $754 into $271K — a 357x return!
Trader 0xf349 spent just $754 to buy 5.1M $CZ yesterday, which is currently worth $271K.
Over the past 2+ months, he traded 260 tokens, with a 31.88% win rate, and lost money on most of them. But he… pic.twitter.com/0Iv9CFUFeA
How the Trader Scored a Staggering 357x Return With a CZ Meme Coin
A meme coin is a cryptocurrency built around an internet joke, personality, or cultural reference rather than a specific technical use case. The CZ token, known as “The Final Form Bull,” leans entirely on that formula across the BNB Smart Chain.
On-chain platform Lookonchain reported the details. The wallet acquired roughly 5.1 million CZ tokens across three transactions totaling $754.49. Furthermore, the average entry price sat near $0.000147 per token during the early accumulation phase.
The payoff was explosive at its peak. As the token surged, the position’s value skyrocketed to around $271,100. However, the meme coin has since pulled back from 0.0592 to $0.0418, according to GeckoTerminal.
As a result, the holder’s unrealized gains have eased to roughly $246,000, though the trader still holds 100% of the position without selling a single token.
The token itself draws direct inspiration from a viral CZ tweet. On January 17, 2021, Zhao wrote, “Everyone knows I’m a bull. You haven’t even seen my final form yet,” alongside a muscular bull image. As a result, that phrase became legendary crypto folklore.
Launched recently via the Four.Meme platform, CZ meme coin now holds a market capitalization of around $41 million. Furthermore, its 24-hour trading volume briefly topped $80 million during the rally’s peak, reflecting intense speculative interest.
Why This 357x Win Comes With Real Warnings
The trade looks glamorous, but the trader’s history reveals the harsh reality of meme coins. Over the past two months, the wallet made roughly 260 trades with just a 31.88% win rate. Most positions ended in losses.
The CZ phenomenon also reflects the ongoing popularity of Binance-themed meme coins. Low fees and fast transactions on BNB Chain continue to attract retail traders seeking high-volatility opportunities amid an increasingly crowded speculative market.
However, experts caution that such extreme returns remain rare. Meme coins can pump violently and then correct just as sharply. Sustainable success requires discipline, risk management, and the understanding that most participants never achieve life-changing results.
BONK DAO has confirmed that attackers drained an estimated $20 million worth of BONK tokens from its treasury through a malicious governance proposal.
The stolen funds have reportedly started moving to exchanges, prompting the project to coordinate with exchanges, the Solana Foundation, and law enforcement in an effort to recover the assets.
BONK DAO Confirms $20M Governance Attack
BONK DAO has become the latest victim of a high-profile decentralized governance attack after confirming that approximately $20 million in BONK tokens was drained from its treasury.
BonkDAO was the target of a malicious governance proposal resulting in an estimated $20M worth of BONK tokens being drained from the BonkDAO treasury.
During the investigation, BonkDAO identified the exchange wallets used to purchase BONK ahead of the proposal. BonkDAO is…
According to the project’s official statement, the attacker successfully passed a malicious governance proposal, allowing treasury funds to be transferred to wallets under their control. BONK said it has already identified the exchange wallets used to accumulate voting power before the proposal was executed.
The team is now working alongside exchanges, the Solana Foundation, bridges, and law enforcement to track the stolen assets and explore recovery options.
How the Attack Worked
Preliminary on-chain analysis shared by blockchain investigators suggests the attacker purchased roughly $4 million worth of BONK to secure enough voting power for the proposal.
Once approved through BONK DAO’s governance system on Solana’s Realms platform, the proposal authorized the transfer of an estimated $20 million from the DAO treasury.
Unlike a smart contract exploit, the incident appears to be a governance attack, where token-weighted voting was used to legitimately approve a malicious treasury transaction.
Reports also indicate that portions of the stolen BONK have already begun moving to cryptocurrency exchanges, raising concerns that the attacker may attempt to liquidate the holdings.
What’s Next for BONK?
The investigation remains ongoing, with BONK stating that recovery efforts are underway.
The incident is expected to renew industry debate over DAO governance security, particularly around safeguards such as timelocks, multisignature approvals, and treasury execution delays designed to prevent single governance proposals from draining protocol funds.
Investors will now be watching for updates on potential fund recovery, exchange actions, and whether BONK introduces governance reforms to strengthen treasury protection.
A reported Coinbase announcement about a World Cup result, likely using AI, created a problem bigger than a flawed alert. It showed how quickly exchange-run prediction markets can blur the line between tradable outcomes and unverified automated content inside the same consumer app.
The episode surfaced on July 5, when a user posting as jay_drainjr said on X that Coinbase had sent a breaking-news-style alert claiming Norway had won a World Cup game, with Erling Haaland scoring, before the match had been played.
Coinbase CEO Brian Armstrong replied later that day, saying he was looking into it with the team.
Coinbase has not published a full public postmortem as of press time. The public record also does not yet show how many users saw the notification, whether anyone traded after seeing it, or which system generated it. Those unanswered facts are material, but they do not erase the design problem the alert surfaced.
Exchanges are moving toward a product mix in which AI-generated alerts, sports-event contracts, and retail trading interfaces can sit within the same user journey. That means users need to see exactly what has been verified, what is automated, and what remains unresolved before market-adjacent content reaches them.
The timing made the episode sharper. Armstrong had already framed prediction markets as a breakthrough in how markets discover truth, saying in January that Coinbase users in the US could trade outcomes across sports, politics, culture, news, and more through the app’s Predict tab.
Coinbase’s own prediction markets page presents the product as focused on real-world outcomes, while its sports page shows event markets tied to World Cup, goalscorer, correct-score, and other sports outcomes.
That creates a basic tension for any exchange operating this kind of product. If a prediction market is meant to let prices reflect what participants believe will happen, the app also has to preserve the difference between an unresolved event, a live update, and a verified result.
A bad alert becomes market infrastructure when trading is one tap away
A mistaken pre-match alert would be a content failure in most consumer apps. In a trading app, it can become more serious because information and action sit side by side.
Prediction markets are contracts whose value can move as users react to new information. A notification that an event has already occurred can change a user’s understanding before the user sees the market, places a trade, exits a position, or decides to wait.
Even if no trades later show they relied on the alert, the product design has exposed the pressure point.
The reported Coinbase incident therefore belongs in a different category from a generic AI hallucination story. A wrong sentence from a model is embarrassing. A wrong sentence near a tradable event market can appear to be market-relevant information if the app does not indicate whether the event has been resolved.
The later outcome of the match does not settle that risk. If an alert reports a result before a reliable source has resolved the event, it has crossed the key boundary.
In prediction markets, the boundary is between pre- and post-resolution as much as between true and false.
That distinction will become more important as exchanges add more event markets to retail apps. Sports markets are especially sensitive because they produce constant live data, user attention is close, and the line between commentary, odds movement, and outcome confirmation can be thin.
A product can disclaim that users bear risk, but the interface still teaches users what to treat as settled.
Coinbase’s own pages already contain the legal and risk framing that makes the question of standards hard to avoid. The sports prediction market page says prediction markets are offered by Coinbase Financial Markets, a CFTC-registered futures commission merchant and National Futures Association member.
The same disclosure warns that event contracts can result in the loss of the full investment.
The product pages also state that information is provided for informational purposes and is not investment advice. They include language saying Coinbase is not responsible for third-party content errors, delays, or actions taken in reliance on that content.
That kind of disclosure may help allocate legal risk, but it cannot replace product-level clarity.
Users experience one app. If that app shows an event market, pushes a breaking alert, and presents a price that moves with new information, users will naturally treat the information environment as part of the product.
That is where provenance becomes more than a label. A trading app that uses automated alerts around event markets may need to show the source of the claim, the time it was verified, the status of the underlying event, and whether the alert was generated, summarized, or approved by a human.
A simple AI label would be too weak if it does not say whether the event itself has been resolved.
A practical standard would separate at least four states: rumor or social report, scheduled event, live event, and officially resolved result. The user should not need to infer those states from the wording of a push notification.
The app should make the state visible before the user can mistake commentary for settlement.
Latency is also a risk control. Prediction markets can move on seconds-old information. If the app’s alert pipeline is faster than its verification pipeline, the product can push users toward a claim before the market has a reliable basis to treat it as fact.
Speed is valuable only if proof travels with it.
Proof controls have to sit above the contract
The CFTC’s June 12 Federal Register proposal discusses prediction markets as registered venues offering event contracts and frames the category around public-interest determinations, market integrity, manipulation prevention, clear settlement terms, and objective information that can be publicly verified.
Those concepts are usually discussed in relation to the contract itself: what event is being traded, how the outcome is determined, and what conditions trigger settlement.
The Coinbase alert episode points to the layer above the contract. If the market’s settlement criteria are objective but the app’s surrounding content pipeline lacks the same discipline, users can still receive a misleading signal before settlement.
That is the gap exchanges will have to close as prediction markets move from specialist venues into mainstream crypto apps. The settlement rule may say one thing. The app notification may imply another.
The user experiences both as part of the same financial interface.
CryptoSlate has already covered how sportsbooks and prediction markets are converging as event contracts draw more trading interest. That trend raises the stakes for Coinbase because the company’s advantage is distribution.
If event markets live in the same app as spot crypto trading, wallets, alerts, and consumer finance tools, a content failure can travel faster and feel more authoritative than it would on a smaller market-only platform.
The regulatory context also explains why a disclaimer alone is incomplete. Prediction markets depend on clear evidence of what happened and when.
If the content layer can race ahead of that proof, the market still has a trust problem even when the contract’s final settlement criteria are objective.
For consumer exchange apps, verification has to cover both layers. The contract can have objective settlement terms while the surrounding feed still creates confusion if an alert uses final-result language too early.
Controls around content, data vendors, and push timing therefore become part of the same trust system that supports the market.
The next standard is operational
The core Coinbase question is operational. Did the alert come from a model-generated summary, a data vendor, a third-party feed, a human-entered story card, or a mix of those systems?
What source marked the event as resolved? What check should have stopped a pre-match result from being pushed? Could users distinguish a generated alert from an official result?
Those details remain unresolved without a Coinbase postmortem, but the most likely conclusion is clear: exchange-run prediction markets will need visible proof standards before AI-generated alerts can scale alongside tradable outcomes.
Those standards should be measurable. A market operator can log the data source for every event alert, the timestamp when a result becomes eligible to be described as final, separate the generated commentary from the official settlement language, and retain an audit trail for any push notification tied to a tradable market.
It can also prevent content systems from using final-result language until a verified source has crossed a predefined threshold.
The hard part is that these controls may slow down the very alerts that make consumer apps feel timely. That is the tradeoff.
If an exchange chooses speed over provenance, it risks turning the alert layer into an unpriced part of the market structure.
The Coinbase incident is therefore a preview of a larger fight over the credibility of prediction markets. Market prices can serve as useful signals only when users can distinguish among a forecast, a report, and a resolved fact.
As exchanges add AI summaries and real-time alerts, the next competitive standard may shift from who lists the most markets first to who can show the fastest proof without asking users to trust a black box.
Until Coinbase explains the alert pipeline, the unanswered facts remain important. How many users saw the notification, whether anyone traded because of it, and what system generated it are all material details.
The broader lesson is already visible: prediction markets sold as truth-seeking tools need proof infrastructure before automated content becomes part of the trading experience.
Ripple’s XRP has delivered a strong recovery from its recent lows, validating the bullish divergence that developed near support. While the broader market structure remains corrective, the latest rally has pushed the price back toward a critical technical inflection point where the next directional move could be determined.
Ripple Price Analysis: The Daily Chart
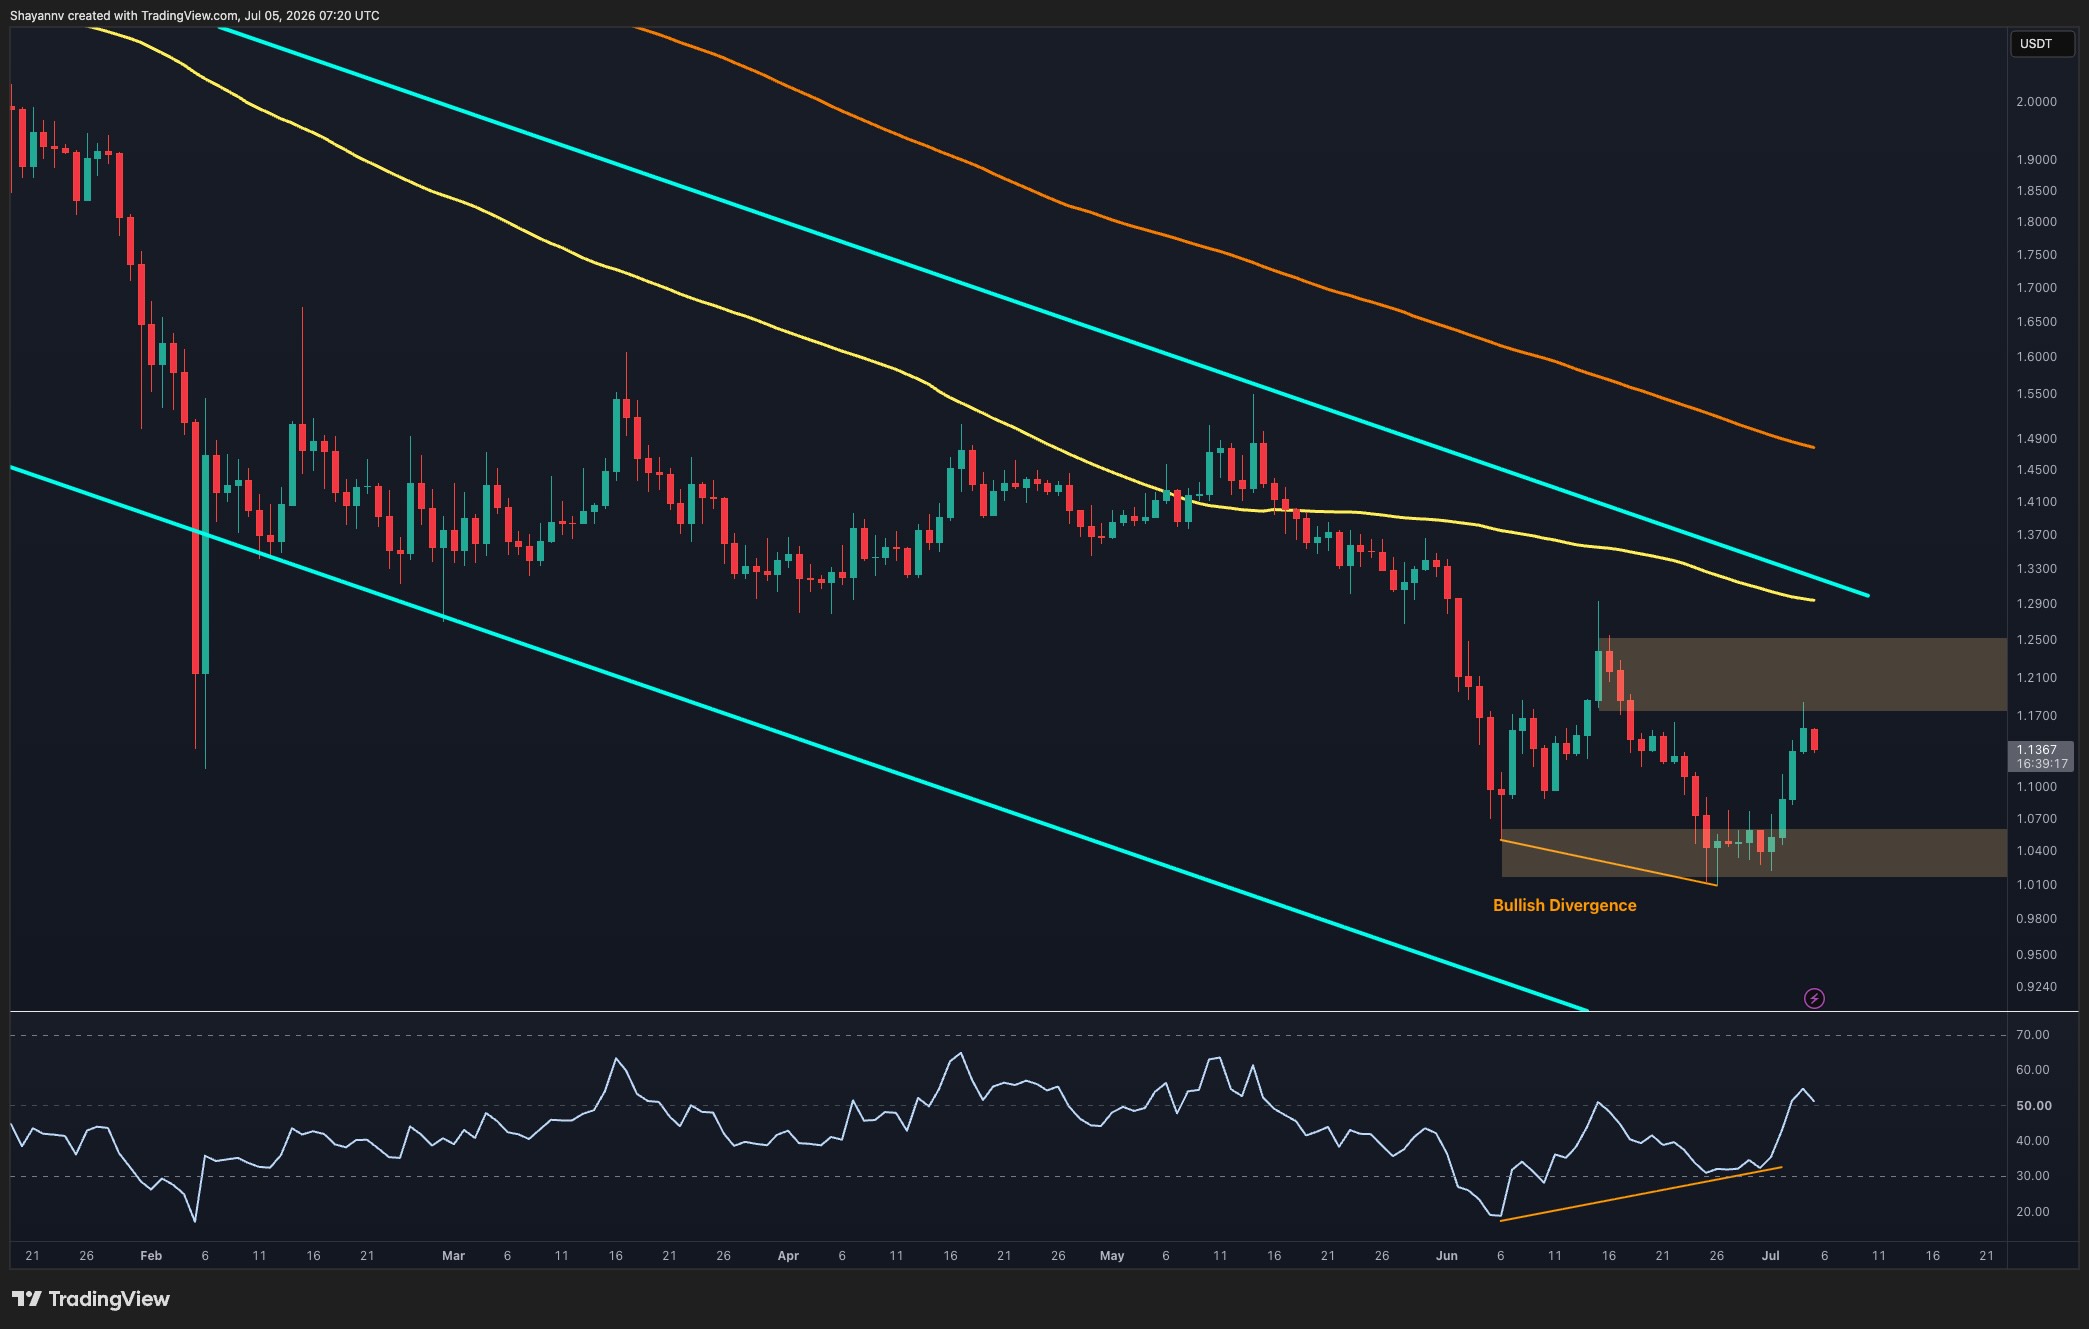
The daily timeframe continues to show XRP trading inside a long-term descending channel, remaining below the major moving averages and the channel’s upper boundary. Despite the broader bearish structure, the recent price action has improved considerably.
The bullish RSI divergence that formed around the $1.02-$1.05 support zone has played out as expected. While the asset was making lower lows, momentum was printing higher lows, signaling weakening selling pressure. Since then, XRP has rebounded sharply and reclaimed the lower support region around $1.02-$1.06.
The recovery has now carried the price toward the first major resistance zone between $1.17 and $1.24. This area previously acted as support before the latest breakdown and is now functioning as supply. The RSI has also pushed back above the midline, confirming improving momentum and strengthening the case for a continued recovery attempt.
However, the broader trend remains bearish as long as the token trades beneath the descending channel resistance and the major moving averages overhead. A successful reclaim of the $1.17-$1.24 region would be the first sign that the market is attempting to build a larger reversal structure.
XRP/USDT 4-Hour Chart
The 4-hour chart provides a clearer view of the recent breakout. XRP spent several days consolidating inside the $1.02-$1.06 demand zone before buyers aggressively stepped in and triggered a sharp rally toward the descending trendline resistance.
The move has already reclaimed the local support area and pushed price directly into the trendline that has capped lower highs since mid-June. XRP is now testing this dynamic resistance as it approaches the lower boundary of the broader $1.21-$1.29 supply zone.
This creates a pivotal setup. A confirmed breakout above the descending trendline would likely open the door for a move into the upper resistance region, where sellers may attempt to regain control. Such a breakout would also confirm a short-term structural shift after weeks of lower highs and lower lows.
On the other hand, failure to break through the trendline could trigger a temporary pullback toward the recently reclaimed support zone. As long as the asset remains above the $1.02-$1.06 area, the current recovery structure remains intact.
For now, momentum favors the bulls in the short term, but the market is approaching a major resistance cluster where a decisive breakout is needed to confirm that the recovery is evolving into something more significant than a relief rally.
Veteran trader Peter Brandt is eyeing a move from Bitcoin into gold, citing a technical breakout in the XAU/BTC ratio. His call has reignited the store-of-value debate, drawing sharp pushback from analysts.
Here is what his chart shows, why the timing matters, and how other analysts read the same setup.
I am contemplating selling some of my Bitcoin and going to Gold with the money. Looks to me that Gold is going to gain substantially on Bitcoin $XAUBTCpic.twitter.com/m4EUqkbh5j
The XAU/BTC ratio measures how many BTC one ounce of gold can buy. A rising ratio means gold is outperforming Bitcoin, while a falling ratio signals the opposite across the market cycle.
Brandt, a respected chartist with over 50 years of experience, sees the ratio turning. His monthly chart shows the pair near 0.067, curling upward from a multi-year base.
Not all market participants accept Brandt’s rotation thesis. Michael Saylor argues Bitcoin’s underperformance stems from liquidity diversion toward AI infrastructure, not a shift into gold. On-chain data supports a more nuanced read of the market.
— Michaël van de Poppe (@CryptoMichNL) July 4, 2026
Analyst Michaël van de Poppe pushed back directly on the chart. “Until Bitcoin doubles, then this entire chart is worthless,” he wrote. His comment underscores the view that Bitcoin’s growth potential could quickly invalidate any relative weakness against gold.
Trader Pablo Heman offered a more balanced take, holding both assets. He sees near-term upside for Bitcoin if it holds above $55,000. However, he stays long-term bullish on gold, citing China’s push to challenge the LBMA pricing structure.
“Wow, Short Bitcoin Long Gold?! What a ballsy call! I hold both, and think BTC at least has a big bounce coming for next few months. As long as BTC stays above 55K it should have a big bounce. But Gold (and silver) I am bullish on for the Long term, like the next 5-10 year, maybe even more! China will now take on LBMA (London) and try to set the spot good price in HK. Most people probably don’t know how much this will change the world of commodities!,” Herman said on X.
For now, the XAU/BTC ratio serves as the clearest scoreboard. A sustained breakout would bolster the gold-over-Bitcoin narrative. However, a rejection could signal Bitcoin regaining momentum, especially as fresh weekly data shows crypto outperforming both gold and equities.
Bitcoin’s rebound has not removed the risk of another volatile move. CryptoQuant is warning that exchange deposit activity has picked up across Bitcoin, Ethereum, and altcoins, a pattern that often appears when traders are preparing to move risk around quickly.
That does not automatically mean a crash is coming. It does mean the market is becoming more sensitive.
For more details, visit the official Cryptoquant platform.
TL;DR
CryptoQuant’s latest market read points to a jump in exchange deposits, including elevated Bitcoin inflows. Rising deposits can be a volatility signal because coins moving to exchanges are more likely to be sold, hedged, rotated, or used as collateral.
The important word is “can.” On-chain deposits are not a perfect sell signal. Sometimes coins move to exchanges for liquidity management, derivative margin, or market-making activity. But when deposits spike while price is already under pressure, traders tend to pay attention.
That is the situation Bitcoin is in now. BTC has stabilised, but the wider market still feels jumpy. ETF flows have been uneven, altcoins are fragile, and macro risk appetite is not giving crypto a clean tailwind.
Why Deposits Matter Here
Exchange inflows matter because they change the available supply profile. Coins sitting in cold storage are usually less likely to hit the market quickly. Coins arriving on exchanges are more flexible. They can be sold, used to open positions, or shifted into other assets.
When a large number of coins arrives at once, the market starts asking why.
If the inflow is driven by whales preparing to sell, spot pressure can build. If it is linked to derivatives positioning, volatility can rise even if the coins are not immediately dumped. If it reflects market makers preparing for higher activity, price can swing both ways.
That is why the signal is more about volatility than direction. The market is being primed for movement.
Bitcoin Needs More Than A Bounce
Bitcoin’s short-term recovery gives bulls room to argue that sellers are losing control. But on-chain deposit pressure complicates that argument.
A healthy rebound usually wants to see coins moving away from exchanges, not toward them. It wants accumulation, calmer leverage, and improving flows. If deposits keep rising, traders may stay defensive even while price holds above recent lows.
The next phase will depend on whether those deposited coins become sell pressure. If Bitcoin absorbs the inflows and holds its recovery, that would be a constructive sign. It would show that the market can handle supply without breaking.
If price rolls over while deposits remain elevated, the CryptoQuant warning will look more serious.
For now, this is not a panic signal. It is a caution flag. Bitcoin has bounced, but the market is still loaded with enough exchange-side activity to make the next move sharp.
This report is based on information from CryptoQuant.
The practical takeaway is that traders should avoid reading the current rebound in isolation. A market can look stable on the surface while exchange-side liquidity is preparing for a larger move. That is why deposit data belongs next to ETF flows, funding conditions, and spot support levels when assessing Bitcoin risk this week.
This article was written by the News Desk and edited by Samuel Rae.
Bitcoin has staged a notable rebound after sweeping liquidity beneath the June lows, but the recovery is now approaching a critical resistance cluster. While momentum has improved in the short term, the broader structure remains bearish until BTC reclaims several major resistance levels overhead.
Bitcoin Price Analysis: The Daily Chart
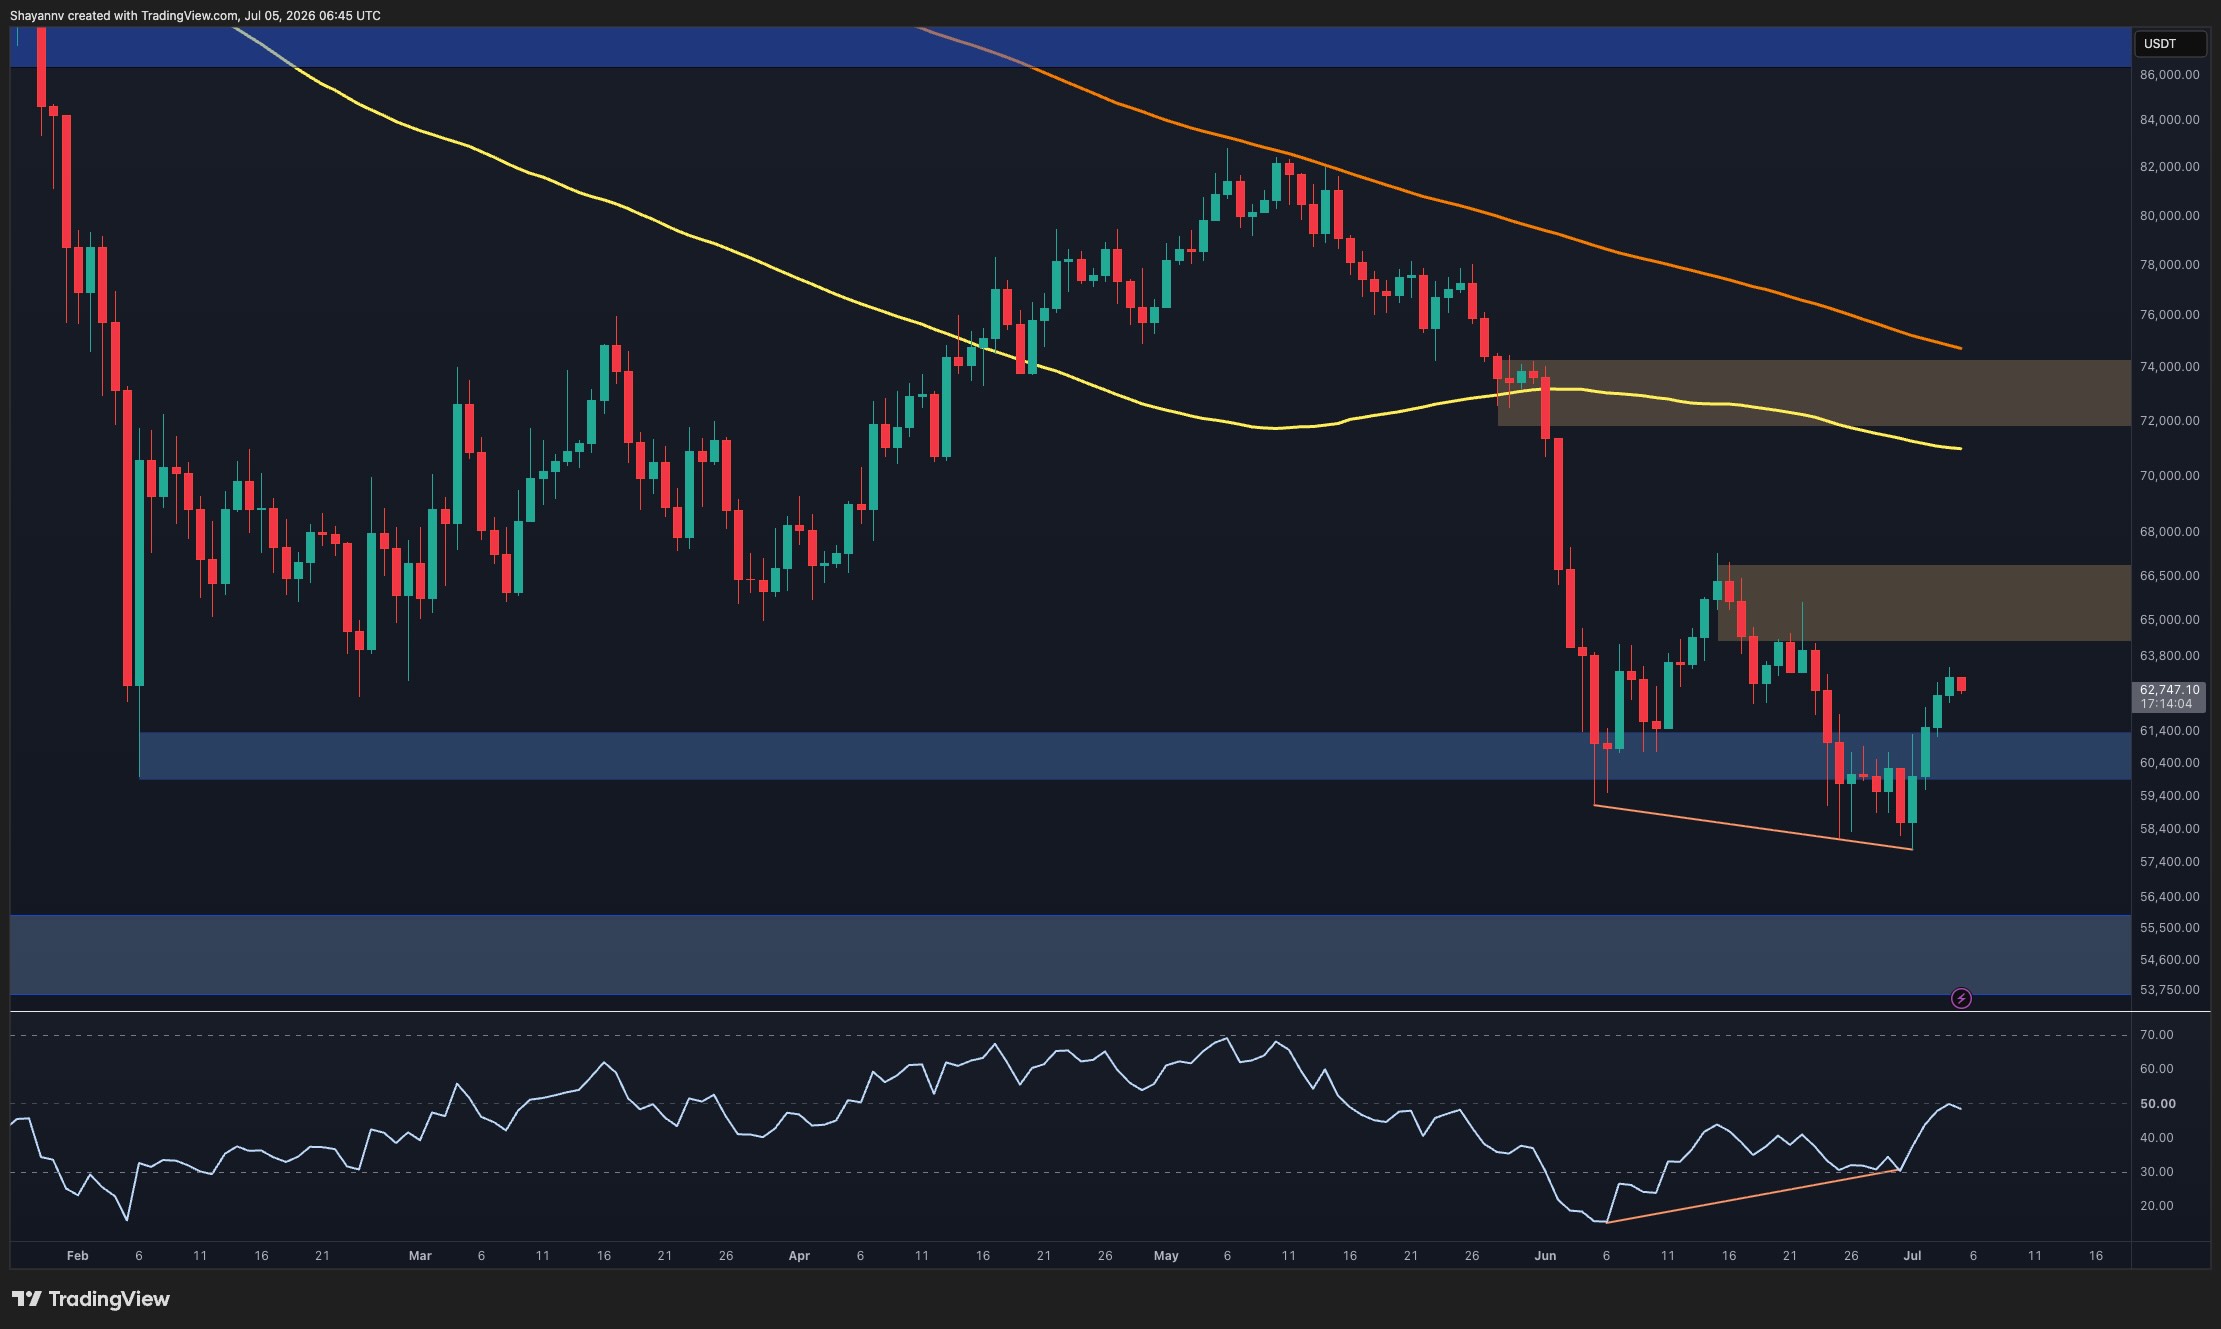
The daily timeframe shows Bitcoin continuing to trade below its key moving averages, with both the 100-day and 200-day moving averages sloping lower and acting as dynamic resistance. The market remains structurally bearish after losing the $72K-$74K support zone in June, which has now flipped into a major supply area.
However, the recent price action is becoming more constructive. BTC successfully defended the $58K-$61K support region and produced a sharp bounce from the lower boundary of the broader descending structure.
More importantly, the daily RSI has formed a bullish divergence, with momentum making higher lows while the price registered comparable or lower lows around the June bottom. This divergence often appears during exhaustion phases and suggests selling pressure has been weakening despite the downtrend.
The immediate challenge lies around $65K-$67K, where a major resistance zone intersects with the descending upper trendline. A successful breakout above this area would likely trigger a larger recovery toward the former breakdown region near $72K-$74K. Conversely, rejection from the current resistance cluster would reinforce the prevailing bearish structure and increase the probability of another move toward the $60K support area.
BTC/USDT 4-Hour Chart
The 4-hour chart highlights a developing falling wedge structure. Bitcoin recently rebounded from the lower boundary near $58K and has advanced steadily toward the upper trendline, which currently converges with the $63K-$64K area.
The recovery has already reclaimed the $60K-$61K support zone, turning it back into a short-term demand area. Price is now testing the upper boundary of the wedge while approaching the lower edge of the $64K-$66.5K supply zone.
A breakout above the descending trendline could accelerate bullish momentum and open the path toward the higher resistance region around $65K-$67K. Such a move would also confirm a short-term shift in market structure after weeks of lower highs.
If the breakout fails, Bitcoin may continue consolidating inside the wedge before attempting another push higher. The $60K-$61K region remains the most important near-term support, while a breakdown below it would place the recent recovery at risk.
Sentiment Analysis
The Spot Average Order Size metric provides insight into the behavior of larger market participants. Recent data shows that whale-sized transactions continue to dominate activity despite Bitcoin trading near local lows.
The latest readings indicate that large orders remain active in the market while prices hover around the $60K-$63K region. Although the metric alone cannot determine directional intent, the persistence of larger transaction sizes during a prolonged decline suggests institutional and high-net-worth participants remain engaged rather than stepping away from the market.
Combined with the bullish RSI divergence on the daily chart and Bitcoin’s defense of the $58K-$61K support zone, the data suggests accumulation interest may be emerging around current levels. Nevertheless, confirmation still requires a technical breakout above the descending trendline and the $65K-$67K resistance cluster.
Until that occurs, Bitcoin remains in a broader corrective structure, with the current recovery appearing more like an attempt to build a base rather than a confirmed trend reversal.
Ethereum has extended its recovery over the past several sessions, breaking above its recent consolidation range and approaching a major confluence resistance area. The rally has improved short-term sentiment, but the market is now testing a zone that could determine whether this move develops into a broader trend reversal or remains a relief rally within the prevailing downtrend.
Ethereum Price Analysis: The Daily Chart
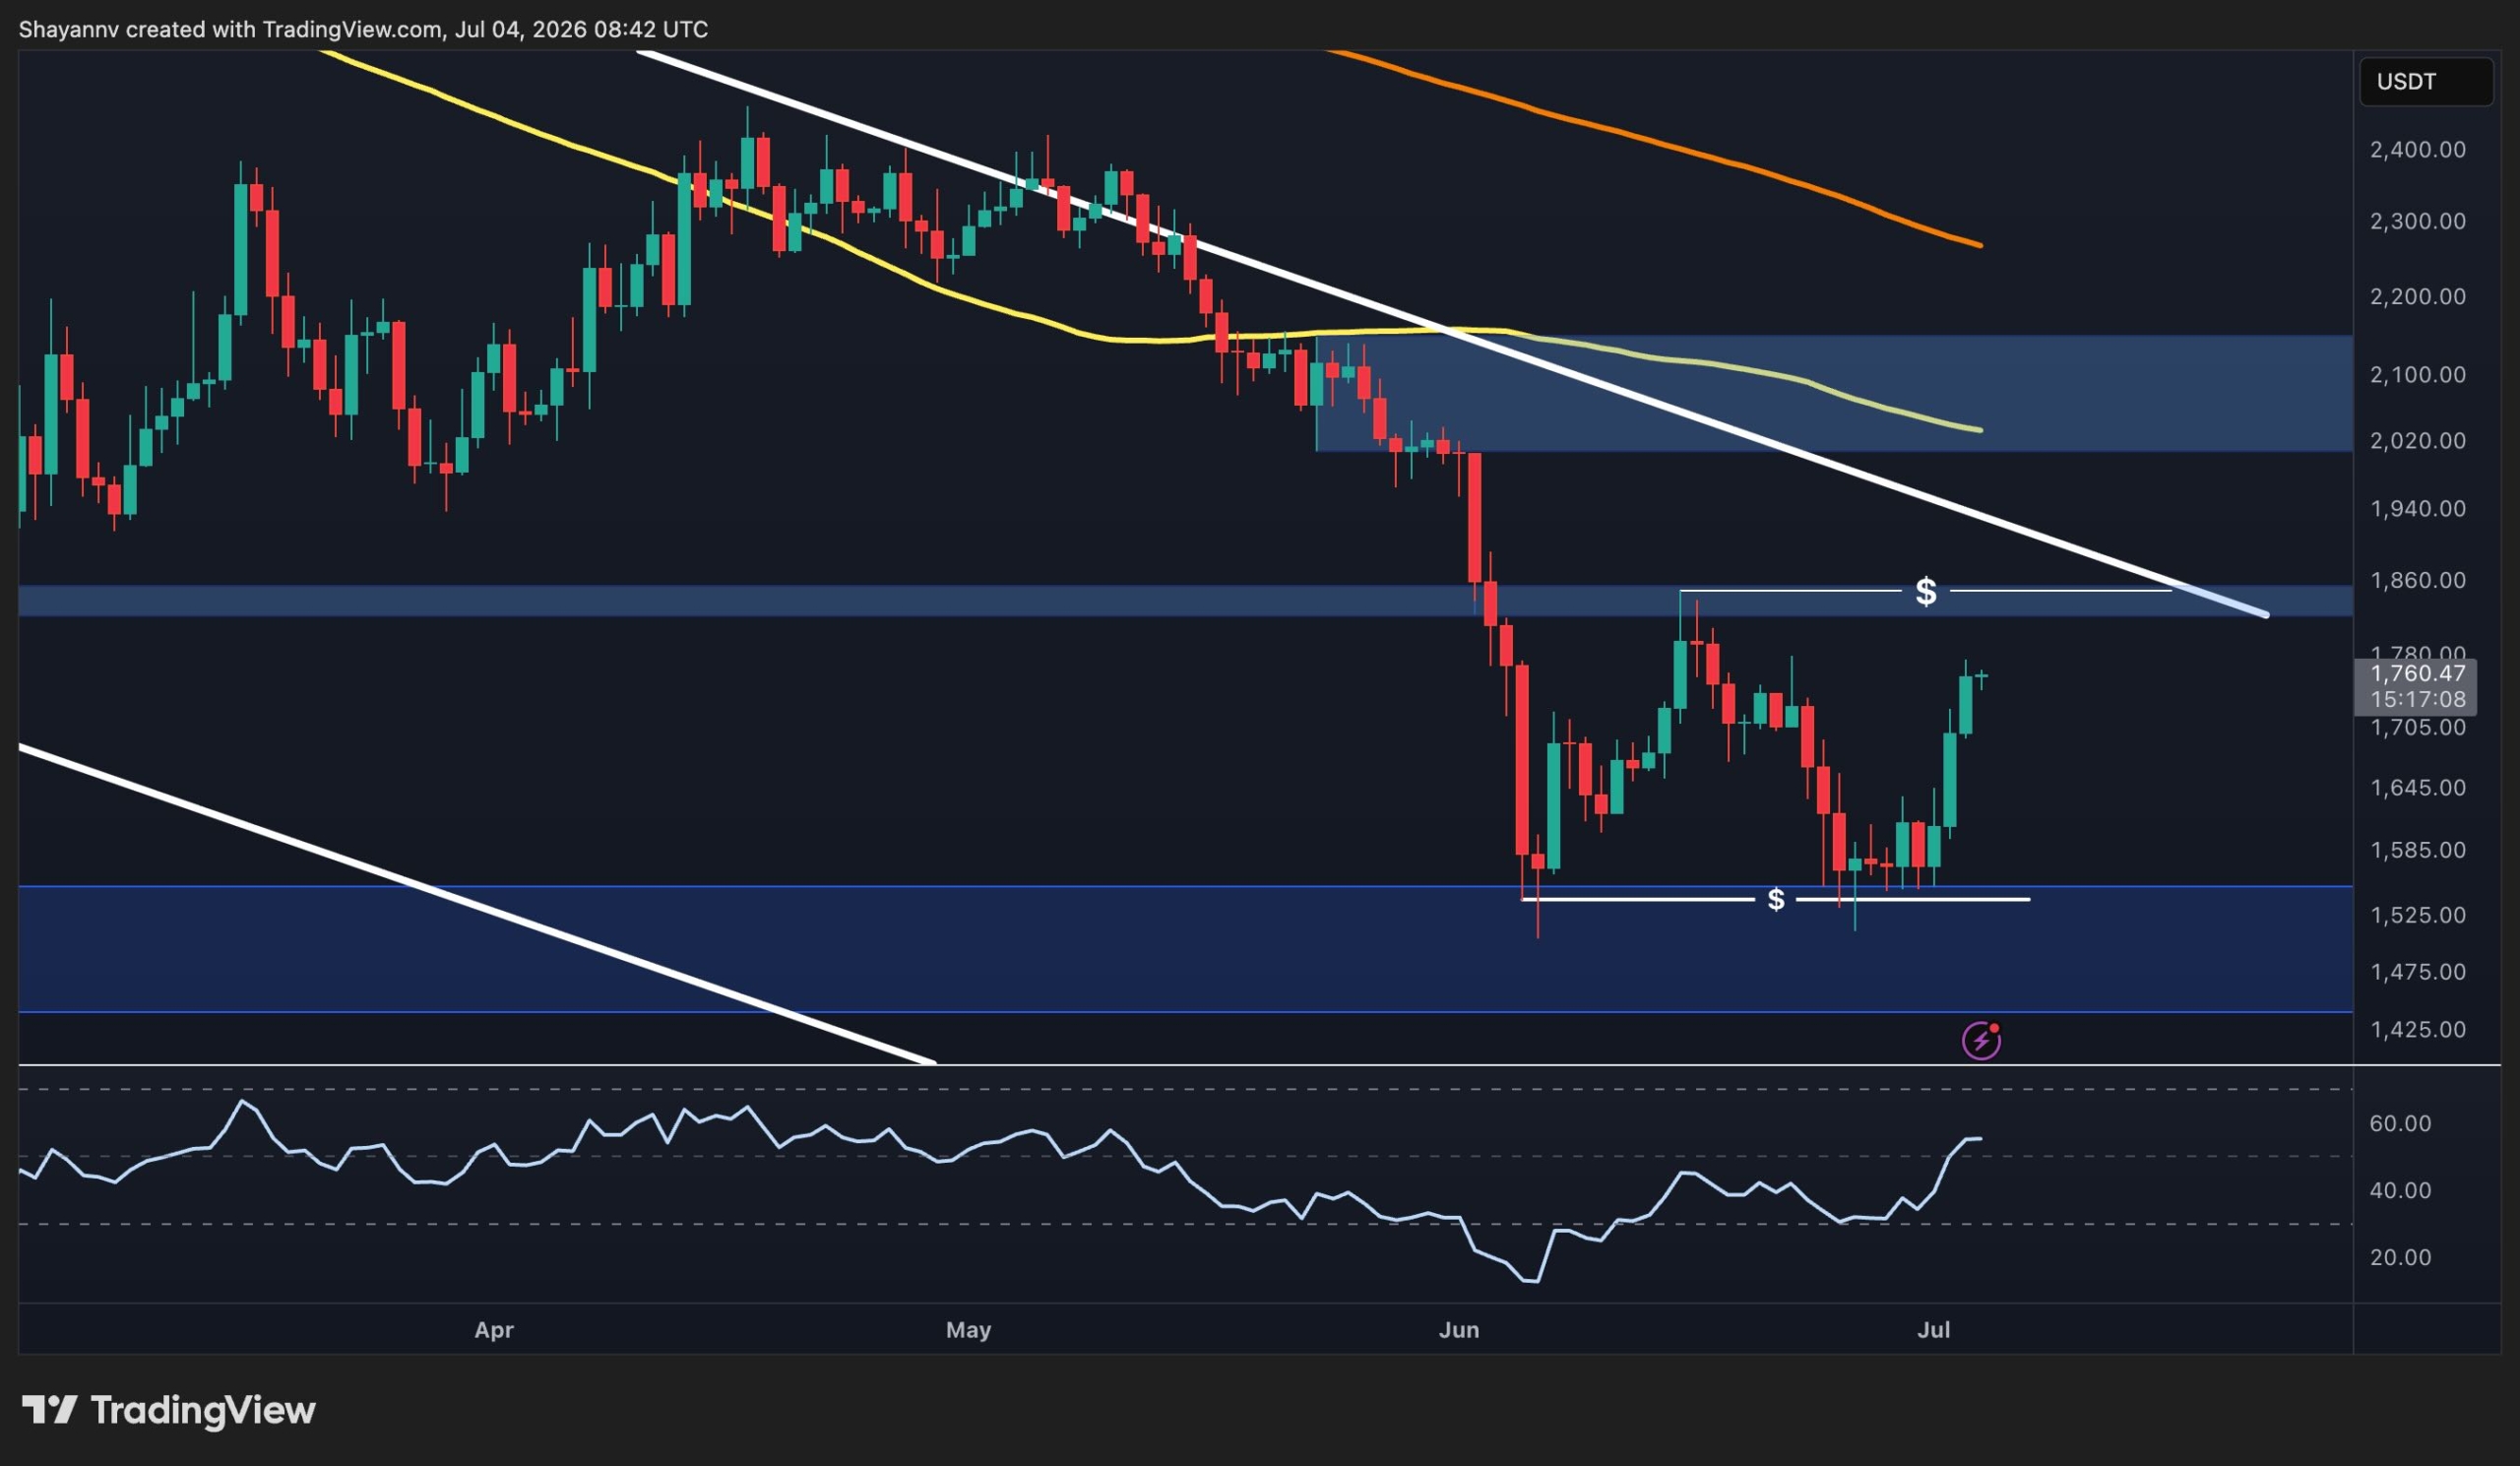
Ethereum continues to recover from the $1.46K-$1.53K demand zone, where buyers once again stepped in after defending the June lows. The rebound has now carried price toward the descending trendline that has capped every major rally since the May peak.
The recent advance has also reclaimed the $1.70K area, placing ETH just below the next key resistance cluster around $1.82K-$1.86K. This region is particularly important because it aligns with the long-term descending trendline, creating a significant technical confluence.
Momentum has improved considerably. The previously discussed bullish RSI divergence has continued to play out, with the indicator making higher highs while price has recovered sharply from support. This suggests bearish momentum has weakened substantially compared to previous sell-offs.
Nevertheless, the broader trend cannot be considered bullish until Ethereum breaks above the descending trendline and reclaims the higher resistance band. A rejection from this area would preserve the sequence of lower highs that has defined the market for the past several months.
Source: TradingView
ETH/USDT 4-Hour Chart
The 4-hour chart shows that Ethereum has successfully broken above its short-term consolidation and reached the first resistance zone around $1.70K-$1.74K. Buyers have maintained strong momentum following the breakout from the lower range, allowing the price to approach the upper boundary of the descending structure.
Price is now trading just beneath the falling trendline that has repeatedly rejected previous recovery attempts. A decisive breakout above this trendline would represent the first meaningful structural improvement since the broader decline began and could open the door for a move toward the $1.82K-$1.86K resistance area.
As long as Ethereum remains above the recently reclaimed $1.70K region, buyers retain short-term control. However, failure to overcome the descending trendline could trigger another rejection, sending price back toward lower support levels and extending the broader corrective structure.
Source: TradingView
Sentiment Analysis
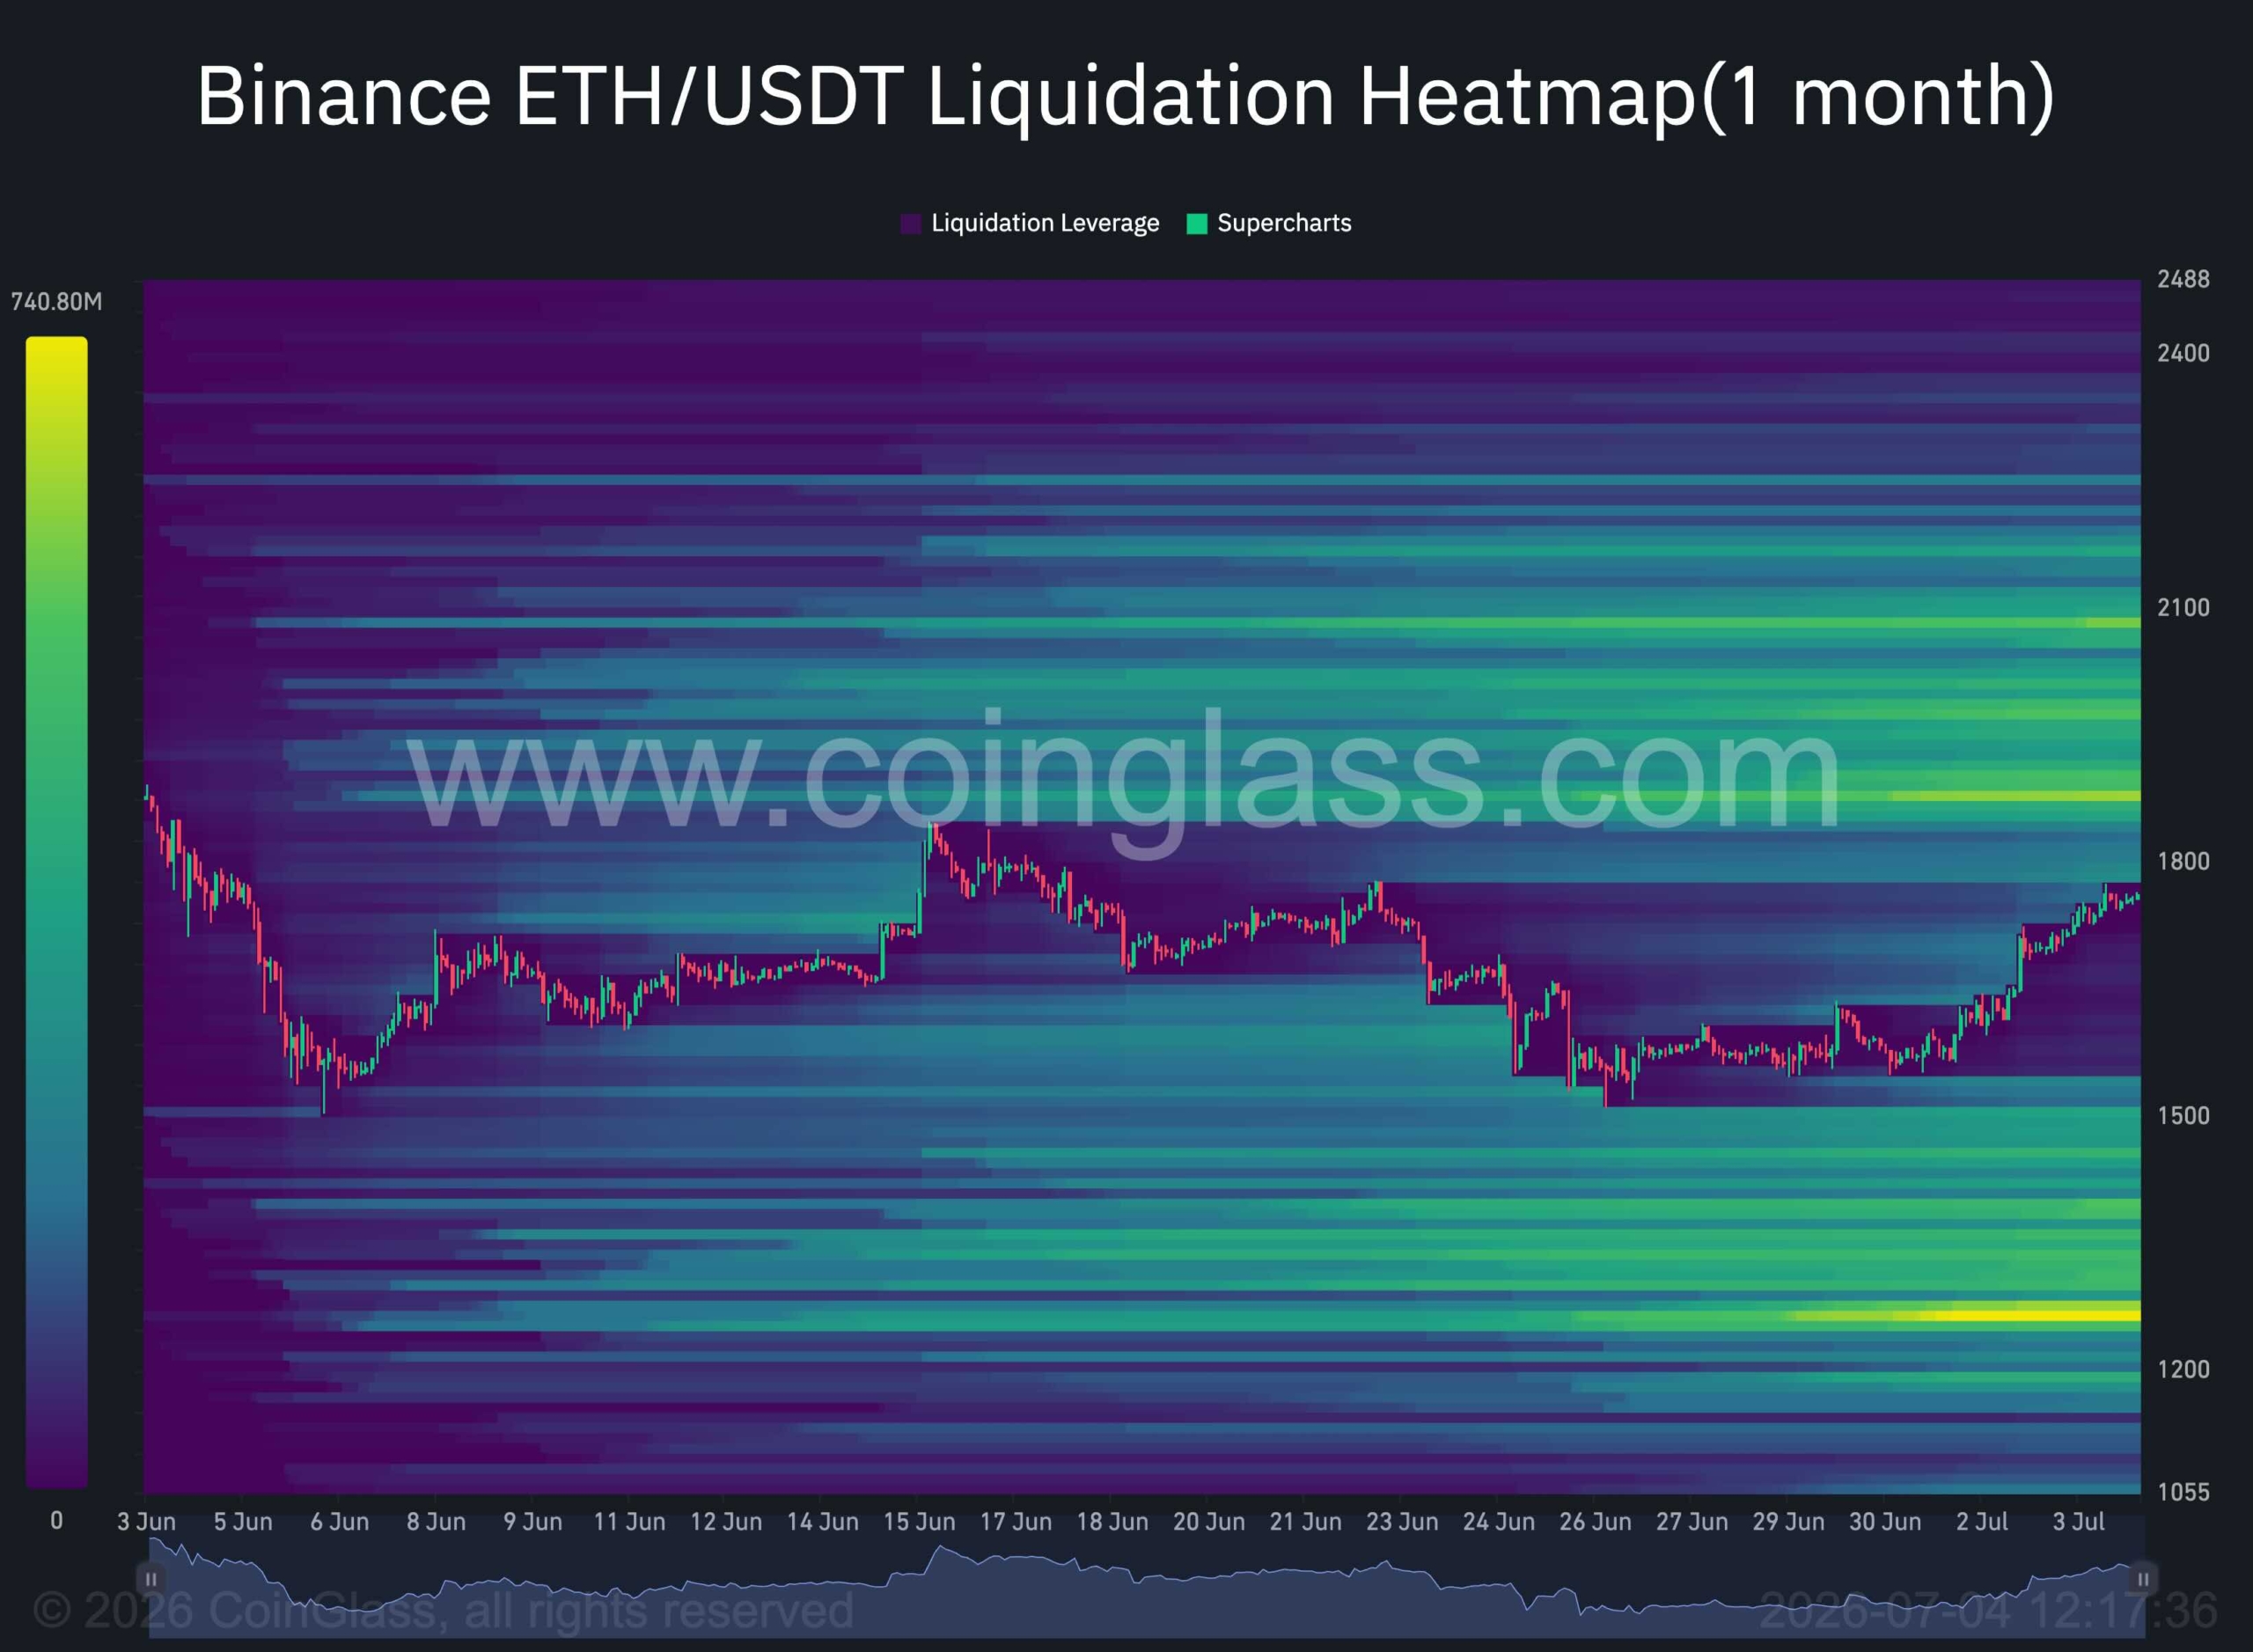
The one-month liquidation heatmap highlights a significant concentration of leveraged positions above the current market price, particularly within the $2K-$2.2K region.
These overhead liquidity clusters could act as a magnet for price in the coming sessions. If Ethereum successfully clears the descending trendline and continues its recovery, the market may accelerate toward this area as short liquidations fuel additional upside momentum.
However, the reaction after such a liquidity sweep may prove even more important than the rally itself. Once the $2K-$2.2K liquidity has been absorbed, the market will likely reveal whether buyers have accumulated enough strength to establish a sustainable bullish trend or whether the move was primarily a liquidity-driven squeeze.
If bullish momentum remains strong after clearing the overhead liquidity, Ethereum could enter a broader recovery phase. Conversely, failure to hold above that region would increase the probability of another significant decline, with price potentially rotating lower to target the sizeable liquidity clusters that remain beneath the current market. Such a sequence would fit the market’s tendency to move between major pools of leveraged liquidity before establishing its next directional trend.
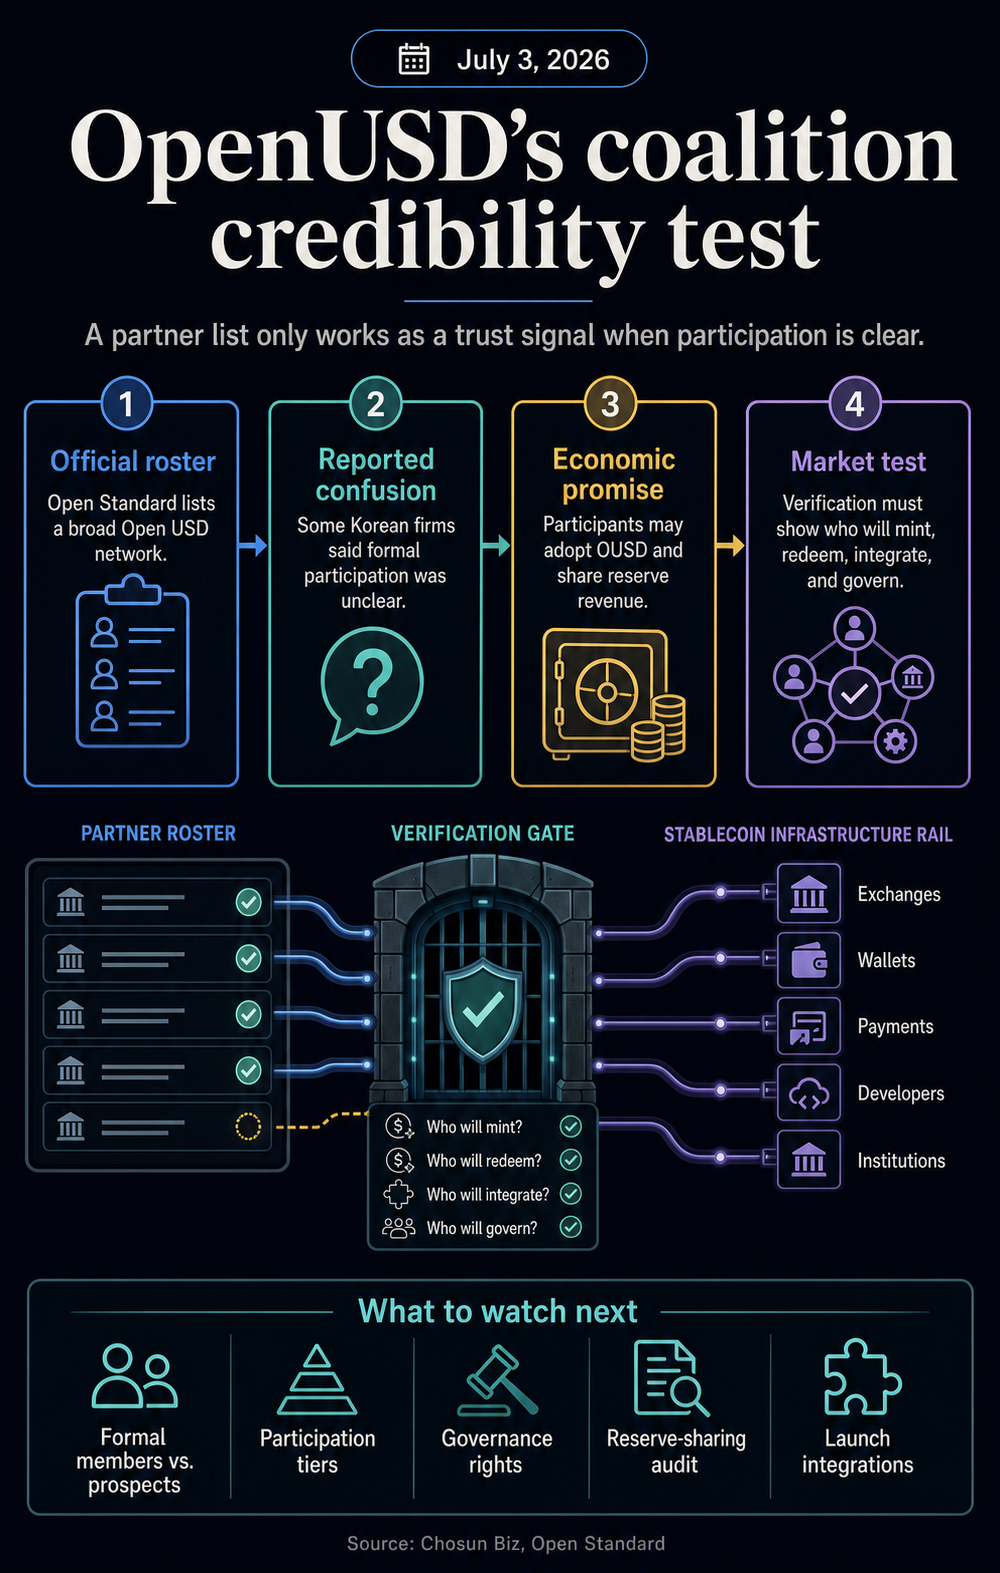
OpenUSD’s first proof point is a formal commitment. The project launched around a sweeping corporate roster, but the roster itself is now the part Open Standard has to explain.
A July 3 Chosun Biz report said several Korean companies named in connection with the OUSD alliance had neither held official consultations with the issuer nor expressed a willingness to review participation.
The report named Samsung Electronics, Shinhan Financial Group, Dunamu, Kbank, and other Korean firms in describing the confusion over how their names appeared in the context of the consortium.
At the same time, Open Standard’s official site still presents Open USD as shared stablecoin infrastructure and displays a long list of global companies under a “backed by” section.
The site positions OUSD as a dollar-stablecoin for financial activity, says Open Standard is the independent company that governs and operates it, and describes participation as adopting OUSD as a core transactional asset, with integration support and the opportunity to earn revenue based on usage.
The tension is now clear. A coalition stablecoin cannot use a large partner count as proof of institutional distribution unless the market can tell which names are formal participants, which are prospects, which are reviewing the model, and which are prepared to put the stablecoin into actual payments, trading, settlement, or treasury workflows.
Why the partner list carries more weight than the launch number
The original pitch positioned OpenUSD as more than another dollar token. Its public positioning points to a different stablecoin model, one built around companies that move money and share in the economics of adoption rather than a single issuer capturing most of the upside from reserve income.
Open Standard says OUSD is designed as open infrastructure for global financial activity. The site says the stablecoin is meant to give businesses the economics, governance and reliability needed to move money, with nearly all reserve economics shared with companies that grow adoption.
It also says reserves are maintained at major financial institutions in compliance with US regulatory requirements and that OUSD is expected to launch later this year.
That makes the roster more than a marketing asset. If participants are expected to adopt OUSD as a core transactional asset, receive technical documentation, receive integration support, and earn revenue based on usage, then the difference between formal participation and informal interest is material.
Chosun Biz’s July 3 report created that distinction in public. Samsung Electronics was cited as saying there had been no official consultations and that it did not know what role it would play.
Shinhan Financial Group, Dunamu, and Kbank were described as saying that Open Standard had asked about their willingness to participate and that they would review it, but their names were included as consortium members.
Another company representative said they learned through Korean media that they had been included.
That confusion does not make OpenUSD’s model impossible. It does make the next credibility threshold much higher. Open Standard can still have a large network, but the useful signal is no longer the list’s size. It is the clarity behind the list.
The distinction is central: partner verification is the bridge between announcement and adoption.
A stablecoin can advertise hundreds of potential distribution points, but users and counterparties need to know which of those points will actually support minting, redemption, settlement, payments, custody, trading, or treasury use.
Without that map, the roster tells readers that conversations happened, not that infrastructure is ready.
Reserve sharing needs verified distribution
Reserve economics are the mechanism that makes OUSD’s partner story significant. In the traditional stablecoin model, the issuer receives dollars, mints tokens, and earns income on reserve assets, subject to its own operating, regulatory, and market structure.
Chosun Biz described OUSD’s model differently: a participating corporation deposits a dollar into Open Standard’s reserve account, Open Standard mints one OUSD, and the corporation can redeem by returning the token for the dollar in its bank account.
The report said participating companies can mint and redeem without stated fees or issuance limits.
Open Standard’s site adds the economic pitch. It says OUSD is designed to return most reserve-generated revenue, minus a small management fee, to participants that adopt and distribute the stablecoin.
In plain terms, the network is asking businesses to treat the stablecoin less as an external product and more as shared financial infrastructure whose use can feed revenue back to the companies that distribute it.
That idea speaks directly to the stablecoin market‘s current bottleneck. USDT and USDC dominate not only because users recognize the tickers, but because liquidity, venue support, redemption confidence and integrations reinforce each other.
OpenUSD’s answer is that a broad set of payment companies, fintechs, exchanges, banks and consumer platforms can create distribution more quickly if they share the economics.
The roster challenge cuts into that answer. If a listed company is merely considering participation, it cannot yet be counted as distribution. If a company has not agreed on its role, it cannot yet signal the depth of its governance.
If a firm does not know whether it is expected to mint, redeem, integrate, settle, or promote OUSD, its name does not tell the market how the stablecoin will reach users.
That is why the Korean confusion is more than a regional communications issue. It tests whether coalition stablecoins can turn brand-name association into verified infrastructure.
The more a stablecoin relies on partner scale as a trust signal, the more precise the public record must be about what each partner has agreed to do.
Governance now becomes part of the product
The governance question is just as important as the partner question. Chosun Biz reported that participating companies would not join through a DAO structure or as shareholders.
Open Standard’s site says Open USD is governed and operated by Open Standard, an independent company with an ownership and corporate governance structure designed to make decisions in the collective interest. It also says governance is collaborative and overseen by Open Standard’s independent management team.
Those statements can coexist, but they leave practical questions with greater weight now.
If listed companies are neither shareholders nor DAO participants, what rights do they have regarding reserve policy, technical changes, compliance standards, partner admission, revenue allocation, or launch timing?
If governance is collaborative, what process turns a participant’s view into a decision? If the roster includes companies at different stages of commitment, do they all have the same role, or are there tiers?
For an issuer-led stablecoin, users mostly ask whether the issuer can maintain the peg, manage reserves, support redemptions, and comply with applicable rules. For a coalition stablecoin, the credibility surface is wider.
The market has to evaluate the issuer and the network together.
That is the part OpenUSD cannot solve with a longer list. A partner roster is only useful if it maps to obligations, incentives, and operating roles. Otherwise, the list risks becoming a soft signal attached to a hard financial product.
The next useful disclosure would be simple: a roster that separates formal participants from companies reviewing participation, a definition of each role, and a clear account of what adoption means before launch.
Open Standard could also clarify whether participants have governance authority, economic participation only, technical access, future integration rights, or some mix of those categories.
Those disclosures would help separate operational readiness from reputational reach. A payment company that will settle OUSD flows is different from a firm that is examining the economics.
A bank or card issuer with a defined minting and redemption path is different from a company listed because it joined exploratory talks. Coalition stablecoins need that distinction to avoid turning every future roster into a due diligence exercise for the market.
The next test is verification, not scale
OpenUSD’s opportunity remains obvious. Stablecoins are moving from crypto-native trading rails into payments, remittances, merchant settlement, fintech balances and institutional money movement.
A neutral asset backed by companies that already touch those flows could challenge the idea that stablecoin distribution has to be issuer-led.
But that opportunity depends on trust signals that survive scrutiny. A reserve-sharing model asks partners to help grow usage. An institutional distribution model asks the market to believe those partners can bring real payment and settlement volume.
A collaborative governance model asks readers to believe that decisions will be made by more than a single sponsor behind a long list of logos.
The partner confusion reduces all three claims to a single near-term test. Open Standard does not need to publish every commercial agreement to keep the OUSD thesis alive.
It does need to make the public meaning of participation clear enough that a company name cannot be mistaken for a commitment the company itself does not recognize.
OpenUSD now turns on a more practical question: whether the companies on the list are committed in a way that users, counterparties, and other institutions can understand.
For coalition stablecoins, that may become the rule beyond OUSD. Partner count can open the door, but verification decides whether the market treats the coalition as infrastructure or as a launch roster still waiting to become real distribution.
Charles Hoskinson expects the Ouroboros Leios upgrade to multiply Cardano’s capacity by 60 times, a leap that would put the network on par with the XRP Ledger in terms of speed.
The founder also defended Midnight City against critics and outlined the upgrade’s next steps.
Leios: Cardano’s Bet to Catch the XRP Ledger
Ouroboros Leios is an upgrade to Cardano’s protocol designed to multiply transaction capacity without sacrificing decentralization or security. Charles Hoskinson explained its scope during an interview with David Gokhshtein on “The Breakdown podcast”.
According to the founder, the technology will increase the network’s internal throughput by up to 60x. That jump, he said, would leave Cardano with performance comparable to the XRP Ledger, a network known for its efficiency.
“Leios will be a 60x in terms of throughput inside the system, so we’re good, we’re as performant as XRP, and we still kept our principles,” Hoskinson said.
— David Gokhshtein (@davidgokhshtein) July 2, 2026
The comparison carries weight. The XRPL built its reputation on settlements between three and five seconds and a maximum capacity of 1,500 transactions per second. In March 2026, that network surpassed 120 TPS during a peak with roughly 650 operations.
Hoskinson stressed that these improvements do not mean giving up the project’s founding principles. The industry knows this dilemma as the blockchain trilemma, where scaling often demands trade-offs between decentralization and security. Cardano wants to prove that exchange is not inevitable.
The path is already underway. The public Leios testnet, named Musashi Dojo, debuted on June 23, 2026. It marks the protocol’s first operation in a live network environment. Mainnet deployment is expected before the end of this year.
Hoskinson Defends Midnight City After Big Pey’s Criticism
Hoskinson also responded firmly to questions about Midnight City. Content creator Big Pey labeled the initiative an example of wasteful spending within the ecosystem.
According to the critic, the team invested millions of dollars in a project that was unable to attract new users. He described that strategy as the “Cardano Way,” referring to investments that yield no immediate commercial returns.
The reply came at once. Hoskinson said he had lost all respect for Big Pey as an entrepreneur and criticized him for failing to understand how consumer products evolve. He even challenged the critic to save the post and return in a year to apologize.
I’ve just lost all respect for you as an entrepreneur. You clearly have no clue how adoption or consumer experiences work. Save this tweet and come back in a year to apologize. Midnight City is one of the most important applications on Midnight and will be one of the keys to…
Midnight City works as an interactive showcase for Midnight Network, the privacy-focused chain tied to Cardano. The platform translates complex blockchain mechanics into a retro-futuristic 2D city inhabited by AI agents.
Those agents generate transactions and economic behavior similar to everyday use by consumers and businesses.
Institutional interest supports that vision. Midnight already added Monument Bank, Google, and AlphaTON Capital, and is holding talks with investment banks in the United States and Europe.
For Hoskinson, 2026 will be a beta year meant to strengthen the infrastructure before mainstream adoption.