
Bitcoin Price Analysis: Is BTC Ready for Another Leg Higher Next Week?
Bitcoin’s recovery from June lows is testing critical resistance near $65K-$67K, where technical divergences suggest weakening selling pressure, but institutional investors should watch whether large whale transactions signal conviction or distribution ahead of next week’s move.
- Bitcoin bounced sharply from $58K-$61K support zone after losing $72K-$74K in June, now approaching $65K-$67K resistance cluster
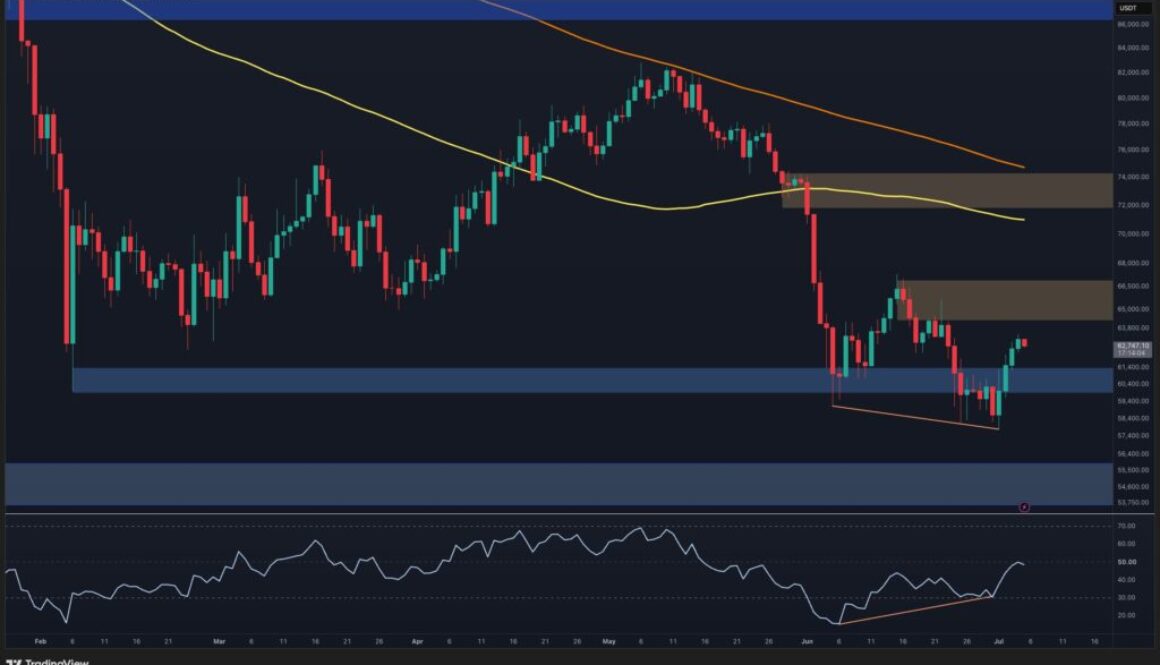
- Daily RSI formed bullish divergence with higher lows while price made comparable lows, signaling potential exhaustion in downtrend
- Large whale-sized transactions remain active near $60K-$63K region, but conviction direction unclear without completion of technical breakout pattern
- $65K-$67K Immediate resistance zone where descending trendline intersects with major supply cluster overhead
- $58K-$61K Support region successfully defended, now acting as critical near-term floor for further declines
- June Time period when Bitcoin lost $72K-$74K support, flipping it into major resistance area
Bitcoin has staged a sharp rebound from lows near $58,000 after sweeping through liquidity beneath support levels established in June, but the recovery now faces a decisive test at a critical resistance cluster between $65,000 and $67,000.
The bounce represents genuine technical improvement from a near-term perspective, yet the broader downtrend remains intact until BTC reclaims the $72,000-$74,000 zone that collapsed two months ago.
For institutional investors, the near-term setup hinges on whether this week’s price action can confirm a structural shift or merely represents another exhaustion rally within a larger bearish framework.
Daily RSI Divergence Signals Weakening Selling Pressure After June Capitulation
The daily timeframe reveals a bullish divergence in the Relative Strength Index, one of the few technical indicators that has turned constructive despite Bitcoin continuing to trade below both its 100-day and 200-day moving averages.
While price registered comparable or lower lows around the June bottom, momentum, as measured by RSI, made higher lows, a mismatch that historically appears during exhaustion phases when sellers are running out of conviction. This divergence carries weight for institutional traders because it suggests the market is attempting to build a floor after an extended decline.
The moving averages themselves continue to slope lower and act as dynamic resistance, maintaining the structural bearish bias. Both the 100-day and 200-day remain positioned above current price levels, meaning Bitcoin would need to decisively close above both to signal a reversal in the intermediate trend.
The $72,000-$74,000 support zone that broke in June has now flipped into a major supply area, a common pattern where previous buyers trapped above the breakdown become forced sellers or resist higher prices.
The key distinction for portfolio managers is that the divergence alone does not guarantee upside; it only indicates that momentum strength has improved relative to price weakness, creating an asymmetric risk setup if Bitcoin can break higher.
Falling Wedge on 4-Hour Chart Suggests Near-Term Acceleration Potential
On the 4-hour timeframe, Bitcoin has traced a developing falling wedge structure, a pattern characterized by converging trendlines that typically precedes a breakout. The lower boundary near $58,000 served as a recent reversal point, and price has advanced steadily toward the upper trendline, which currently converges with the $63,000-$64,000 area.
This convergence means the wedge is tightening, and historical performance of this pattern suggests the next significant move will occur when price breaks one of the boundaries rather than continuing to oscillate inside.
The recovery has already reclaimed the $60,000-$61,000 support zone, flipping it from resistance into a short-term demand area, a bullish sign for momentum traders. Bitcoin is now testing the upper wedge boundary while simultaneously approaching the lower edge of the $64,000-$66,500 supply zone, creating a compressed technical environment where the next directional break could accelerate sharply.
A successful breakout above the descending trendline would likely trigger a move toward the higher resistance region at $65,000-$67,000, potentially confirming a shift in short-term market structure after weeks of lower highs and lower lows.
If the breakout fails, Bitcoin may consolidate inside the wedge for another cycle, and a breakdown below $60,000-$61,000 would invalidate the recent recovery and place the bounce at immediate risk.
Whale Activity Remains Active but Conviction Direction Stays Unresolved
Spot average order size data reveals that whale-sized transactions continue to dominate market activity despite Bitcoin trading near local lows, suggesting that large institutional and high-net-worth participants remain engaged rather than sidelined. The latest readings indicate sustained large order flow in the $60,000-$63,000 price region, the zone where the most recent capitulation occurred.
This level of whale activity near lows has historically been associated with either accumulation by sophisticated buyers or distribution by investors taking profits after holding through the decline.
For institutional portfolio managers, the whale metric provides behavioral insight that pure price action cannot, but interpretation requires confirmation from technical breakout patterns. If Bitcoin breaks above $65,000-$67,000 on expanding volume and sustained large order participation, it would suggest conviction from informed participants.
Conversely, if price is rejected near resistance while whale activity begins to dwindle, it may indicate that large players are frontrunning a reversal or taking profits into strength.
The metric alone cannot determine directional intent without price confirmation, making the breakout decision at the $65,000-$67,000 resistance cluster the primary test of whale commitment to the recovery.
Next Week’s Setup Depends on Conviction Above $65K-$67K Resistance
The immediate week ahead represents a critical inflection point for the recovery’s validity. A sustained breakout above the $65,000-$67,000 resistance cluster would open a path toward the $72,000-$74,000 zone, potentially triggering a cascading short covering that could accelerate gains toward $75,000 and higher.
This scenario would also confirm the bullish divergence and suggest the June low is holding as an intermediate-term floor. Such a move would need to occur on expanding volume and maintained whale participation to carry conviction in a market that has spent weeks in a downtrend.
Rejection at the $65,000-$67,000 zone would reinforce the prevailing bearish structure and increase the probability of a retest toward the $60,000 support area, and potentially lower if selling pressure intensifies.
Bitcoin would then require multiple attempts to escape the technical resistance cluster, and institutional investors watching from the sidelines would likely wait for a clear breakout before committing fresh capital to recovery trades.
The 4-hour falling wedge tightening means the directional decision cannot remain suspended for long, a break in one direction or the other should occur within days rather than weeks.
Watch for a daily close above $66,000 on strong volume next week, which would signal that the bullish divergence has shifted from warning to confirmation; without that sustained breakout, the risk of a washout back toward $58,000-$61,000 remains material enough that institutional managers should avoid overcommitting long exposure until higher resistance is decisively cleared.