Kpler has pushed its expectation for a reopening of the Strait of Hormuz into 2027, raising the risk of sustained higher oil prices.
Matt Smith, Kpler’s director of commodity research, gave the revised timeline on CNBC. He said there is no endgame in sight after five months of conflict.
Why the Strait of Hormuz Reopening Timeline Slipped
The United States and Iran signed a memorandum of understanding in June, reopening the strait. Tanker traffic then picked up through early July.
Smith said those flows have since slowed to a trickle. Meanwhile, US forces have continued nightly strikes on Iranian military and maritime targets.
A second chokepoint has now opened. Saudi Arabia had been routing an extra 3.25 million barrels a day into the Red Sea through Bab el-Mandeb.
Smith said that the outlet is now at risk. The Houthis declared a maritime blockade on Saudi shipping and struck two Saudi tankers two days ago.
“And there doesn’t seem like there’s an end game in sight,” Smith said. “We’re looking at our expectations for the Strait of Hormuz reopening… it’s 15 million barrels a day of crude that leaves through there. That is ground to a halt. And we’re pushing that reopening into next year.”
A new threat is emerging in one of the world’s most important shipping lanes. Yemen’s Iran-aligned Houthi militia has declared a naval blockade on Saudi Arabia, raising fears over oil supplies and global trade https://t.co/BE9c7RiFafpic.twitter.com/LmyRDEXnfw
Brent Climbs While Refined Fuels Take the Bigger Hit
Smith said Brent has risen about 40%, or roughly $30, over the past couple of weeks. The benchmark settled at $100.69 on Thursday, its first close above $100 since May 26. Prices then reversed. Brent fell about 4% on Friday to close near $97 after reports of revived US-Iran talks.
Refined products have fared worse than crude. Smith put diesel near $180 a barrel and gasoline near $140.
He said the concerns he raised about jet fuel in May have been addressed. However, that relief came at the expense of diesel and gasoline, and he expects those strains to worsen.
The European Union has sanctioned HTX, widening a Russia crackdown that has already affected counterparties beyond the exchange.
The bloc placed Huobi Global S.A., the entity behind HTX, under a transaction ban in its 21st sanctions package adopted July 23. From Aug. 23, EU operators will be prohibited from transacting with the exchange, though the restrictions stop short of freezing its assets.
The move follows Britain’s May action against Huobi Global, which triggered tighter scrutiny of HTX-related transfers at other major crypto exchanges.
The EU is now taking that pressure further, introducing a mechanism that could eventually restrict crypto services across entire countries that host platforms used to evade Russia sanctions.
UK sanctions pushed scrutiny onto counterparties
Britain’s May designation showed how restrictions on HTX could quickly spread to businesses and customers outside the exchange.
After the UK targeted Huobi Global on May 26, OKX warned customers who had previously conducted arbitrage between its platform and HTX that continuing to transfer funds between the two exchanges could trigger additional scrutiny of their accounts.
The warning came after British authorities designated Huobi Global alongside a group of crypto platforms and entities accused of supporting Russian sanctions evasion.
UK authorities said they had reasonable grounds to suspect Huobi Global provided financial services to entities linked to Russia’s financial system, including the A7 cross-border payments network.
Britain also said a major global crypto exchange had channeled more than $1.5 billion toward Kremlin-linked entities. Blockchain intelligence firm TRM Labs identified that exchange as HTX.
The UK action subjected Huobi Global to an asset freeze and restrictions on making funds or economic resources available to the company.
HTX sought to distance the exchange from the entity named by Britain by saying:
“The listed entity Huobi Global S.A. is distinct from the online HTX exchange.”
However, the British authorities subsequently made clear that they considered HTX covered by the designation. The UK sanctions notice lists HTX and HTX Exchange among the names associated with Huobi Global.
In response, Justin Sun, an adviser to HTX, said the exchange “believes in full compliance with all applicable laws and cooperation with law-enforcement agencies worldwide.”
HTX shifts on-chain infrastructure after UK designation
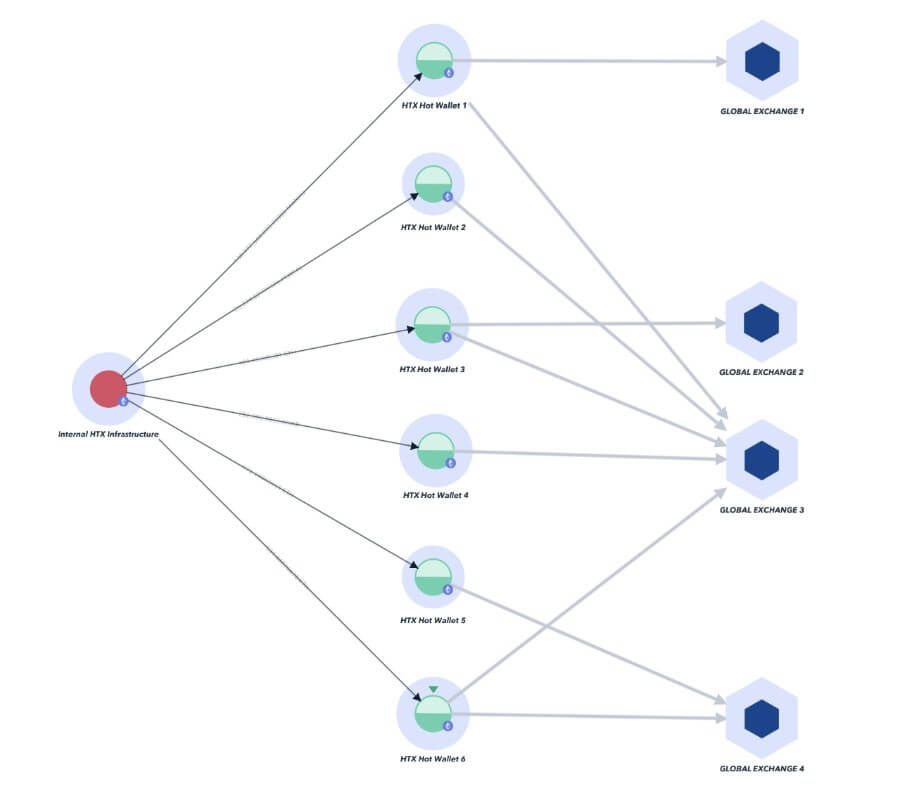
HTX remained operational after the British sanctions while rapidly rotating the wallets supporting its exchange activity.
Blockchain analysis company TRM Labssaid in a July 21 report that HTX had changed hot wallets and funding addresses across Tron, Ethereum, BNB Smart Chain and Solana in the weeks following the designation.
Some addresses remained active for only hours before being replaced.
HTX Wallet Rotation (Source: TRM Labs)
That turnover left screening systems built around fixed address lists struggling to keep pace with the exchange’s changing infrastructure.
A wallet attributed to HTX could be retired while another began processing deposits and withdrawals before compliance providers had identified its connection to the exchange, TRM said.
The firm found that static blocklists could therefore become outdated within hours.
TRM said firms screening for sanctions exposure increasingly need to track transaction patterns, funding relationships and other on-chain behavior that can connect newly activated wallets to an already identified platform.
Its latest assessment of the EU package also warned that exposure can extend beyond direct transactions with a designated address. Funds moving one or two transaction hops from sanctioned platforms can still trigger compliance concerns as firms investigate their origin and destination.
Blockchain investigator ZachXBTsaid the UK action had already made those signals less useful in some investigations because of the volume of addresses carrying exposure to HTX.
He described the resulting on-chain “tainting” as catastrophic, arguing that HTX differs from previously sanctioned crypto businesses such as Huione, Blender and Hydra because the exchange also serves a substantial retail user base in Asia.
“Basically now I’ve had to ignore the sanctions category when tracing cases by exposure since ‘risk’ itself has become meaningless.”
He also criticized compliance tools for failing to adequately distinguish activity that occurred before a sanctions designation from transactions that followed it.
The criticism highlights another difficulty created by wider screening. Connections to HTX can trigger additional review without establishing that the underlying transaction was illicit or occurred after sanctions took effect.
EU takes crackdown one step further with third-country power
The EU’s latest package is nevertheless extending the regulatory perimeter beyond individual exchanges and their changing wallets.
For the first time, the bloc has created a mechanism allowing it to prohibit transactions involving crypto providers across an entire third country when services there are used to help Russia evade sanctions.
The EU described the measure as a deterrent to countries hosting platforms that facilitate circumvention. It could allow Brussels to prohibit transactions between EU operators and crypto providers used by Russia within the affected jurisdiction.
The package extends transaction restrictions to 14 crypto-related service platforms based in Georgia, Panama, the United Arab Emirates, the Marshall Islands, Kyrgyzstan and Belarus.
Several have already faced action from other Western governments, including EXMO, BitPapa and Rapira.
The EU also added four designations tied to the A7 cross-border payments network, citing its new connections to Africa. TRM identified A7 Nigeria and A7 Africa among entities covered by the latest measures.
CryptoSlate previously reported that A7 had expanded into Lagos and Harare after claiming to have processed more than $90 billion during 2025. The network is linked to sanctioned Moldovan politician Ilan Shor and Promsvyazbank, the Russian state-owned lender tied to the country’s defense sector.
A7 also operates A7A5, a ruble-backed stablecoin that has become a major settlement vehicle within the network.
The expansion follows a broader pattern in which crypto activity has moved after individual platforms were targeted.
Following the multinational crackdown on Garantex in 2025, TRM said transaction flows shifted toward successor infrastructure and the A7 network absorbed part of that activity.
The EU’s latest approach gives it the option of following those flows beyond the next individual exchange.
A country hosting platforms used to bypass Russia sanctions could now expose crypto providers across the jurisdiction to restrictions on transactions with EU operators, even as regulators continue targeting individual firms.
Our Pi network price prediction anticipates the Pi price reaching a maximum of $0.3695 by 2026.
In 2032, the Pi price prediction projects a maximum of $1.71.
Pi Network price analysis points to a volatile but potentially higher long-term trajectory, with Pi Network’s maximum price predicted at $0.3695 by 2026 and $1.71 by 2032. That outlook is most applicable to current Pi holders, investors who may be thinking about investing in it, or crypto enthusiasts who just want to know if the recent downturn in Pi has affected its future potential.
It was originally launched as a mobile-first cryptocurrency to provide easy access to digital assets for the average user. Since its launch, PI has surged to its all-time high of $2.98 in February 2025. Later, PI experienced volatility due to market sentiment and has recently dropped to a new all-time low of $0.0805 in July 2026 amid increased selling pressure.
Pi Network has recently been shifting its focus to ecosystem growth and the enhancement of infrastructure. The project introduced improvements to the Pi ecosystem by implementing upgrades to Protocol v24, Pi Nodes update expansion, and new Pi2Day products such as PiVerify, Pi Sign-in, and SoloHost to improve real-world utility across the ecosystem.
With PI trading in a volatile manner and the project still evolving, understanding its historical trend, technical outlook, 2026-2032 forecasts, project development, and key risks and opportunities can help readers make more informed decisions about this highly speculative token.
As Pi Network continues growing its ecosystem and user activity, questions are growing around its long-term value. Will PI bounce back from its recent lows, and where will the token go in the next few years? Let’s explore our Pi Network price prediction and technical analysis from 2026 to 2032.
Overview
Cryptocurrency
Pi Network
Ticker Symbol
Pi
Price
$0.0813
Price Change 24h
-1.98% (24h)
Market Cap
$984.62M
Circulating Supply
10.94B P
Trading Volume 24h
$9.01 million
All-Time High
$2.98, Feb 26, 2025
All-Time Low
Jul 13, 2026: $0.08025
Pi Network Price Prediction: Technical Analysis
Metric
Value
Current Price
$0.0813
Price Prediction
$0.08553 (-25.06%)
Fear & Greed Index
11 (Extreme Fear)
Market Sentiment
Bearish
Volatility
4.87% (Medium)
Green Days
10/30 (33%)
50-Day SMA
$ 0.1394
200-Day SMA
$ 0.1728
14-Day RSI
28.03 (Oversold)
Pi price analysis
TL;DR Breakdown:
Today’s Pi price analysis shows the token under bearish pressure, trading around $0.0813
The token value has declined by around 2% over the past 24hours
Pi’s immediate support is at $0.080, while resistance is around $0.090
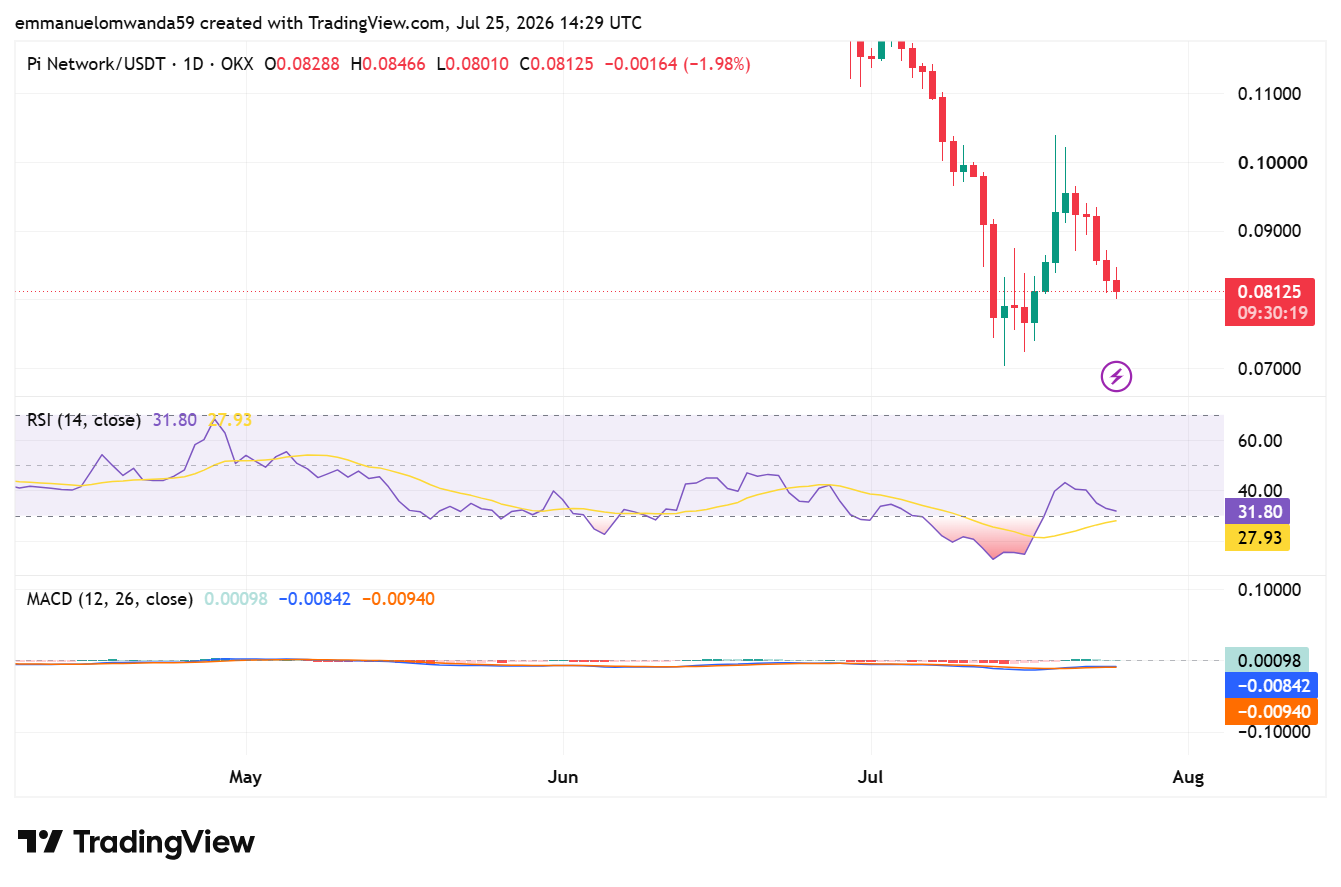
As of July 25th, 2026, Pi Network is under bearish pressure as buyers have failed to maintain the recovery achieved recently. At the time of writing, the Pi price is at $0.0813, down by 1.98% over the past 24 hours. Currently, sellers are in control of the broader price action.
PI price analysis on the daily timeframe
Analyzing the daily chart, it shows PI has drained part of last week’s recovery after it failed to sustain the price above $0.090 resistance. Sellers have pushed the price back toward the $0.080 support zone, keeping the trend bearish.
The immediate support is at $0.080, while resistance stands around $0.090. If Pi loses this support, it might test the recent lows again, but if it moves above $0.090, it could allow buyers to challenge the $0.100 psychological level.
Trading activity has slowed down with 24-hour volume dropping to $9.01 million, reflecting weak buying interest. The PI price also remains below both the 50-day SMA at $0.1394 and the 200-day SMA at $0.1728, confirming that the longer-term trend continues to favor sellers.
The RSI has fallen to 31.80, moving just above the oversold region. This shows selling pressure remains strong, although the market is approaching levels where buyers could begin looking for a short-term recovery.
The MACD remains bearish despite showing early signs of stabilization. Although the histogram has started to flatten, the MACD line is still below the signal line, indicating that bearish momentum continues to dominate.
Pi Price Analysis 4-Hour Chart
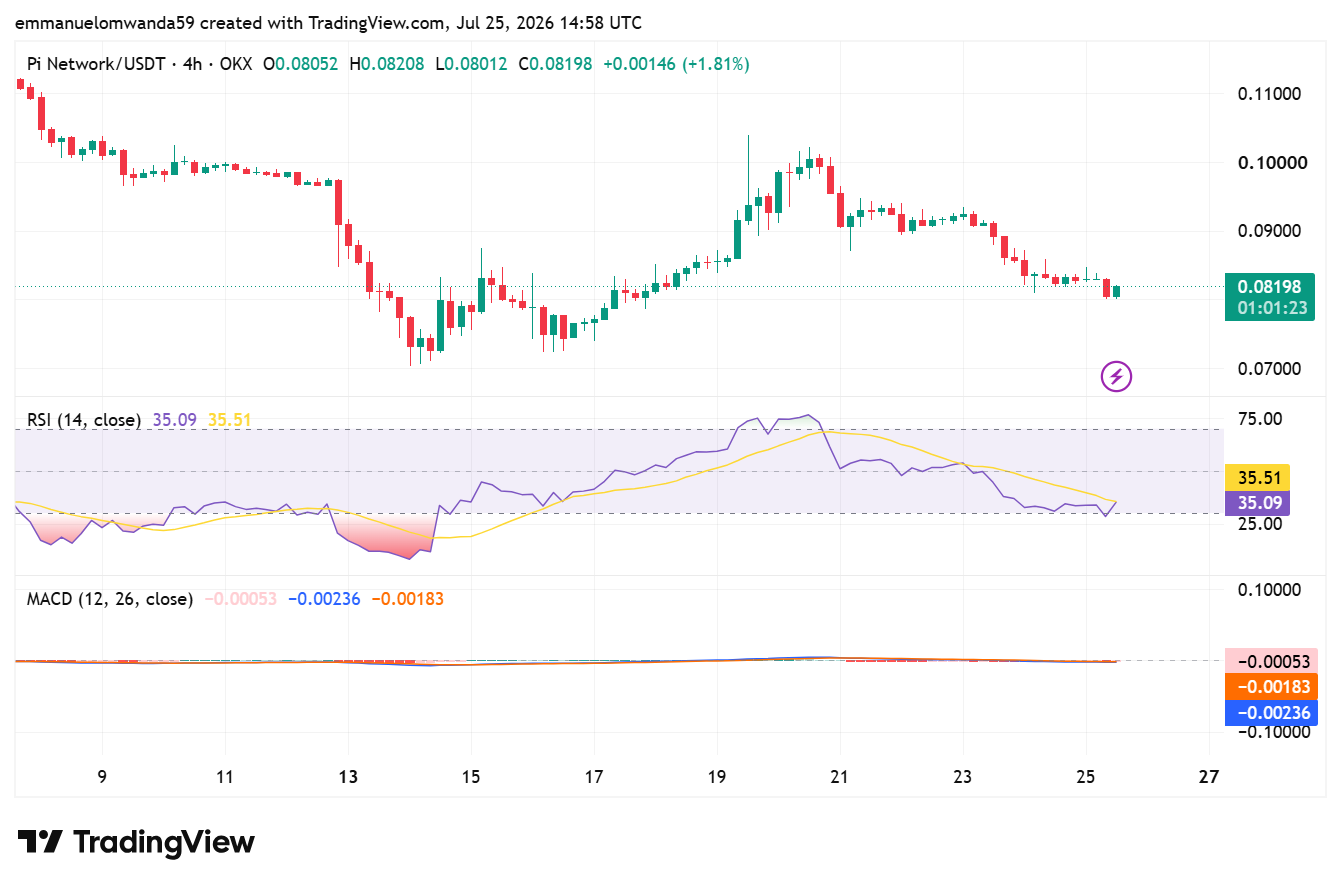
The 4-hour chart shows Pi continuing to trade under short-term bearish pressure. The price is now near $0.082, with buyers trying to defend the current support zone while sellers attempt to limit all recovery attempts. Although the recent decline has slowed, PI is still trading below its recent swing highs, leaving the short-term trend tilted to the downside.
The first resistance is around $0.085, and immediate support is around $0.080. If the price moves up above $0.085, then the PI token has the potential to test the $0.090 level again, and if it falls below $0.080, it could reach its lows once more.
The Relative Strength Index (RSI) has recovered to 35.09, climbing from oversold conditions but remaining below the neutral 50 level. This indicates that the selling pressure has slightly eased, but it hasn’t been enough to shift the momentum toward buyers.
The MACD is still bearish, as the MACD line stays below the signal line. The gap between the two lines, however, is decreasing and the histogram is flattening, suggesting that bearish momentum is easing and the market may stabilize if buying interest continues to strengthen.
Pi Network Price Prediction: Levels and Action
Daily Simple Moving Average (SMA)
Period
Value
Action
SMA 3
$0.1190
SELL
SMA 5
$0.1229
SELL
SMA 10
$0.1265
SELL
SMA 21
$0.1292
SELL
SMA 50
$0.1394
SELL
SMA 100
$0.1575
SELL
SMA 200
$0.1728
SELL
Daily Exponential Moving Average (EMA)
Period
Value
Action
EMA 3
$0.1186
SELL
EMA 5
$0.1211
SELL
EMA 10
$0.1247
SELL
EMA 21
$0.1289
SELL
EMA 50
$0.1394
SELL
EMA 100
$0.1538
SELL
EMA 200
$0.1924
SELL
Traders also use Fibonacci retracement and other technical indicators with EMAs to assess support, resistance, and possible pullbacks in the coming days or over the next week.
What to expect from the next Pi price analysis?
Pi is likely to remain under pressure while trading below the $0.085 resistance, with $0.080 remaining the key support level. A break above resistance could trigger a recovery toward $0.090, while a loss of support may see PI retest its recent lows.
Why is PI’s price down today?
Pi is down 1.65% over the past 24 hours as weakness across the altcoin market continues to weigh on sentiment, despite the broader crypto market posting modest gains. If PI fails to hold the $0.08 support level, it could retest recent lows, while holding above it may allow the token to consolidate in the near term.
Is Pi a Good Investment?
Pi is not a good buy for cautious investors, and those considering whether to buy Pi Network should treat it as a high-risk, speculative investment that could offer upside if its ecosystem grows and adoption increases. However, its price volatility remains high and dependent on overall market conditions, so investors should be prepared for uncertainty.
The project’s long-term success will largely depend on factors such as Mainnet adoption, developer activity, ecosystem utility, exchange accessibility, and the network’s ability to attract and retain active users. Recent developments, including Pi App Studio enhancements, protocol upgrades, and expanding exchange support, have strengthened the project’s fundamentals, but current trading for Pi remains limited because of the project’s enclosed mainnet, while supply expansion is a major risk because token inflation runs at approximately 20% monthly, or about 174 million PI, which pressures the price, alongside market sentiment challenges.
As with any cryptocurrency investment, investors should conduct their own research, assess their risk tolerance, and avoid investing more than they can afford to lose. While Pi has growth potential if adoption continues to expand, it remains a speculative asset with significant upside and downside risks.
Will Pi Price Reach $5?
At the current pace of development and given its total PI supply and circulating supply of over 8 billion PI, Pi Network’s long-term value will largely depend on user base growth and broader acceptance of cryptocurrencies in mainstream finance, making $5 unlikely in the near term. In that context, Pi Network compares unfavorably with more established blockchain networks on current adoption and practical utility, even as its mobile-first model has attracted broad early interest. The maximum supply of Pi tokens is 100 billion, and ongoing unlocks create significant selling pressure that must be absorbed by demand, while ecosystem growth remains high risk unless developers and users create real utility through DApps or merchant integrations.
Multiple technical quantitative indicators and fundamental factors, such as delayed mainnet launch and maximum supply constraints, suggest that Pi’s price may fluctuate within lower ranges before any major uptrend. Real-world utility will be crucial for supporting demand and helping determine whether Pi can reach higher price targets. A $5 target would require sustained adoption, significant on-chain activity, and strong market demand that is not yet present.
Will Pi Reach $10?
Reaching $10 would represent a massive increase in Pi’s market cap, something that is not expected soon under current crypto market conditions. The $10 mark is considered an upper price target or the high end of speculative forecasts. One forecast model puts the predicted price for Pi Network between $0.14 and $0.56 by the end of 2026, calculated from current market conditions and technical analysis.
Analysts suggest that even optimistic forecasts place this milestone more than a decade away, if at all. Investors should treat such projections as speculative investment advice and conduct their own research before making investment decisions, as Pi remains a high-risk asset with uncertain long-term value.
Does Pi Network Have a Good Long-Term Future?
Pi Network’s long-term prospects depend on its ability to convert its claimed base of over 60 million total users into active ecosystem participants, alongside a KYC-verified community the project puts at 11 million pioneers, though some reports cite 18.1 million KYC-verified users. If developer adoption, merchant integration, and real-world use cases continue to expand, the project could strengthen its position within the cryptocurrency market, but engagement and retention still matter because sentiment can influence long-term adoption.
However, investors should also consider risks related to token supply growth, market competition, regulatory developments, and overall crypto market conditions. As with any digital asset, future performance will
Recent Pi News/Opinions
Kraken listed PI for trading on March 13, 2026, marking one of the clearest exchange efforts to list PI.
On June 28, Pi Network celebrated its annual Pi2Day by launching three products aimed at extending its services to external developers and businesses. The releases are SoloHost (a framework for locally run AI apps), Pi Sign-in (a decentralized login system), and PiVerify (a KYC verification service for external clients). The Core Team’s theme was “Extending Pi Resources outside the Pi Ecosystem.”
Recent on-chain analysisfrom PIScan highlights a stark concentration of PI tokens. Only 21 wallets hold over 10 million PI each, with the Pi Foundation’s largest wallet reportedly controlling over 52 billion PI. In contrast, over 80% of the 16.7 million migrated users hold fewer than 10 tokens. This disparity challenges the project’s narrative of accessibility and decentralization
Pi Network announced that Pi App Studio has introduced a new App Planning Phase feature that uses AI to help creators refine their app ideas before generation. The feature guides users by requesting more details about the app’s main idea, goals, design, and user experience, making the app creation process more interactive and structured.
The new App Planning Phase feature in Pi App Studio allows creators to develop their ideas with the help of AI before App Studio generates the app.
For example, App Studio may ask for more detail about the app’s: – Main idea – Goal – Design – User experience
Pi Network has confirmed that Protocol v25 will launch on July 22, introducing improvements focused on network stability, reliability, and support for privacy-preserving smart contracts through BN254 cryptography and Poseidon hashing. The upgrade will first roll out on the testnet and is designed to support future node enhancements, open-source development, and the network’s planned decentralized exchange (DEX) ecosystem.
On July 22, Pi is scheduled to upgrade to Protocol v25, which primarily focuses on improving network stability and reliability, and supports new capabilities for more efficient, privacy-preserving smart contracts.
Pi Network has completed the distribution of its second testnet token, SLICE, via the Pi Launchpad. The testing phase ran from 12 to 28 June 2026, following an initial launch on PiDay (14 March). Nearly 480,000 users participated, leading to a simplified process. The new Launchpad app now provides allocation details, token pricing, and access to a liquidity pool for testing.
Pi Launchpad has completed the distribution of its second Testnet token, SLICE!
Explore the post-launch experience and see how liquidity pools work through the new price tracking feature!
The Launchpad app in Pi Browser shows individual allocation details, the launch and… pic.twitter.com/9N0RmQz6UG
In July 2026, Pi’s price may average around $0.0906 as bearish market sentiment and weak demand continue to pressure the token following its recent all-time low. A short-term recovery toward $0.1201 could occur if buying activity improves, while continued selling pressure may push PI toward a monthly low near $0.0797. Based on current short-term data, Pi Network’s price is predicted to decrease to $0.08754 by July 29, 2026.
Pi Price Prediction
Potential Low
Potential Average
Potential High
Pi Price Prediction July 2026
$0.0797
$0.0906
$0.1201
Pi Price Prediction 2026
In 2026, Pi Network (PI) is anticipated to trade between $0.07845 and $0.3695, leading to an average annualized price of around $ 0.2239. Based on pi today, that range implies both downside risk toward the low end and upside potential toward the high end from current levels if market sentiment and ecosystem growth improve during the year.
Pi Price Prediction
Potential Low ($)
Potential Average ($)
Potential High ($)
Pi Price Prediction 2026
$0.07845
$0.2239
$0.3695
Pi Price Predictions 2027-2032
Year
Minimum Price ($)
Average Price ($)
Maximum Price ($)
2027
$0.08973
$0.1814
$0.3127
2028
$0.1078
$0.1462
$0.2074
2029
$0.2124
$0.1296
$0.2656
2030
$ 0.1490
$0.4216
$0.5547
2031
$0.5825
$1.07
$1.16
2032
$1.34
$1.52
$1.71
Pi Price Prediction 2027
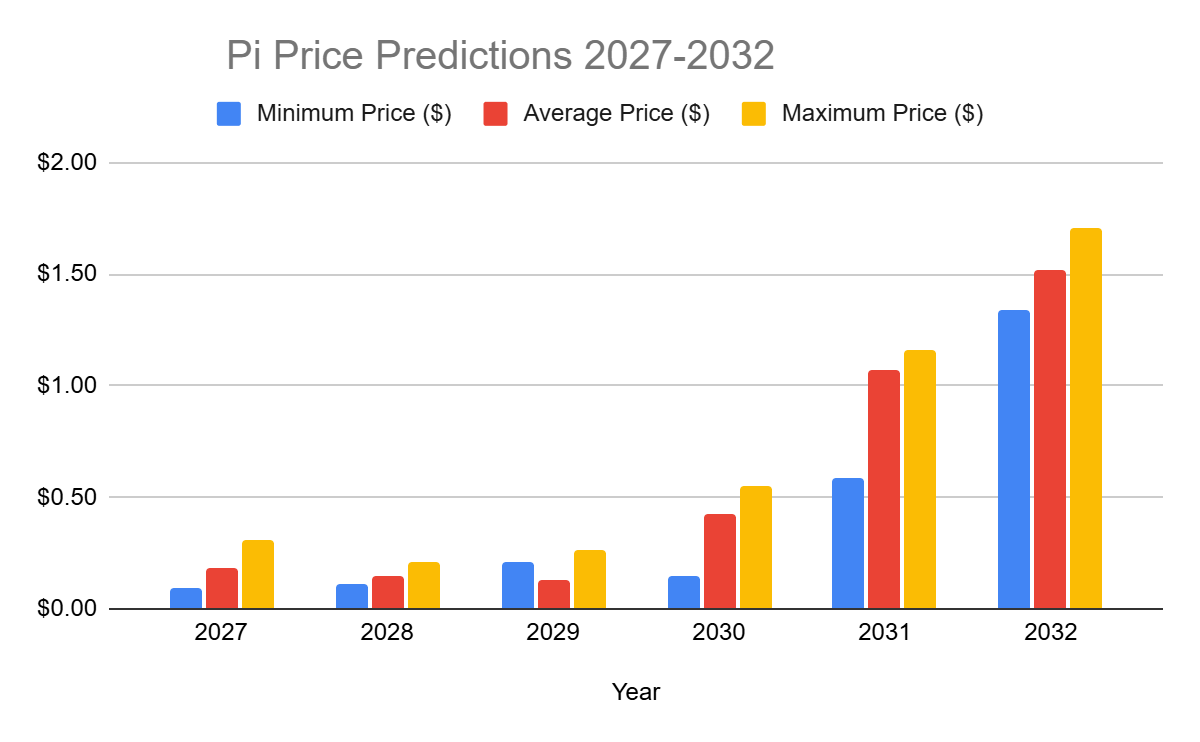
In 2027, the price of Pi is expected to reach a minimum level of $0.0897. The PI price could climb to a maximum of $0.3127, with an average trading price of $0.1814 throughout the year.
Pi Price Prediction 2028
In 2028, Pi is forecast to trade at a minimum value of $0.1078. The PI price may reach a maximum of $0.2074, while the average trading price could settle around $0.1462.
Pi Price Prediction 2029
In 2029, Pi’s price is projected to reach a minimum of $0.1296. The PI price could rise to a maximum of $0.2656, with an average trading price of $0.2124 during the year.
Pi Price Prediction 2030
In 2030, Pi is expected to trade at a minimum price of $0.1490. The PI price may reach a maximum of $0.5547, with an average forecast price of $0.4216.
Pi Price Prediction 2031
In 2031, Pi’s price is forecast to hold a minimum value of $0.5825. The PI price could climb to a maximum of $1.16, with an average trading value of $1.07.
Pi Price Prediction 2032
In 2032, Pi is expected to reach a minimum price of $1.34. The PI price could rise to a maximum of $1.71, with an average value of $1.52.
Pi price predictions 2027-2032
Pi Network Price Prediction: Analysts’ Pi Price Forecast
Firm Name
2026
2027
Coincodex
$0.1468
$0.1468
DigitalCoinPrice
$ 0.2310
$ 0.2420
Cryptopolitan’s Pi Price Prediction
At Cryptopolitan, we remain cautiously bullish on the long-term outlook for Pi Network despite recent volatility in the cryptocurrency market. Based on our Pi Network price prediction, the current price could gradually recover as ecosystem adoption, trading volume, market capitalization, and utility continue to grow. Earlier pre-launch Pi values reflected derivatives-style trading rather than true price discovery.
Our forecast suggests PI could trade between $ 0.07845 and $ 0.3695, with an average price of $0.2239. However, future price movements will depend on market sentiment, circulating supply growth, technical analysis indicators, and how Pi Network work in live market trading rather than enclosed-network conditions, as well as the network’s ability to attract users, developers, and real-world applications.
Pi Historic Price Sentiment
Pi price history: Coingecko
Pi Network launched in 2019 with mobile mining and operated in a closed ecosystem with no official market price, as tokens couldn’t be traded externally.
Between 2023 and 2024, Pi remained unlisted, with speculative prices ranging between $0.60 and $1.00 in unofficial markets.
In 2025, Pi Network surged to its all-time high of $2.98 in February before entering a prolonged decline that pushed the price to $0.1585 by October. The token later stabilized between $0.20 and $0.26 toward the end of the year..
From January to March 2026, Pi Network fell to a new all-time low of $0.1312 before recovering gradually toward the $0.17–$0.19 range as market stability improved.
By May 2026, Pi Network declined from the $0.17–$0.18 range to around $0.1439, as weak market momentum and continued selling pressure weighed on the token throughout the month.
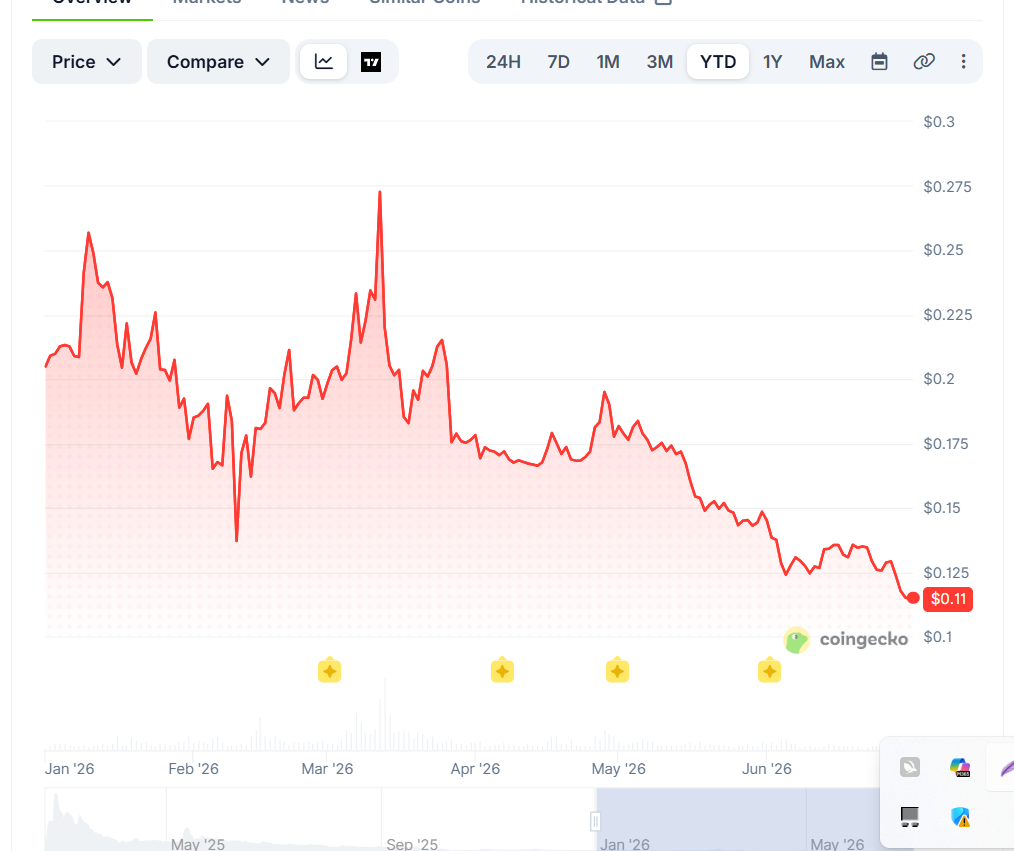
By June 30, 2026, Pi Network hit a new all-time low of $0.1127.
By July 2026, Pi Network plunged to a fresh all-time low of $0.1025, extending its prolonged downtrend as persistent selling pressure and weak market sentiment pushed the token below the key $0.11 support level.
BKX Services Inc. and David Namdar have filed a class action lawsuit against BitMEX.
The plaintiffs accuse the exchange of market manipulation and misappropriating nearly 623 BTC due to forced liquidations.
Lawsuit Questions BitMEX’s Liquidation Practices
Filed on the same day the exchange announced it would shut down, the two claim that BitMEX’s internal trading team accessed customers’ private information and continued trading while servers were down and users were unable to access the platform.
BitMEX has faced accusations over its liquidation practices and internal trading advantages in the past, with the latest lawsuit reviving these allegations.
According to the complaint, the exchange offered its customers leveraged trading of up to 100 times their collateral but allegedly liquidated their positions before all assets had been used up. This resulted in users losing their positions while the remaining BTC collateral was worth more than the losses incurred.
Instead of refunding the excess BTC to traders, BitMEX allegedly redirected the funds to its insurance pool, which, according to the plaintiffs, made it possible for the platform to financially benefit from forced liquidations.
“BitMEX deliberately developed a system that profited from the liquidations,” read the filing.
The filing also cites an old 2020 case where Brett Messieh and other traders sued the platform for similar offenses. Here, the group accused the company of rigging trading conditions in its favor, resulting in financial losses for users. But the court threw out the case for a lack of evidence.
Traders Lost Almost 623 BTC
Namdar says they lost more than 316.85 BTC in the process, while BKX says its losses were around 305.81 BTC. As a result, the two are looking to recover their seized crypto and damages. Furthermore, the proposed lawsuit seeks to represent U.S. customers who traded BTC perpetual swap products in transactions dating back to July 23, 2018.
Earlier on Thursday, BitMEX owner HDR Global Trading said it will shut down the exchange after a strategic review, with the decision expected to take effect on September 23. The platform has already suspended new account registrations, with traders now only allowed to close existing positions.
Following the announcement, BitMEX co-founder Arthur Hayes thanked his partners, employees, and customers for their support over the years. “It was an amazing ride,” he wrote, adding that he was proud the exchange was shutting down “responsibly on our own terms.”
Bitcoin’s mid-week price rally that drove it to a monthly peak of $67,000 came to a halt, and the asset dipped below $64,000 earlier today, erasing essentially all the gains it had recorded.
Here are the two possible reasons behind this nosedive.
ETF Investor Exodus
At first, we begin with the spot exchange-traded funds tracking the largest cryptocurrency. They were on a seven-day roll that began last Tuesday and had attracted roughly $1 billion within that timeframe for the first time since April. However, investors changed their minds once again on Thursday, pulling out over $200 million worth of BTC. This coincided with the asset’s initial retracement that drove it toward $65,000.
More recent on-chain data from today, though, claimed that BlackRock has continued to dispose of BTC for its clients, sending approximately $203 million to Coinbase Prime, which it always uses when it liquidates some of its ETF positions.
Of course, the actual damage for the entire day will be announced tomorrow when data providers such as SoSoValue update their numbers. For now, though, the uncertainty remains relatively high given the latest trend shift.
BlackRock moved 3.126K $BTC (~$203M) from its IBIT Bitcoin ETF wallet to Coinbase Prime.
Ever since he returned to the White House, President Donald Trump has made numerous attempts to impose tariffs on essentially all countries at one point. What’s particularly interesting is the fact that nations within the EU have become the main target, even though they are supposed to be allies.
History shows that the darkest hours of tariff threats have impacted BTC severely, including last April when the asset tanked. The past few hours brought another example of this, which coincided with the asset’s retreat to just under $63,000.
He blamed the bloc for imposing substantial penalties on some of the largest US companies, such as Apple, Meta, and Google, and warned that his administration will “immediately initiate a 301 Investigation into the practice of “ROBBING” American Companies and, in turn, the American Taxpayer.” In addition, he outlined an upcoming wave of tariffs.
“The European Union will pay a very big price for this illegal and highly unethical conduct, which I have consistently warned them about. The penalties will be entirely reversed and, we anticipate, a substantial TARIFF to be placed on them at the earliest possible moment,” reads the message.
A new policy has emerged in India, as a parliamentary committee has asked the Indian government to allow industry-run Self-Regulatory Organizations to regulate India’s crypto market under the auspices of the Reserve Bank of India (RBI) or Securities and Exchange Board of India (SEBI).
This presents a temporary solution for the 39 million people who trade digital assets without any regulation to protect them.
An interim watchdog while a permanent legislation awaits
The Parliamentary Standing Committee on Finance made the recommendation in its 36th report on the proposed Securities Markets Code, 2025. The report was brought before Parliament on July 23. The panel believes recognized SROs should enforce conduct standards for now, while proper crypto legislation is in the works.
The Self-Regulatory Organizations (SROs) would be under the supervision of the Reserve Bank of India or the Securities and Exchange Board of India.
Utmost priority will be placed on investor protection, with SROs expected to audit exchange reserves, separate customer money legally from company balance sheets, and manage complaints from customers.
The committee observed the systems operational in the United Kingdom, Singapore, the United States, and the European Union before arriving at the idea of an SRO.
Taxed at 30% but without legal recognition
India currently has no statute recognizing digital assets as a formal asset class. What it does have, however, is a 30% flat tax on crypto profits and a 1% tax deducted at source on transactions, as Cryptopolitan reported before. It also has a Financial Intelligence Unit where money-laundering cases are reported and handled.
The absence of any legislation is where the problem lies and is what the panel is trying to solve. According to the Ministry of Finance, crypto-assets are outside India’s regulatory purview except for taxation, anti-money-laundering, and reporting rules.
The committee also sought clarity with the legal definitions of digital assets because some tokens may act like securities, some like derivatives, and others may belong in a whole different category.
The RBI still tilts towards a ban
The recommendation comes weeks after the Reserve Bank of India pushed for the outright prohibition of crypto for banks while contemplating the banning of private fiat-backed cryptocurrencies. The RBI suggested to the committee in May and June, claiming dollar-pegged stablecoins would interfere with India’s monetary sovereignty.
The tax authorities agree with the RBI. Tax officials believe offshore trades are tough to track, with less than 25% of the 645,000 people who transacted in crypto in the year to March 2023 reporting their profit.
The RBI said the domestic market had 54 FIU-registered service providers and 39.3 million KYC-verified users holding ~20,437 crore rupees, approximately $2.4 billion.
Why the offshore drain is a strong argument
Critics of the present taxation system argue that it has driven crypto activity out of the country, rather than increasing it.
Raghav Chadha, a member of Rajya Sabha, told Parliament in February that about 73% of India’s crypto volume had moved to foreign exchanges and about 120 million Indians make use of foreign platforms, with ~180 crypto startups leaving the country. He argues, “Prohibition is not protection. Regulation is protection.”
Manhar Garegrat, head of Liminal Custody, told NDTV the recommendations are “a constructive step toward building a more mature digital asset ecosystem in India.”
The next steps lie with the government, which the committee expects to draft robust legislation as well as legal definitions of digital assets, all with the goal of assisting the interim SROs.
Monero price prediction suggests a bullish trend, with XMR anticipated to reach $750.178 by the end of 2026.
XMR could reach a maximum price of $924.484 by the end of 2029.
By 2032, Monero’s price may surge to $1,593.845.
Monero (XMR) stands out in the crypto space for its strong focus on privacy and decentralization of transactions, particularly within the Monero network, making it one of the leading privacy focused cryptocurrencies. This makes it a popular choice for privacy advocates and those prioritizing security. The Monero ecosystem constantly evolves, marked by significant milestones like enhanced protocol upgrades and growing adoption across various sectors, which underscore its utility.
As Monero progresses, many wonder about its future price trajectory. Will its unique features drive significant value growth, as many traders speculate, and can a price prediction tool provide insights into this? Can it sustain its competitive edge in the ever-evolving crypto market? Will the price of xmr recapture its ATH at $798 in the long term forecast?
Overview
Cryptocurrency
Monero
Token
XMR
Price
$360.32(2.08%)
Market Cap
$6.76 B
Trading Volume (24-hour)
$107.4 M
Circulating Supply
18.78M XMR
All-time High
$798.91 Jan 15, 2026
All-time Low
$0.213, Jan 15, 2015
24-h High
$363.43
24-h Low
$349.14
Monero price prediction: Technical analysis
Market Sentiment
Bearish
50-Day SMA
$334.12
200-Day SMA
$378.83
Price Prediction
$372.25 (+16%)
Fear & Greed Index
11.36 (Extreme Fear)
Green Days
16/30 (54%)
14-Day RSI
51.91(Neutral)
Monero price analysis
TL;DR Breakdown
Monero price analysis shows a bullish market sentiment
Cryptocurrency gained 2.08% of its value in last 24 hours
XMR finds support at $356 mark
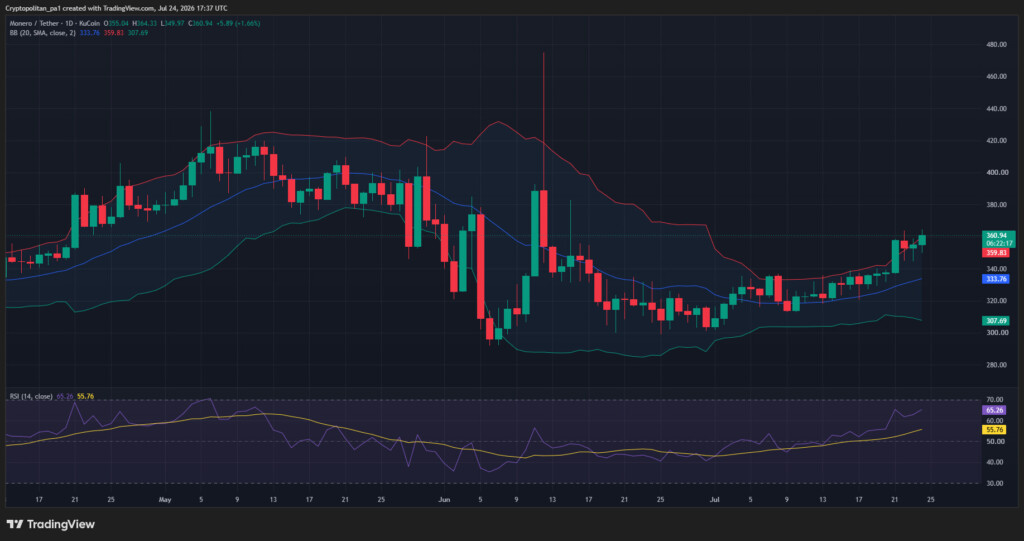
On July 24, Monero price analysis revealed a recovery back to $360 as bulls hold strong
Monero price analysis 1-day chart: XMR recovers to $360
The one-day price chart for Monero shows a recovery back to the $360 mark.
The Bollinger Bands are converging suggesting declining volatility. The Relative Strength Index (RSI) is trading at the center of the neutral region. The indicator’s value was recorded at 65.26 today showing rising bullish momentum. Further volatility can be expected if the buying momentum intensifies and the $360 mark is breached.
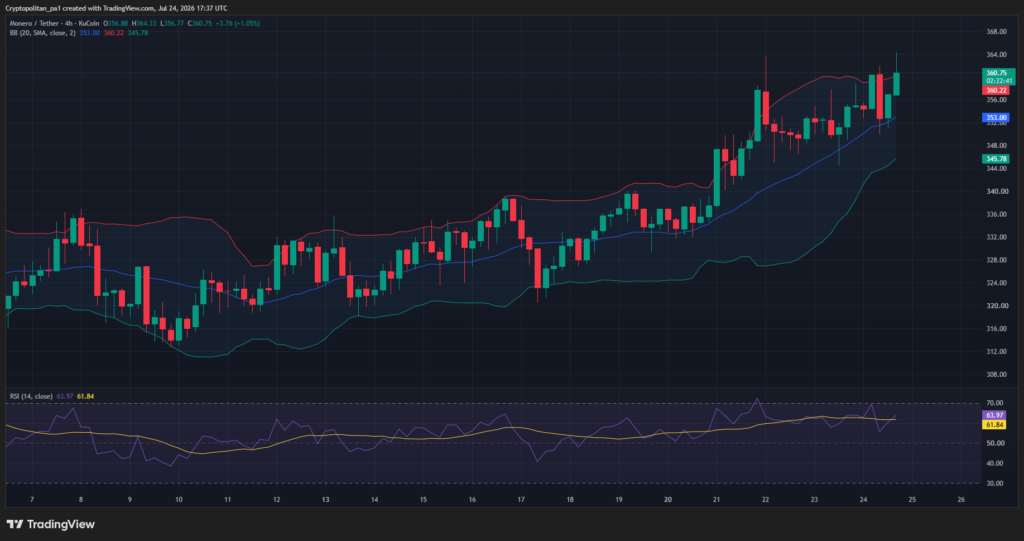
Monero price analysis 4-hour chart
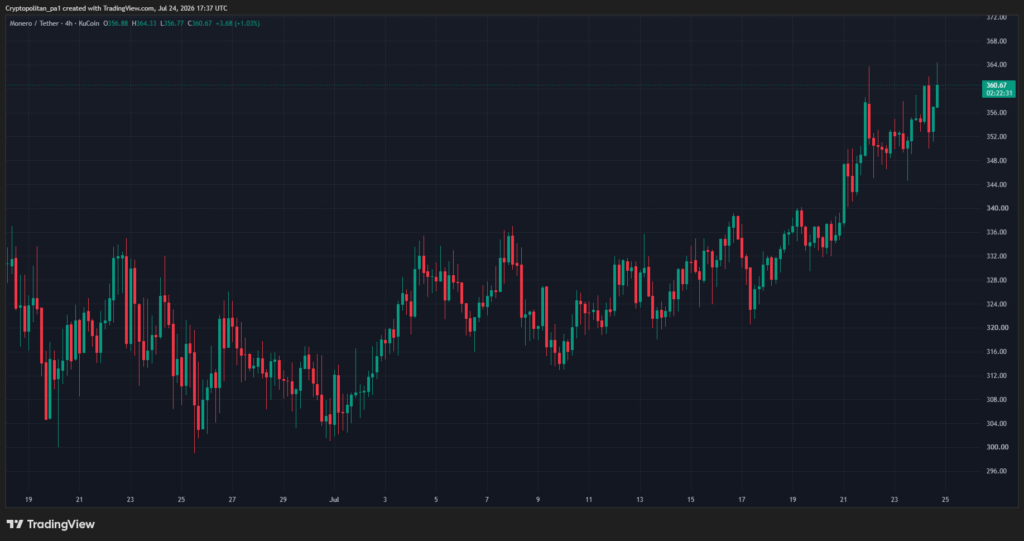
The four-hour chart analysis of Monero shows rapid recovery after a brief struggle at $350 mark. Following the crash, the price made a swift move to the current $360 level.
The Bollinger Bands are wide suggesting high volatility. The Relative Strength Index (RSI) indicator is trading in the neutral region suggesting low momentum on either side. However, while XMR finds short-term resistance at the $360 mark, the rising bullish pressure means that further incline is not out of question. XMR must push through the level in the next few candles to prevent the bears from dominating.
Monero price analysis gives a bullish prediction for the asset’s short-term movements as the price rises to the $360 level. If a breakdown is observed, movement to $345 is expected while an incline at the level may suggest rise to $380.
Is Monero a good investment?
Monero is an attractive investment because it emphasizes privacy and security, utilizing advanced cryptographic techniques to ensure transaction confidentiality, which has created a strong demand in the market . Its growing adoption across various use cases and a decentralized development model enhance its long-term potential.
With a limited supply and increasing investor interest, Monero offers a unique opportunity for those seeking financial autonomy and privacy to invest in cryptocurrency. However, investors should remain cautious of regulatory risks and market volatility when considering Monero as part of their portfolio, making it essential to seek investment advice.
Why is XMR up?
Monero price analysis shows that XMR faced rejection from above the $350 mark, resulting in a drop to the current $348 mark before rapidly rising to the current $360 mark.
Will XMR recover to its all-time high?
Monero recently reached a new all-time high of $798 before experiencing a sharp correction. The privacy-focused blockchain is expected to stabilize and potentially recover as it continues to reduce technical debt and enhance its utility and privacy features. However, widespread adoption may be hindered by regulatory scrutiny and market volatility, keeping the asset highly speculative.
How much will Monero be worth in 5 years?
The Monero price prediction for 2031, is expected to reach a minimum of $463.56, while averaging $726.61. The maximum projected value is $989.65.
Will XMR reach $1000?
The chances of Monero (XMR) hitting $1,000 hinge on various factors, which will influence its future price movements. The adoption of privacy transactions and technological advances could increase demand. Favorable regulations and market sentiment toward privacy coins would also help. Yet, regulatory risks, competition, and market volatility creating an atmosphere of extreme fear are challenges that Monero traders could face that could hinder significant growth. $1,000 is possible with favorable conditions, especially considering the current price but market dynamics and regulations will shape its path.
Does XMR have a good long-term future?
Monero (XMR) has the potential for a strong long-term future due to its focus on privacy and security, which makes it attractive to users seeking anonymity. However, many investors have concerns regarding privacy, regulatory scrutiny, and notoriety from being the favored medium for some past criminals, which impact the current Monero sentiment. Monero’s commitment to ring confidential transactions and the broader monero project gives it a solid foundation for long-term growth, but it must carefully navigate market and regulatory landscapes.
Recent news/ opinion on Monero
Monero recently announced the release of a new ecosystem on May 26.
The XMR price prediction for July 2026 suggests a minimum value of $302.32 and an average price of $335.44. The price could reach a maximum of $401.09 during the month.
Month
Minimum Price ($)
Average Price ($)
Maximum Price ($)
July
302.32
335.44
401.09
Monero price prediction 2026
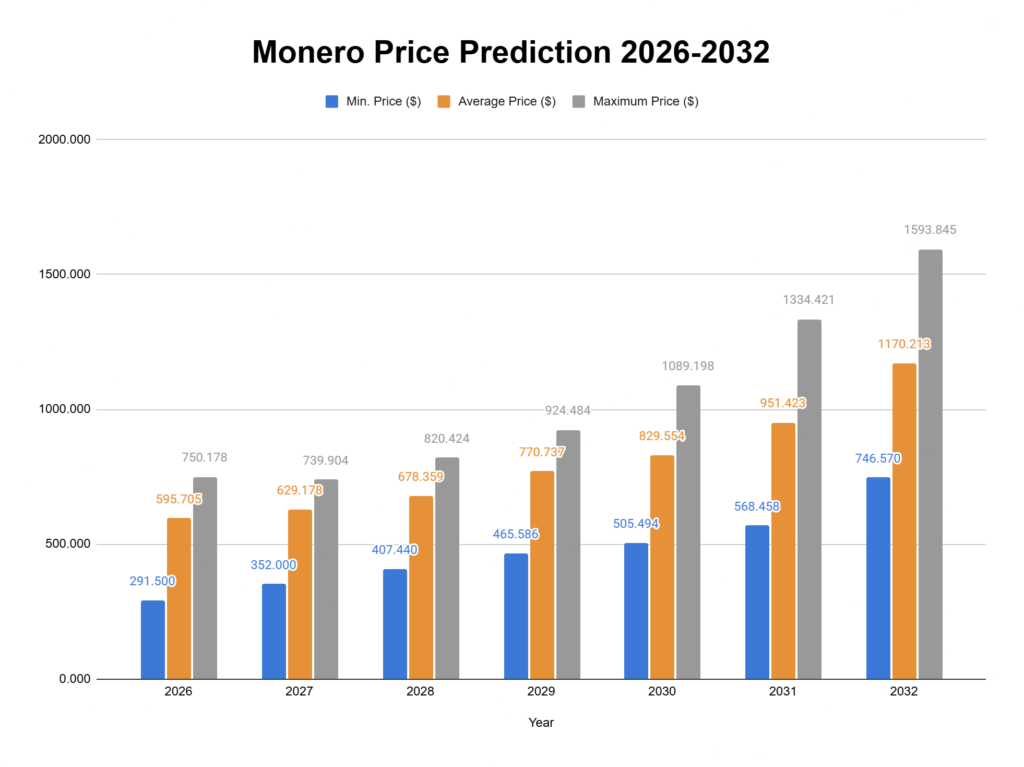
The Monero price prediction for 2026 anticipates a potential increase driven by growing adoption, with a maximum price forecasted at $750.178. Based on current analysis, investors can expect an average trading price of $595.705, while the minimum price could be around $291.500.
Year
Min. Price ($)
Average Price ($)
Maximum Price ($)
2026
291.500
595.705
750.178
Monero price prediction 2027-2032
Year
Min. Price ($)
Average Price ($)
Maximum Price ($)
2026
291.500
595.705
750.178
2027
352.000
629.178
739.904
2028
407.440
678.359
820.424
2029
465.586
770.737
924.484
2030
505.494
829.554
1089.198
2031
568.458
951.423
1334.421
2032
746.570
1170.213
1593.845
Monero Price Prediction 2027
In 2027, Monero’s value is expected to continue its upward trend, with a minimum price of $352.000, an average price of $629.178, and a maximum price of $739.904.
Monero Price Prediction 2028
For 2028, Monero is anticipated to trade at a minimum of $407.440, with an average price of $678.359, and a maximum price reaching $820.424.
Monero Price Prediction 2029
The price outlook for 2029 suggests Monero will maintain a minimum value of $465.586, an average of $770.737, and a maximum of $924.484.
Monero Price Prediction 2030
By 2030, Monero is forecasted to achieve a minimum trading price of $505.494, with an average price of $829.554 and a potential peak of $1,089.198.
Monero Price Prediction 2031
In 2031, Monero’s price is expected to reach a minimum of $568.458, while averaging $951.423. The maximum projected value is $1,334.421.
Monero Price Prediction 2032
In 2032, Monero is projected to continue its growth trajectory, with a minimum trading price of $746.570, an average price of $1,170.213, and a maximum price reaching $1,593.845.
Cryptopolitan’s Monero price forecast suggests a bullish outlook for XMR’s future should the market recover. According to expert analysis, Monero could reach a maximum price of $750.178, record a minimum price of $291.500, and trade at an average price of $595.705 by the end of 2026.
However, it is advised to do your own research and conduct expert opinion before investing in the volatile crypto market.
Monero historic price sentiment
XMR price history
Monero’s market value has changed dramatically since its launch in 2014, from less than $1 to over $475.
May 2021 marked the highest point in Monero’s history. Monero’s price projections revealed the coin’s security. They provide investors with optimism that they will be freed from the persecution of some authorities simply by buying or selling Monero
Across 2023, Monero’s price rose by 11.49%. The highest price was $278.56, and the lowest was $114.16.
In January 2024, Monero stayed stable around the $150.00 mark as market momentum remained low. However, the stability was short-lived as February crashed to $101.95. However, XMR showed swift recovery as it closed the month near the $150.00 level again.
In March and April 2024, XMR saw a steady decline from $150.00 to $120.00, where it found key support.
In May 2024, XMR observed steady bullish pressure as the price rose from $120.00, approaching resistance at $150.
In June 2024, Monero (XMR) traded within the $150 – $175 price range as either side struggled to make a clear breakthrough. In July, the crypto traded around the $155 mark as the price volatility remained relatively low. XMR opened trading at $156.05 in August and ended the month at $176.00, making remarkable gains.
September was bearish for the asset, as the price declined below the $160 mark by the end of the month. In October, Monero observed a steep crash and has been making a swift recovery since then.
In December, Monero made remarkable strides as the asset’s price broke past the $220 mark, albeit briefly as it closed the month below $200.
In January, Monero saw a bullish January as the price rose from below the $200 mark to $238 by the end of the month.
In February, the price fell towards the $215 mark as bears dominate the markets. In March, the price observes mixed momentum and closed the month slightly below $215. In April the consolidation continued until late into the month when it spiked past the $325 mark before ending the month around $275.
In May the price continued rising rapidly as the bulls cruised past $300 ending the month around $320. During June the price continued to observe high volatility but observed low net change as the asset closed the month around $313.
In July the price saw a huge spike in volatility as the price rose past $340 but the asset closed the month below the $310 mark. In August the price declined rapidly falling to the $260 mark by the month’s end. In September, the price rose to the $340 and while it did not maintain the level but managed to close the month above the $320 mark.
In October the price continued to rise ending the month above the $340 mark, a trend separating it from most other cryptocurrencies that saw a decline during the period. In November, the bullish rally continued with XMR crossing the $400 mark by the end of the month. In December, the bulls continued to charge ending the month above the $430 mark.
In January 2026, price volatility rose sharply establishing a new all-time high but ended the month below the $500 mark. In February, the declined continued with XMR ending the month around the $340 level.
The price consolidated in March, observing a slight decline to $325 by the month’s end. In April the price made swift recovery ending the month above the $375 mark. In May, the price observed high volatility before declining to the $360 mark by the end of the month. In June, the price declined further retracing to the $320 mark by the month’s end.
SEC Commissioner Hester Peirce has issued a new statement on crypto vaults and lending strategies, and the message is more nuanced than a simple pro-crypto or anti-crypto headline.
Peirce’s July 22 statement, titled “Headstands and Summervaults: A Statement on Crypto Vaults and Lending Strategies,” argues that putting an activity on-chain does not automatically move it outside federal securities laws.
That is the part crypto builders need to hear carefully.
The statement focuses on vaults, curators, managers, and lending strategies that may involve discretionary decisions. If someone is making investment decisions for users, setting lending parameters, choosing strategies, managing risk, or controlling interest and loan-to-value terms, the structure may start to look less like neutral software and more like an investment arrangement.
Peirce is often viewed as one of the SEC’s more crypto-friendly voices, but this statement is not a free pass. It is a warning that decentralization claims need to match how the product actually works.
TL;DR
Hester Peirce issued a statement on crypto vaults and lending strategies.
She warned that on-chain activity can still fall under securities laws.
Vault managers, curators, and lending strategy operators may create investment-contract questions.
The On-Chain Label Does Not Solve Everything
Crypto has a habit of treating technical design as legal destiny.
If something runs on smart contracts, builders may assume it is just software. If users deposit into a vault, the team may describe it as automated infrastructure. If a lending strategy is deployed on-chain, the marketing may focus on transparency and user control.
But regulators look at more than the code.
They look at who controls the strategy, who makes decisions, who users rely on, how returns are generated, and whether investors expect profit from someone else’s efforts.
That is why Peirce’s statement matters.
It does not say every vault or lending strategy is a security. It does not create a new rule. But it does remind the market that moving a product on-chain does not erase the economic reality of how it operates.
If users are relying on managers or curators to make decisions, the legal analysis changes.
They can automate yield strategies, manage liquidity positions, route assets across protocols, optimize collateral, or simplify complex activity for users. That is useful because most users do not want to manage every DeFi position manually.
The trade-off is reliance.
The more a vault abstracts away decisions, the more users may depend on the people or systems controlling the strategy. If a curator chooses assets, sets parameters, changes risk exposure, or determines where funds go, users may not be interacting with passive infrastructure. They may be trusting a manager.
That is where securities questions can enter.
This is one of the central tensions in DeFi. Better user experience often requires abstraction, but abstraction can create reliance on someone else’s efforts.
Peirce’s statement puts that issue directly on the table.
Lending Strategies Are Even More Sensitive
Crypto lending is especially sensitive because lending products have already been a major enforcement area.
Interest rates, collateral ratios, borrower selection, liquidation rules, and risk management all matter. If an operator controls those decisions, a lending strategy may look much more like a managed financial product than a neutral protocol.
Peirce’s statement notes that operators setting interest and loan-to-value rates may raise investment-contract concerns.
That does not mean all lending is illegal. It means structure matters.
A fully autonomous, user-controlled lending protocol may be analyzed differently from a vault where users deposit assets and rely on a strategy manager. A transparent smart contract may reduce some risks, but it does not automatically resolve the legal question.
A Crypto-Friendly Commissioner Still Wants Legal Precision
Peirce’s tone matters because she is not usually seen as hostile to crypto innovation.
That makes the statement more useful, not less.
If a commissioner sympathetic to open markets and digital asset experimentation is still warning that vaults and lending strategies can trigger securities laws, builders should take the point seriously.
The argument is not “do not build.”
It is closer to: understand the legal consequences of the structure you choose. If the product relies on managerial discretion, do not pretend it is only code. If users expect returns from a strategy someone else controls, securities law may enter the frame.
That is a practical warning for DeFi teams, especially those building yield vaults, lending managers, and curated strategy products.
The SEC Has Not Changed Rules Yet
The other caveat is equally important.
This is a commissioner statement, not formal rulemaking. It does not by itself change SEC policy, create new obligations, or settle how courts will treat every vault and lending product.
But statements like this can shape the conversation.
They tell lawyers, builders, investors, and regulators where the pressure points are. They also give the market a sense of how senior officials think about newer DeFi structures.
The takeaway for crypto is not panic. It is precision.
If a vault is genuinely non-discretionary, builders need to explain that clearly. If a lending strategy depends on managers or curators, the team should be honest about the reliance users are taking.
On-chain finance is becoming more sophisticated. Regulators are becoming more focused on the details.
Peirce’s statement makes clear that the label “decentralized” will not be enough if the structure still looks like managed investment activity.
Bitcoin is stuck near $65,000, and trader Wise Crypto thinks AI spending is a big part of why.
The OG crypto poked above $66,000 earlier this week before losing steam, and the pattern points to money chasing AI stocks instead of crypto while inflation and bond yields keep pressure on risk assets.
Where the Money Is Actually Going
Wise Crypto laid out the case on X Thursday, noting that while spot Bitcoin ETFs have had seven consecutive days of inflows that have raked in just under $1 billion, the number was a small one next to the $6.9 billion that left those same funds in May and June.
Meanwhile, Big Tech is spending somewhere between $190 billion and $205 billion on AI infrastructure this year, with Nvidia’s data center revenue up 92% year over year, and AI-linked stocks have climbed roughly 69% since January. Bitcoin, over that same stretch, is down about 25%.
“Capital is flowing to AI, not crypto,” Wise Crypto wrote, pointing to two-year Treasury yields near 4.3% and ten-year yields near 4.6% as the forces keeping the dollar strong and investors cautious on risk assets.
The price data backs up the stall, as BTC was trading around $65,400 at the time of writing, down 0.6% on the day, after swinging between about $65,300 and $66,300 in the last 24 hours and between $62,500 and $66,900 over the past week. It is still up close to 5% across 30 days but sits roughly 45% below its all-time-high near $126,000 from last October.
Another market watcher, Ted Pillows, writing in his Thursday market report, pointed to Brent crude being near $94 a barrel after another round of US-Iran strikes, along with a ten-year TIPS real yield of about 2.31%, a post-pandemic high, as the direct drag on non-yielding assets like Bitcoin right now.
“I’d rather watch $64,000 get defended than chase a run back toward $66,500,” he said.
The Technical Levels Traders Are Watching
Michaël van de Poppe has said Bitcoin has already reached its target area, and that holding above the 21-day moving average keeps the door open for near-term gains, with $68,000 marking the next resistance zone and a break above it potentially opening a run to $73,000.
Fellow analyst Axel Adler noted that ETFs have taken in $439 million so far this week, while the so-called Coinbase discount, running for 78 days now, has started to narrow.
Further out, EGRAG CRYPTO flagged a developing double bottom pattern that would need a weekly close above $83,000 to gain traction, with $173,000 the eventual target if the setup plays out, though a weekly close below roughly $51,000 would invalidate it.
A similar reaction zone between $67,900 and $68,300 was pointed to by Bitfinex analysts, who also noted that short-term holders who bought in that range tend to sell once they recover their original positions, a pattern that has capped rallies before and could do so again if $68,000 comes back into play.
Hackers took over the X account of Robinhood CEO Vlad Tenev on Thursday. They used it to push a new crypto coin, Vladhood (VLAD), that has already been flagged as a likely scam.
The fake post called VLAD the official mascot of Robinhood Chain. It even said the coin would be listed in the Robinhood app.
Inside the Robinhood CEO X Account Hack
Robinhood’s own accounts stayed silent. So did Robinhood Crypto. That was the first clue the post was fake.
The message started with a question. Does Robinhood love memes? It answered yes, then shared the coin’s address and signed off, “Welcome to the Hood.”
Robinhood CEO’s X Hacked to Push ‘Scam’ Meme coin on Robinhood Chain. Source: Vlad Tenev’s Account
The post has since been deleted.
A blockchain tracker for Robinhood Chain marks the coin as a likely scam. The token holds no real money. It has changed hands about 1,868 times since launch.
According to on-chain monitoring by MLM, the attacker generated around 650 ETH in proceeds from the VLAD token, worth approximately $1.2 million to $1.3 million.
Scams like this keep hitting the network. Reports of rug pulls have multiplied. The trick is not new. A fake coin named after Coinbase boss Brian Armstrong crashed this month, a lesson about trusting posts from executive accounts.
Meme Coins Keep Testing Robinhood Chain
Robinhood Chain went live on July 1. It is a new blockchain that Robinhood built on Ethereum. The company wants it to power tokenized stocks and other real-world assets.
But memecoins took over fast. The network now handles millions of trades a day. Risky meme coins drive most of it, and recently pushed it to record trading volume. Total trading has topped roughly $9 billion, according to Entropy Advisors.