The spot exchange-traded funds tracking Ripple’s cross-border token continue with their impressive performance in times of market uncertainty, and saw only one day of no reportable action in the past week, unlike the previous ones.
July also ended in the green for the funds, meaning that only one out of the nine months they have been active was in the red.
The Good Weekly and Monthly
Data from SoSoValue shows that Monday and Wednesday were quite modest in terms of net inflows. On both days, the ETFs attracted just under $600,000. However, the green streak continued and accelerated at the end of the business week, with $6 million in net inflows on Thursday and another $7.7 million on Friday.
Thus, the week ended with $14.86 million in the green, making it the best since the one that ended on July 2, when the funds attracted $17.19 million. On a monthly scale, investors poured in $27.29 million into the spot XRP ETFs.
What’s even better is that the funds have reached another all-time high in terms of cumulative total net inflows, at over $1.5 billion as of Friday’s close. Bitwise’s XRP has extended its lead over Canary Capital’s XRPC, with $511 million in net inflows compared to $467 million for the latter.
The Bad
Although July indeed ended in the green, the actual net inflows were not all that impressive. The $27.29 million places July as just the second-worst month, beating only January when investors inserted $15.59 million into the funds.
In contrast, June was a lot more positive, with the net inflows standing close to $60 million. May was even better, with almost $132 million. The all-time high from November at $666.61 million remains untouchable.
The Ugly
Although this improved at the end of the month, July saw the most days with no reportable action in terms of net flows. Precisely half of the trading days (11 out of the 22) saw no flows, according to SoSoValue, which, aligned with the more modest $27.29 million in net inflows, suggests dwindling interest in the funds.
Separately, the underlying asset’s price performance continues to disappoint despite the numerous positive developments in the broader Ripple ecosystem. Although it managed to defend the $1.05 support during the weekend, XRP is still below $1.10, and it’s down by more than 3% on a monthly scale. What’s even more worrisome is the fact that August has been a particularly painful month for the asset historically.
We will begin with the mandatory disclaimer, as we are well aware that historical performance does not guarantee similar moves in the future. However, history does tend to rhyme, and that’s what happened in July for BTC.
The question is: will August follow suit, as the month has not been kind to the largest cryptocurrency, especially the last four editions.
July Brought Some Gains
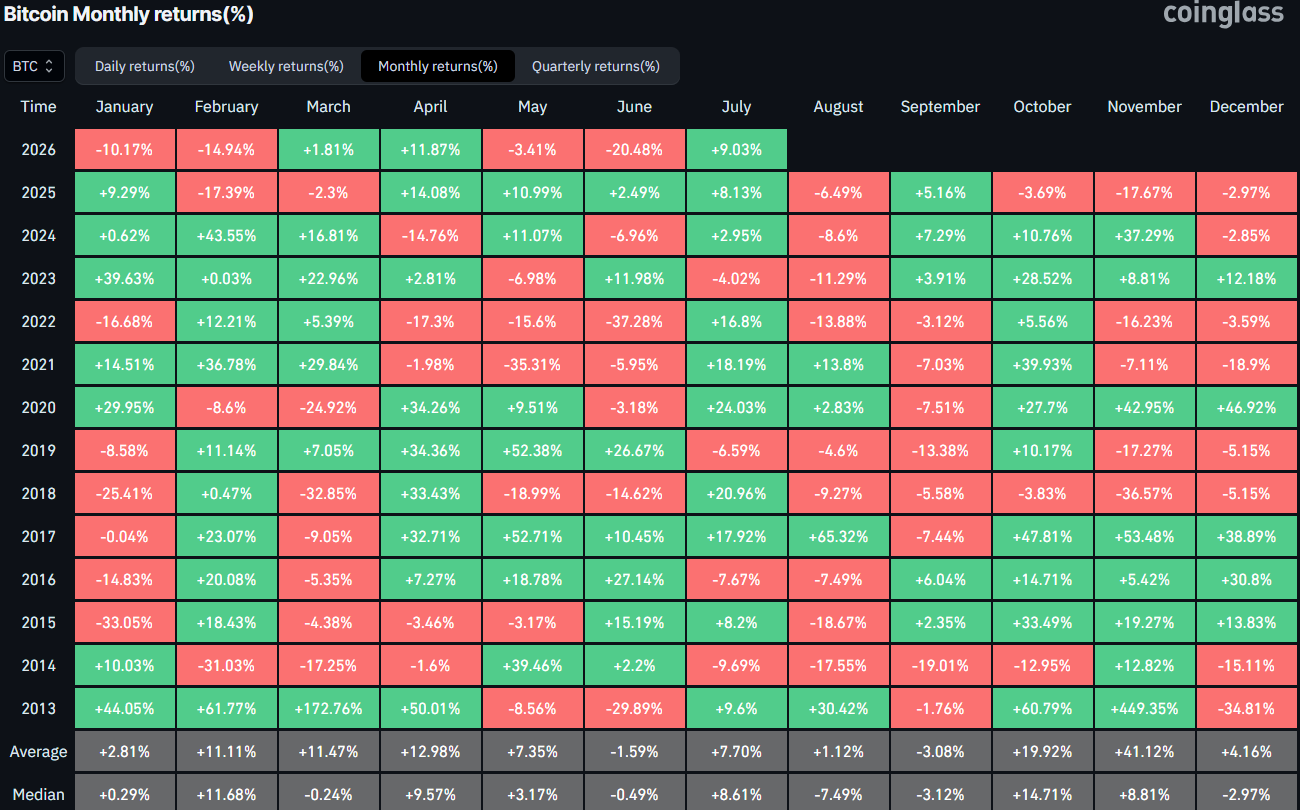
Before we explore what happened in July, here’s a brief outlook of the painful June, which set the stage for a rebound during the seventh month of the year. The 2026 edition of June became the most violent in terms of price moves for the cryptocurrency in precisely four years. It tumbled by 20.48% in 2026 compared to 37.28% in June 2022.
As such, it was almost expected that July would be a better month. History was also on BTC’s side as 9 out of the last 11 were in the green. However, the start was actually quite surprising as bitcoin dipped below $58,000 on July 1 for the first time in nearly two years.
The bears quickly lost control, though, and the asset reclaimed the coveted $60,000 level within a day or two. It wasn’t the most volatile of months, but BTC still managed to post some gains and peaked on July 21 at $67,000. This became its highest price tag in two months.
However, it was rejected there despite the softer-than-expected inflation data for June and the fact that the Fed refused to hike interest rates last week. Thus, bitcoin ended the month at under $64,000, which was still a 9% monthly increase.
Bitcoin Monthly Returns. Source: CoinGlass
Your Move, August
As popular analyst Ali Martinez put it yesterday: August hasn’t been kind to bitcoin. In fact, the last four have all been in the red, posting losses of 13.88%, 11.29%, 8.6%, and 6.49%, respectively. The silver lining is that the declines become less violent over time.
The broader August perspective is still deeply negative, though. Only three out of the last 12 editions have been in the green, with 2017 standing out as the most bullish one on record. At the time, BTC rocketed by over 65%, but it was a different time and a vastly different market phase.
For now, BTC enters August 2026 with lots of uncertainty not only within the industry itself, where interest has dwindled lately, but on a macro perspective as well. The war in the Middle East continues, and the one between Ukraine and Russia too, while inflation remains an issue, and Trump’s controversial actions tend to halt each breakout attempt in its tracks.
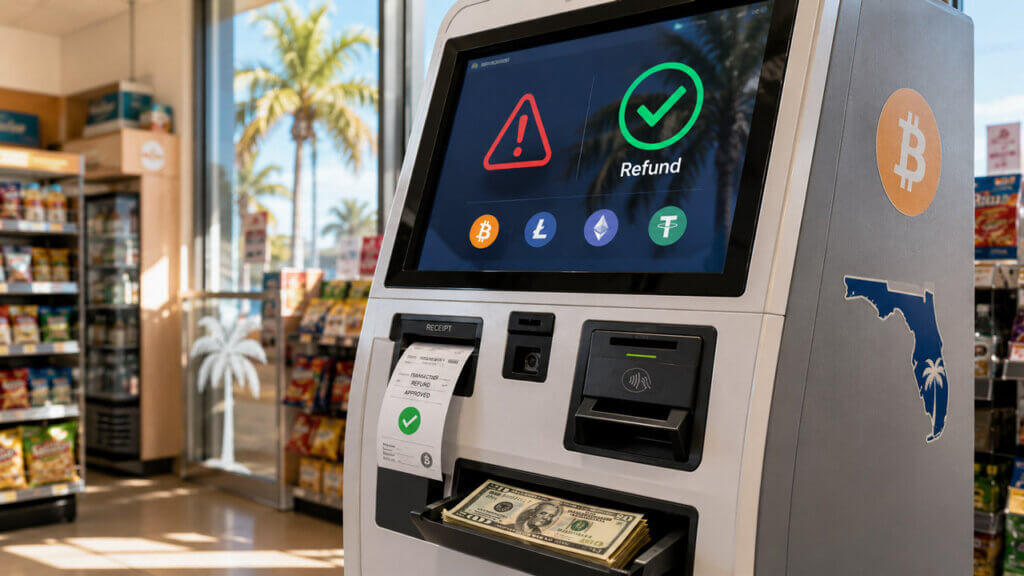
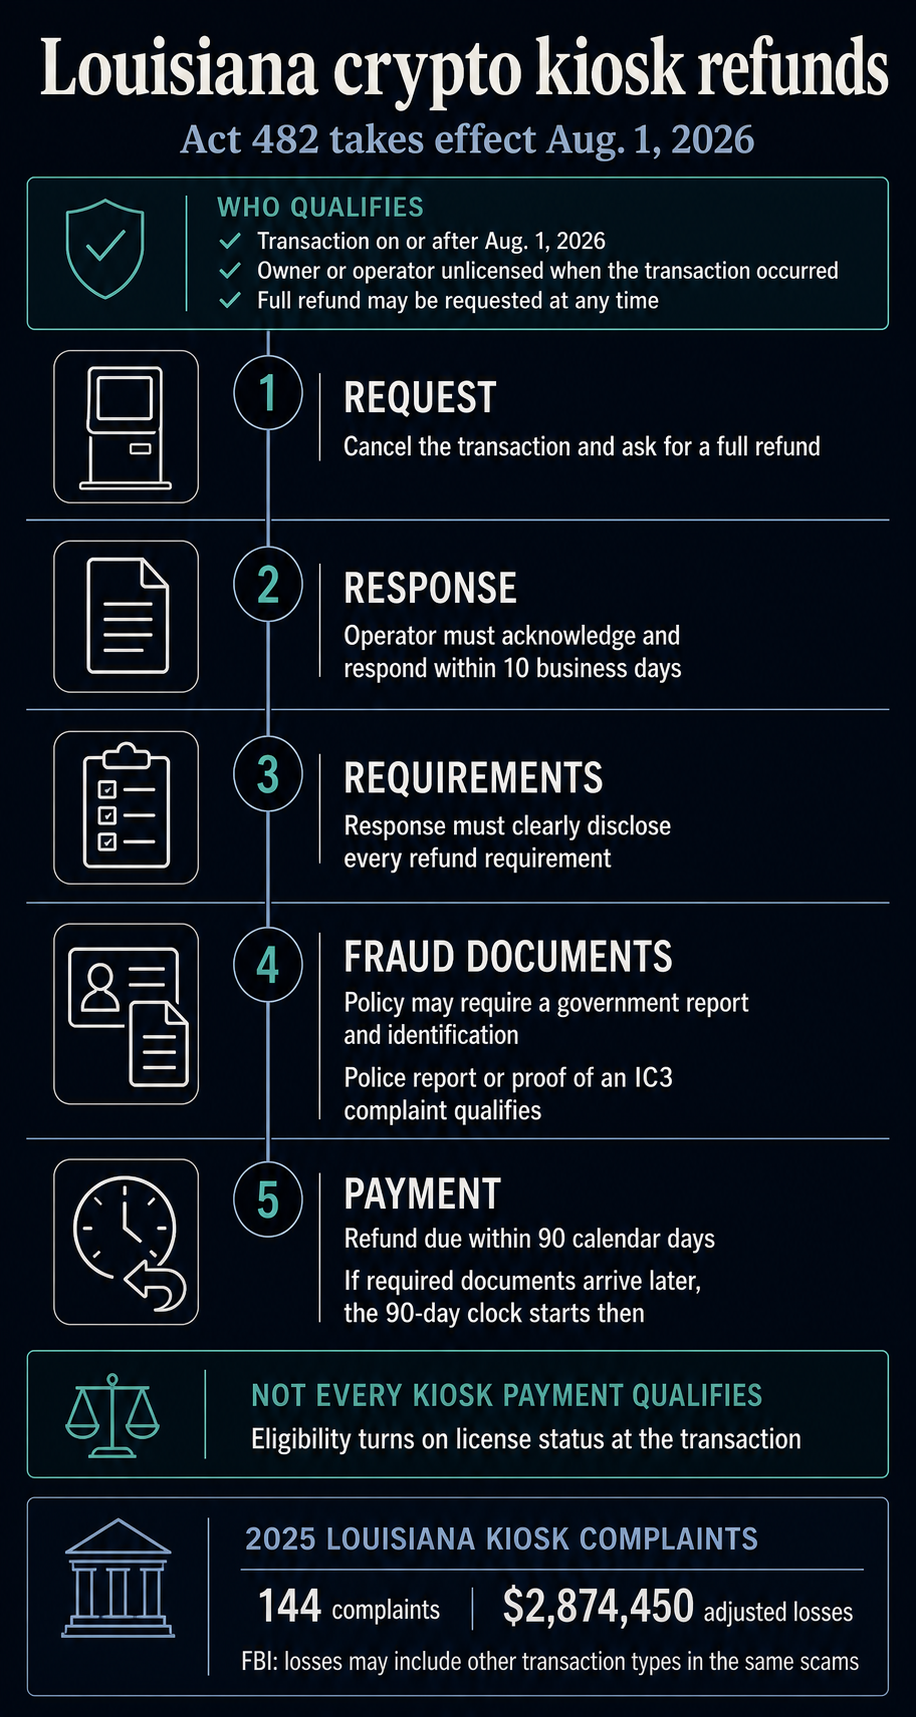
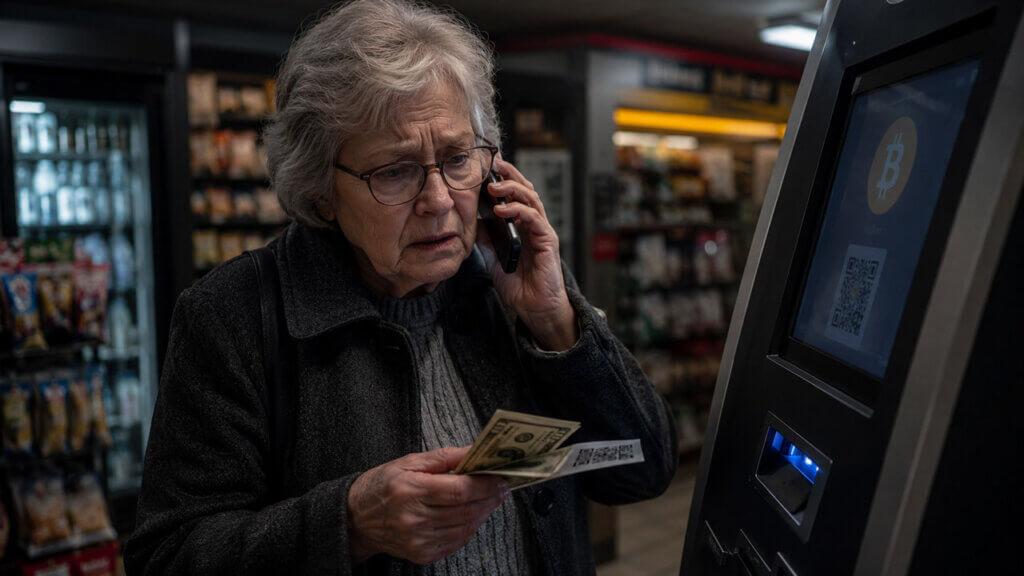
Starting Aug. 1, Louisiana users may cancel a virtual-currency-kiosk transaction made on or after that date and demand a full refund at any time if the machine’s owner or operator was unlicensed when the transaction occurred.
Act 482 puts the cost of an eligible refund on the operator. Eligibility depends on the operator’s license status when the transaction occurred, so the provision does not cover every kiosk payment. The act separately preserves Louisiana’s general rule requiring an operator to hold a transaction for 72 hours or allow the user to cancel within 72 hours for a full refund. The measure takes effect Aug. 1.
For a cancellation and refund request made under R.S. 6:1389(B), the operator must acknowledge and respond within 10 business days. Its response must clearly disclose all requirements for obtaining the refund. The 10-business-day deadline applies to the response, not the payment.
The statute requires operators to provide live support through a toll-free number during kiosk operating hours, with that number displayed on the machine and included on the transaction receipt.
For a request based on suspected fraud, an operator may require proof of a police or other governmental-entity report and proof of identification. A police report or proof that the user filed a complaint with the FBI’s Internet Crime Complaint Center qualifies the activity as suspected fraud under the act.
A covered refund must be completed within 90 calendar days of the initial request. If the operator’s clearly communicated policy requires the report and identification and the user supplies them later, the deadline becomes 90 days from that submission. Payment can therefore arrive more than 90 days after the user first asks.
License status may require more than a current-list check. Louisiana law treats owning, operating, soliciting, marketing, advertising, or facilitating a kiosk in the state as virtual-currency business activity subject to licensing. As of July 31, the Louisiana Office of Financial Institutions listed 36 active virtual-currency business licensees.
The change arrives against a documented fraud backdrop. The FBI’s Internet Crime Complaint Center recorded 144 Louisiana complaints involving cryptocurrency kiosks and $2,874,450 in adjusted losses for 2025. The agency cautions that those complaints can include other transaction types within the same scams, so the loss total cannot be attributed solely to the kiosks.
Last week, OpenAI claimed that a group of its AI models had broken containment, successfully hacking into the systems of open source AI platform Hugging Face to cheat on a benchmark test.
In the wake of the announcement, two very distinct narratives have emerged surrounding OpenAI’s claims. Some say it was essentially a publicity stunt, with the company setting parameters for the test that pushed the models toward outrageous behavior. But others, including certain prominent researchers, warn that the hack should serve as a warning shot for an even more severe AI-enabled cybersecurity disaster that’ll inevitably take place as models become more sophisticated.
“This is the first time, to my knowledge, that an AI system has autonomously committed a crime,” said New York Times journalist Kevin Roose of the event. “If a human did to Hugging Face what OpenAI’s models did to Hugging Face, they would be charged with computer fraud, and potentially sent to prison or fined or prosecuted.”
Debate will surely continue to rage among wonks and skeptics. And new details aren’t exactly tamping out the sense of alarm: on Tuesday, OpenAI issued an update to its ongoing investigation, claiming the incident was worse than initially thought. In addition to hacking Hugging Face, the company now says, its models “used publicly exposed credentials at the account-level on other publicly available services,” totaling “four accounts on four services.”
“We’ll continue to notify service owners directly, and have not seen evidence of broader impact to these providers or other accounts on their services,” OpenAI wrote, without elaborating on which services were affected.
The news further raised alarm bells among some cybersecurity experts, highlighting ongoing concerns over the tech’s ability to evade protective measures. It’s a possibility that researchers have warned about for years, and the incident suggests that the threat is now turning from a possibility into a reality.
Experts also point out that the Hugging Face hack could’ve easily been prevented, further adding credence to the theory that OpenAI was looking for attention from the public. As cloud security firm Edera co-founder Alex Zenla told Wired, the hack was largely a result of callousness on OpenAI’s part.
“People are YOLO-ing really hard,” he said. “It’s shocking how little people have really thought about a scenario like this.”
“I consider all AI and anything AI touches to be fully untrusted — which is fine, you just need to build against that,” Zenla added. “And this situation proves the point. The fact that OpenAI wasn’t more paranoid about this seems kind of reckless.”
“A simple analysis of the actual risk has an actual simple answer,” security and compliance consultant Davi Ottenheimer told Wired. “The OpenAI mistakes were dead simple.”
As Wired points out, simple protections like fully isolating AI services from the internet could’ve prevented the hack, which have been intimately familiar to researchers for decades now.
Considering OpenAI is nearing a $1 trillion valuation and should have all the resources in the world at its disposal, major lapses in security should have anybody start questioning the company’s narrative.
Yet there could be truth to both versions of the story. It’s entirely possible that there is legitimate cause for concern as AI models become more sophisticated at identifying cybersecurity vulnerabilities. We’ve already seen frontier models flagging thousands of software bugs, underlining their growing competence.
But OpenAI is also heavily invested in showcasing its models’ capabilities to the world as it tries to keep up with Anthropic. That leaves the possibility that the company could’ve coordinated with Hugging Face to orchestrate the hack — or at least given its AI models a strong push in the direction of controversy.
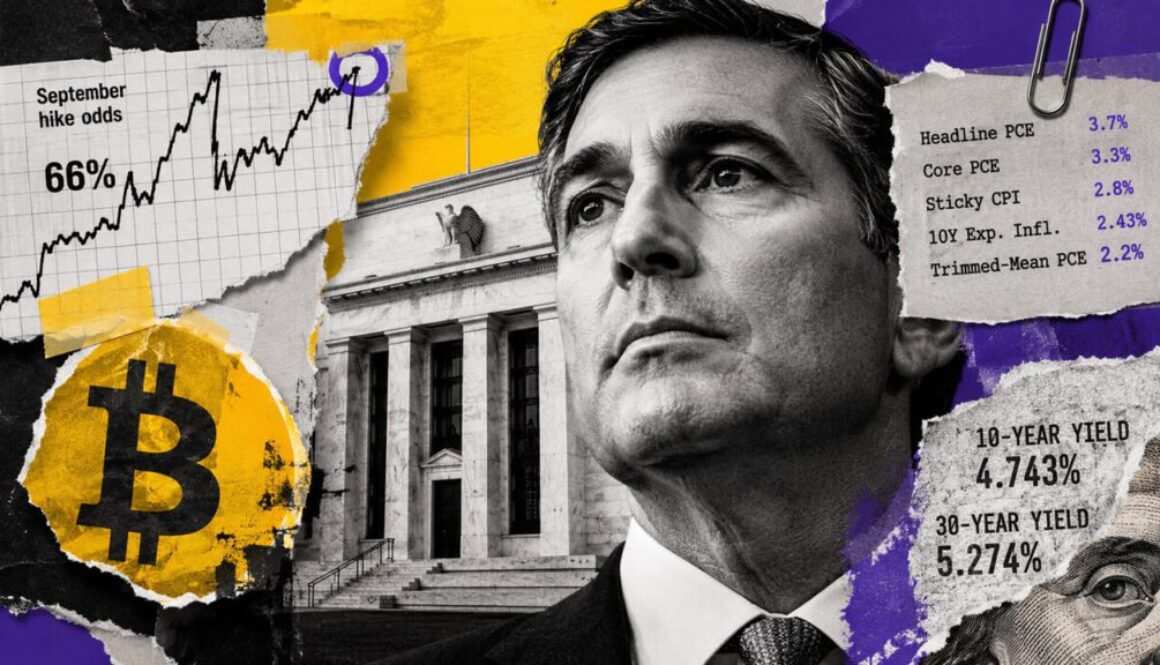
Bitcoin is trading near $63,000, with rate markets assigning roughly 66% odds to a September Federal Reserve hike, under a policy framework Kevin Warsh has left partly hidden.
The Fed chair has defined his reaction function around “underlying inflation,” then declined to disclose how he weighs the indicators that produce that judgment.
One economy supplies readings from nearly twice the Fed’s 2% goal to barely above it.
Inflation measure
Latest reading
Gap from 2% target
What it tells Warsh
Headline PCE
3.7%
+1.7 pp
Inflation still far above target
Core PCE
3.3%
+1.3 pp
Underlying pressure remains elevated
Atlanta Fed sticky-price CPI
2.8%
+0.8 pp
Persistent inflation is cooling, but not at target
Cleveland Fed 10-year expected inflation
2.43%
+0.43 pp
Long-term expectations remain contained
Dallas Fed trimmed-mean PCE
2.2%
+0.2 pp
Broad inflation is close to target
Warsh told reporters that the Fed’s January strategy document keeps PCE as its formal objective. He invoked Goodhart’s Law, said the central bank could revisit its strategy in January 2027, and described a broader data project that aims to “separate the noise from the signal.”
His operative judgment can therefore come from a wider set of inputs than the measure the formal framework identifies.
That distinction leaves Bitcoin traders pricing two unknowns at once: the next inflation readings and the weight Warsh assigns each one. A 3.7% headline figure supports tighter policy, and a 2.2% trimmed mean gives the Fed room to wait when long-term expected inflation sits near 2.43%.
The Fed is rebuilding its inflation lens
The Federal Reserve created five monetary-policy task forces on July 9. Raj Chetty, Doug McMillon, and Kevin Murphy head its Data Sources group, which will seek timelier economic information.
A separate Inflation Frameworks group will reconsider how the central bank interprets the drivers of inflation.
Warsh plans to review the groups’ work before Jackson Hole, and he left open the possibility that their early findings could shape his August speech. The next hard policy deadline arrives Sept. 15-16, when the FOMC meets with a new Summary of Economic Projections.
January 2027 then offers the first formal opening for a revised strategy statement.
The FOMC kept its target range at 3.50% to 3.75% through a 9-3 vote, with Beth Hammack, Neel Kashkari and Lorie Logan supporting a quarter-point increase. September hike odds neared 65% on July 31, and the Atlanta Fed tracker had placed the probability at 83.05% on July 29, illustrating how quickly traders reprice the path.
The 10-year Treasury yield ended July near 4.743%, and the 30-year reached 5.274%, its highest level in 19 years. Subtracting Cleveland Fed 10-year expected inflation of 2.434% from the nominal 10-year yield produces a simple expected real rate near 2.31%.
That real return competes directly with Bitcoin, which offers zero cash yield. Higher real rates raise the opportunity cost of holding BTC, support the dollar, and reduce the balance sheet capacity available for risk assets.
Bitcoin’s move toward $63,000 has occurred inside that tighter liquidity setting.
US-traded spot Bitcoin funds took in $233.1 million on July 30, then recorded $87.9 million of net redemptions on July 31. Cumulative net inflows stand near $51.56 billion, giving Bitcoin an institutional demand channel whose daily support can still reverse.
Date / marker
What happens
Bitcoin relevance
July 9
Fed creates five monetary-policy task forces
Confirms Warsh is formally rebuilding the policy lens
July 29
FOMC holds rates at 3.50%–3.75% in a 9-3 vote
Three dissents show September tightening risk is live
July 29
Atlanta Fed tracker probability at 83.05%
Shows how aggressively traders can price a hike
July 31
September hike odds near 65%
Shows rate pricing remains volatile
Late August
Jackson Hole
First possible clue on Warsh’s weighting system
Sept. 15–16
FOMC meeting and new projections
First major rate decision after the data cycle
January 2027
Possible revised Fed strategy statement
Formal opening for changes to the inflation framework
When headline PCE sets policy
The bearish path starts with Warsh treating headline PCE at 3.7% and core PCE at 3.3% as the best evidence of generalized inflation.
Higher oil prices, firmer inflation expectations and continued economic resilience would reinforce that interpretation, giving the three July dissenters a stronger case for September.
Rate markets would push up hike odds, Treasury yields would stay firm, and the dollar would gain another source of support. Bitcoin would then face tighter financial conditions alongside mixed ETF flows, placing renewed stress on the $62,000 area.
A sustained loss of $62,000 would bring $60,000 into the immediate price map. The late-June zone near $58,000 enters only once sellers establish acceptance below $60,000. Confirmation would come from higher real yields, firmer breakevens, a stronger dollar and another round of ETF redemptions.
The lower inflation gauges would carry less policy weight under this path. Warsh could conclude that trimmed measures remove too much of the tariff and energy transmission entering household prices, leaving the 2.2% reading unable to justify patience.
The path through trimmed inflation
The bullish path requires Warsh to classify energy and other volatile categories as noise, giving greater weight to trimmed-mean PCE at 2.2%, sticky-price inflation at 2.8%, and 10-year expected inflation near 2.43%. Continued cooling across those measures would give the Fed room to hold in September.
Lower hike odds would ease real yields and weaken the dollar’s support, reopening liquidity for Bitcoin. BTC would first need to recover $64,500, then clear the Friday high near $65,300.
A clean move through that area would reopen $66,000 and $68,000.
Scenario
Warsh’s inflation read
Macro reaction
Bitcoin confirmation
Price map
Bear case: headline PCE drives policy
3.7% headline PCE and 3.3% core PCE are treated as the signal
Hike odds rise, yields stay firm, dollar strengthens
ETF redemptions resume, real yields rise, $62,000 fails
$60,000 comes next; $58,000 only after $60,000 breaks
Base case: dashboard stays unresolved
High headline inflation and low trimmed inflation both remain plausible
Rates and dollar swing with each Warsh comment
BTC fails to hold above $65,300 but does not lose $62,000
Range between $62,000 and $65,300
Bull case: trimmed inflation drives patience
2.2% trimmed mean, 2.8% sticky CPI and 2.43% expectations carry more weight
Hike odds fall, real yields ease, dollar support weakens
Spot-market buying, falling open interest during the rebound and renewed ETF creations would strengthen that case. Those conditions would tie the advance to spot demand and reduced hedging demand, giving Bitcoin a firmer foundation than a derivatives-led burst.
Jackson Hole may provide the first public clue about Warsh’s weighting system, and Sept. 16 carries the rate decision and fresh projections.
By then, markets may know every major inflation print and still lack the formula that converts those readings into policy, and Bitcoin is already trading that gap.
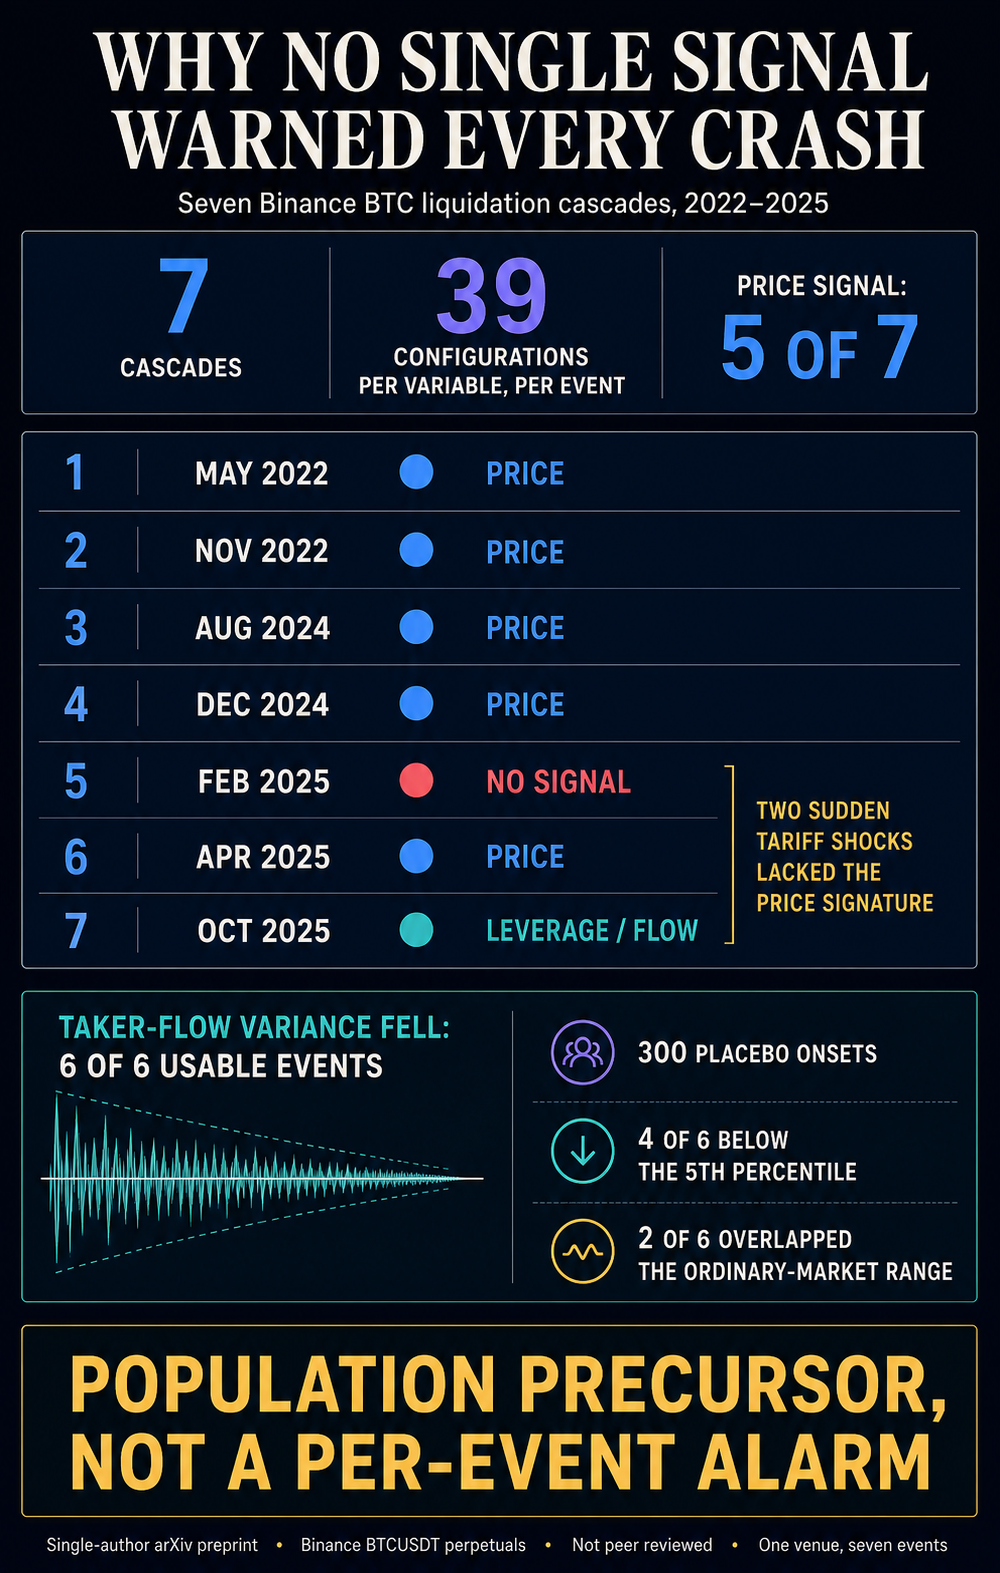
A new arXiv preprint studying seven major Bitcoin crashes found the warning signal shifting among price, leverage, and order flow from one event to the next.
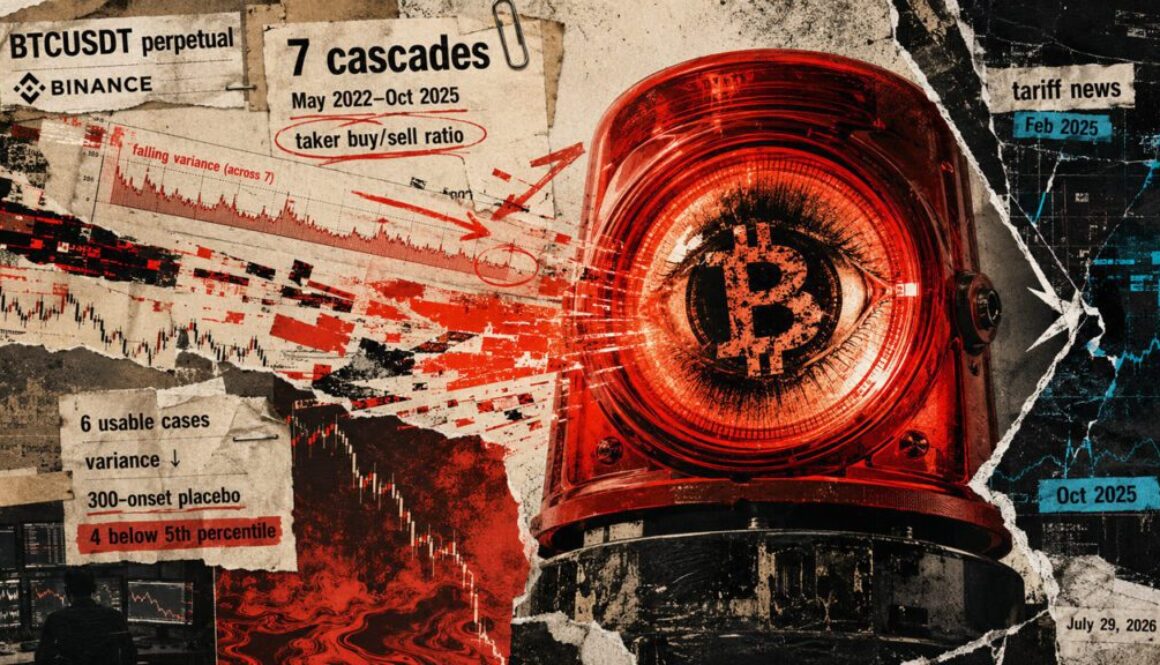
One clue echoed across six usable cases. Taker order-flow variance tightened before each cascade, a faint weather front across the group rather than a siren traders could trust to call the next crash.
Ramon Marc Garcia Seuma submitted the single-author paper on July 29, 2026. The work has not been peer reviewed. It analyzed Binance’s USD-margined BTCUSDT perpetual market across cascades from May 2022 through October 2025, using one-minute price bars and five-minute open interest, trader positioning, and taker buy/sell data over roughly two-month event windows.
In the study’s framework, a market nearing a critical transition should recover more slowly from disturbances, leaving price or market structure with more statistical memory. The author tested rolling variance and lag-1 autocorrelation on detrended residuals across 39 combinations of analysis windows for every variable and event.
Price carried that signature in five of the seven cascades, but not in the February and October 2025 events tied to sudden tariff news. The paper proposes a possible split: cascades that build as markets absorb stress may leave a price signal, while abrupt external shocks may not. With only two events in the sudden-shock group, however, the author describes that pattern as a hypothesis to test, not a validated taxonomy.
The strongest warning against generalizing came from the paper’s out-of-sample test. October 2025 appeared to show the signal in leverage and order flow rather than price. When the same analysis was applied to the August 2024 cascade, the pattern inverted: price carried the signal while most leverage and flow variables did not. No tested variable carried the same positive critical-slowing-down signature across all seven events.
One inverse order-flow pattern did recur, but it did not solve the per-crash warning problem. Falling variance in the taker buy/sell ratio appeared before every cascade with usable data, covering six events.
All six observations fell in the left tail of a 300-onset placebo distribution, and four were below its fifth percentile. Yet two events overlapped the ordinary-market range individually, so the paper classifies the compression as a population-level precursor rather than a reliable alarm for a specific crash.
The sample covers seven events on one exchange, some 2022 series are incomplete, and the public leverage and flow measures are proxies because direct intraday liquidation snapshots were unavailable. Other public gauges previously discussed by CryptoSlate, including basis, ETF flows and collateral settings, were not tested as early-warning candidates.
A later liquidation event shows how much remains outside the evidence. CryptoSlate reported roughly $1 billion in forced derivatives closures during a June 25, 2026 Bitcoin selloff, after the study’s sample ended.
Most leading cryptocurrencies have headed south over the past 24 hours, yet Hyperliquid’s HYPE is among the few to defy the latest red wave.
While it has risen by a mere 1.5%, one analyst assumed it might be gearing up for a staggering 40% pump in the near future.
The Necessary Condition
Currently, HYPE trades at around $54.70, placing it above the lower boundary of an important channel depicted by Ali Martinez. He suggested that if the asset holds the $53 level, a move up to $75 is possible. Also speaking on the matter was Altcoin Sherpa, who claimed that HYPE’s current level is “a good spot for a bounce.”
“Expecting huge tradfi trading volumes to come over the next few days too, which helps,” the analyst added.
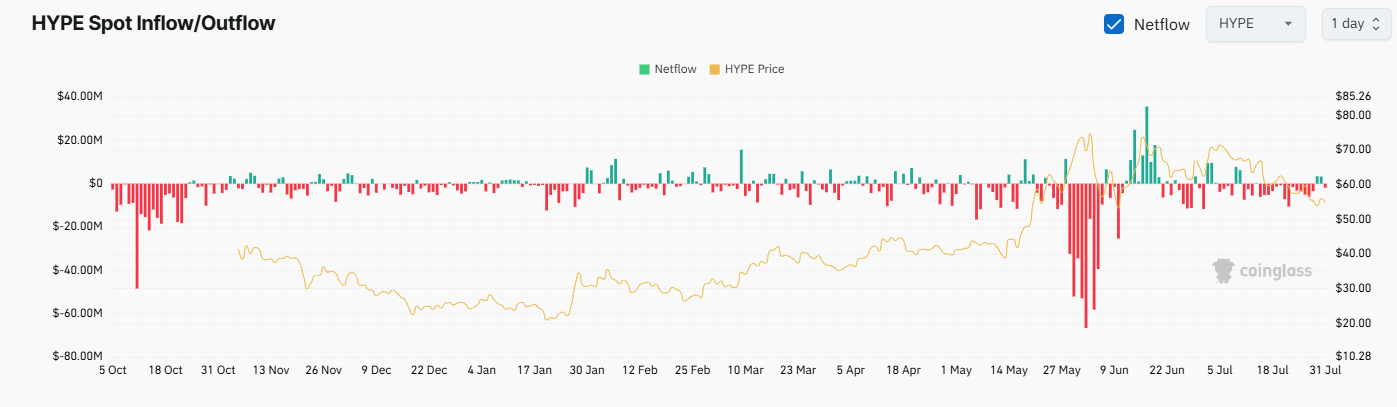
Some on-chain signals also suggest that the asset may post additional gains in the short term. CoinGlass’s data shows that exchange outflows have dominated over inflows in the last several days, meaning that investors have transferred their holdings from centralized platforms to self-custody solutions. This is considered a bullish factor since it reduces the immediate selling pressure.
HYPE Exchange Netflow, Source: CoinGlass
The Bearish Case
The number of pessimists, though, seems even more well-represented. X user Cut recently doubted HYPE’s potential, reminding of its inability to break its all-time high and wondering if its price would make a substantial decline. Ryker joined the discussion, projecting a plunge to $32 “soon.”
Cryptorphic also gave their two cents, arguing that HYPE is showing weakness after losing its long-term trendline and its price has broken below the key ascending support. They believe that if the $57-$58 range turns into resistance, the breakdown could confirm further downside, envisioning a possible crash under $30.
Meanwhile, the whales’ activity reinforces the pessimists’ outlook. Lookonchain disclosed that large investors keep selling HYPE, revealing the case of a market participant who purchased over one million tokens at an average price of $18 17 months ago and unstaked and deposited the stash into FalconX and Coinbase, perhaps with the intention to cash out.
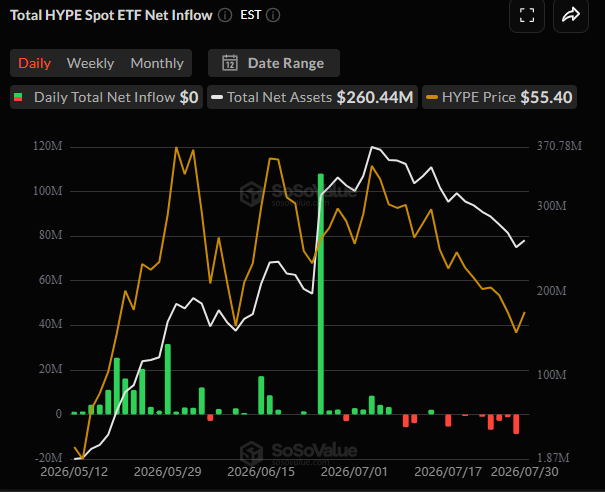
The waning institutional interest adds more weight to the bearish perspective. Spot HYPE ETFs, which attracted substantial capital in June, have not appealed to pension funds, hedge funds, and other conservative investors during most days of July, with outflows significantly dwarfing inflows.
Google Earth is the de facto record of our entire planet.
But today, the company undermined its own credibility with a dangerous new AI feature — and then quickly pulled it down after people started using it to generate blatant misinformation.
On Thursday, Google announced that it added an image generation tool straight into the web browser version of the app, allowing anyone to fabricate made-up satellite images of anywhere in the world.
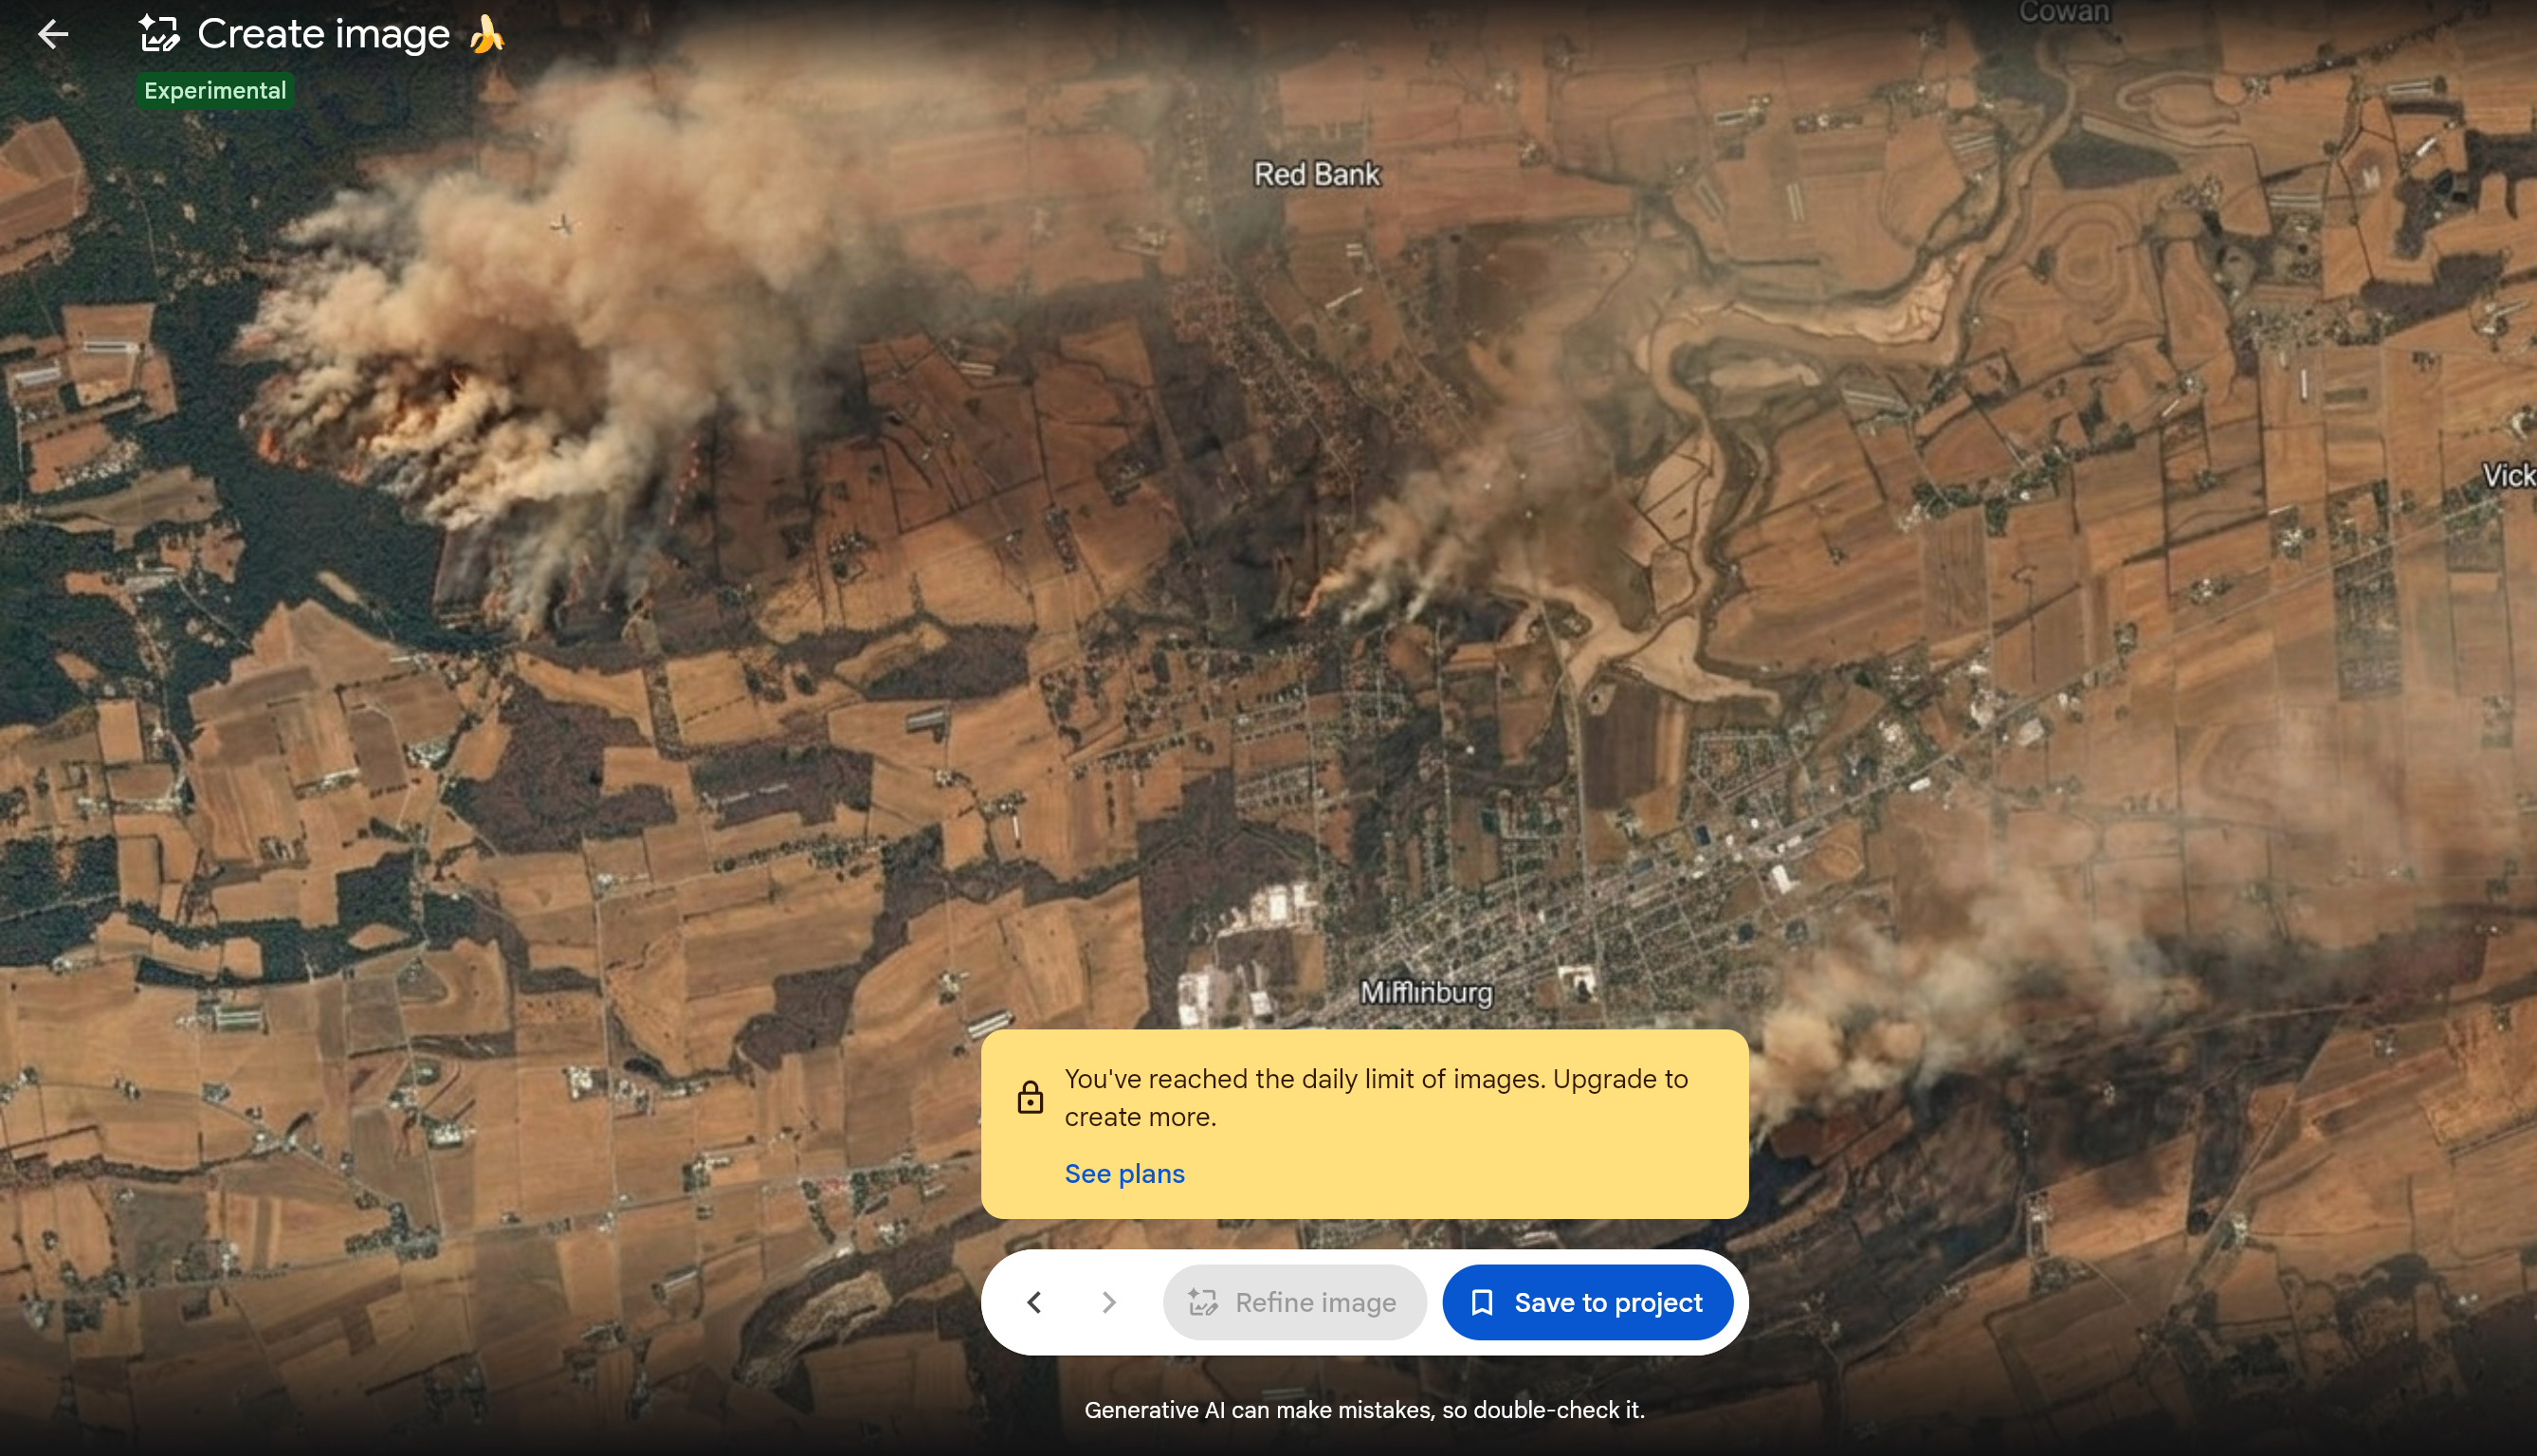
It was clearly a misinformation disaster. The AI tool, powered by Google’s Nano Banana 2 model, could make a neighborhood look like it’d suffered aerial strikes, turn unsuspecting locales into a warzone, and depict a city as the site of a natural disaster.
The AI integration left open source intelligence analysts, who heavily rely on the accurate satellite imagery to monitor areas and in particular conflict zones, especially baffled.
Hank Van Ess, one such OSINT researcher, reported on his Substack that he used Google Earth’s AI to place refugees near the Mexican border and put a nuclear plant in Iran. Both images could easily be used to fuel certain far-right narratives.
“What on earth is Google doing?” Van Ess pondered. Part of the danger, he noted, lies in Google’s own boast that the AI integration “creates concepts grounded in the real world.”
“Grounded in the real world means the invented thing is welded to genuine coordinates, drawn on genuine imagery, often in the same colours and the same light and at the same angle as the picture beside it,” he wrote. “The forgery does not have to look convincing on its own. It inherits the credibility of the map it was born on.”
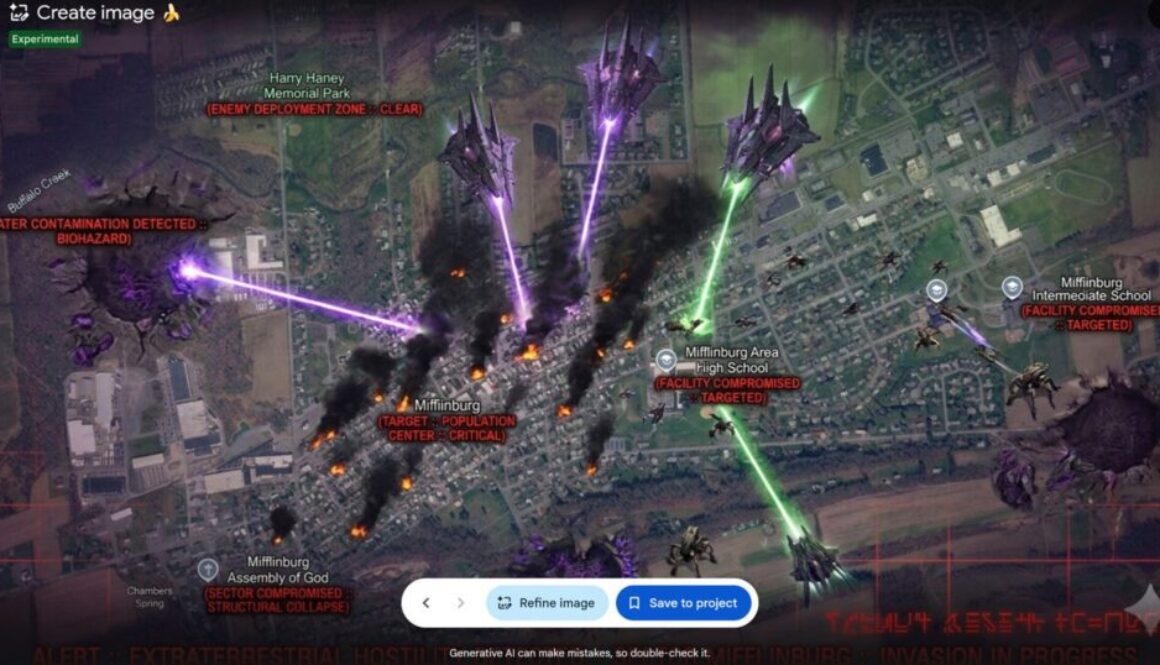
In our own tests, we found that the Google Earth AI would respond to a request to make a rural Pennsylvanian town look like it suffered a drought that caused dead crops and forest fires. The resulting image was fairly realistic, with huge plumes of smoke blowing over the area.
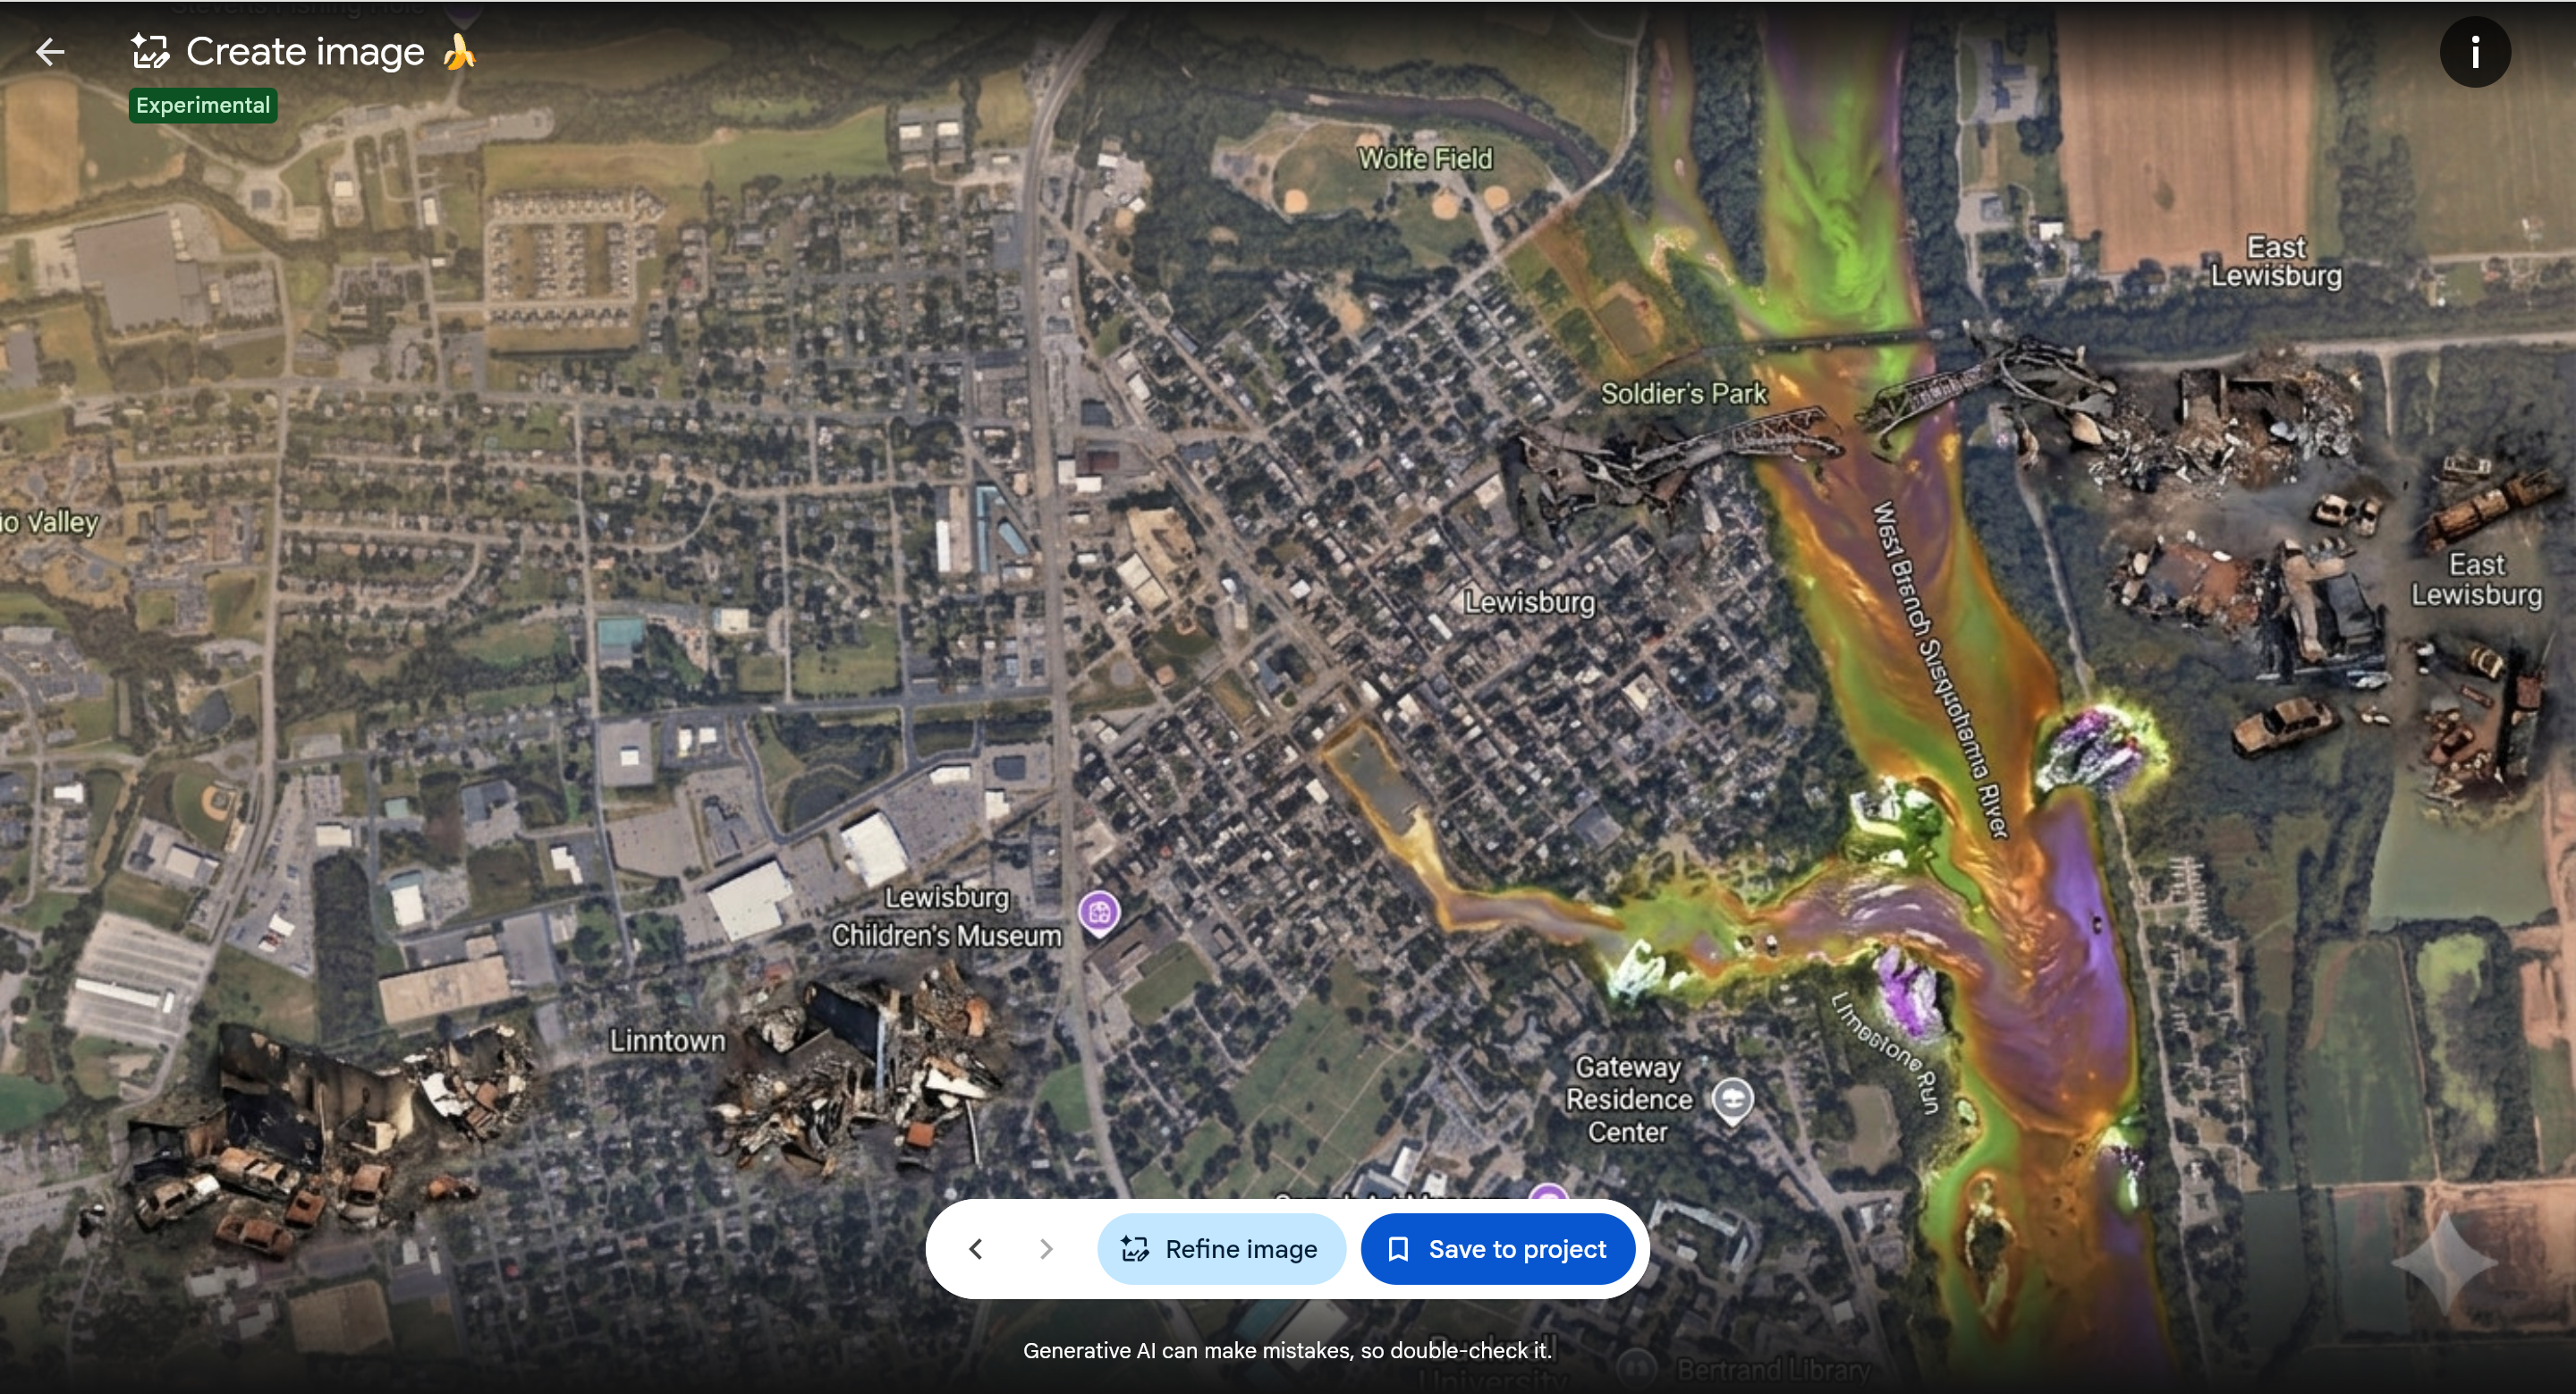
In a less convincing demonstration, the AI made a town look like it suffered a nuclear power plant meltdown by turning a nearby river into toxic sludge and scattering random images of demolished buildings and cars too large for their surroundings. It also responded to a prompt to show the same town “on fire and full of soldiers.” It complied with the request, though the requested soldiers looked like Little Green Army Men.
The AI tool appeared to have alarmingly few guardrails. Van Hess used it to add a hospital with a bomb crater in Gaza. We also found that it responded to a request to show the White House as in the middle of a warzone, with the explicit instructions of adding “blood” and “fallen soldiers.” Again, the AI had trouble producing humans that were proportionate to their surroundings, but it wasn’t hard to imagine someone with more time on their hands tinkering with the AI until they produced something realistic.
“We take misinformation seriously — every image created with Nano Banana in Google Earth includes the SynthID digital watermark, so if someone is unsure about an image, they can ask the Gemini app or use Lens in Search to see if the image was AI-generated,” the official News from Google account wrote. “In addition, we prevent image creation on harmful topics and are continually updating our protections.”
SynthID is Google’s watermark system that embeds hidden telltales in images generated with its models. Beyond the reality that many people presented with potentially AI doctored satellite photos won’t think to verify them with Google’s tools, the system is far from perfect.
But soon afterward, the company announced that it was pulling the feature down until it could be deployed in a safer way.
“We know that people uniquely trust Google Earth for a reliable view of the world,” the company added on social. “We’ve seen geospatial professionals using this feature for a range of useful purposes, however we’ve also seen people sharing screenshots of generated imagery that appear to violate our policies. So we’re rolling back this feature in Google Earth while we work on implementing stronger guardrails. It’s important to note that generated images didn’t appear in the main Google Earth experience for others to see and were watermarked as AI generated.”
The risk was clear. Tal Hagin, who runs the AI-powered OSINT platform Golden Owl, fed Van Ess’s photo of the faked Gaza hospital into Google’s Gemini chatbot asking it to look for SynthID, and found that it couldn’t give a definitive answer.
“No reliable signals were detected indicating how the content was created,” Gemini responded, per Hagin’s screenshot. (In our own test, Gemini said it was “unsure if the image was made with Google AI.”)
Whether Google’s systems could catch faked satellite imagery that its own tech is creating, however, is beside the point. The worry is that the AI creations will fool humans, not other AI models. As a potential fabrication gets circulated online, screenshotted, and compressed countless times over, it’ll be harder to use our eyeballs to tell what’s real.
Of course, the means to do this already existed. If a bad actor wanted to, they could’ve manually taken satellite screenshots and fed them into their AI image generator of choice. But Google took those extra steps out and streamlined the whole process, not to mention officially wedding Google Earth with a technology that’s synonymous with distorting our reality and getting the facts wrong.
A widely followed OSINT account fumed at this new dangerous paradigm.
“Unbelievably irresponsible and does immediate, catastrophic damage to the credibility of satellite imagery,” OSINTtechnical wrote.
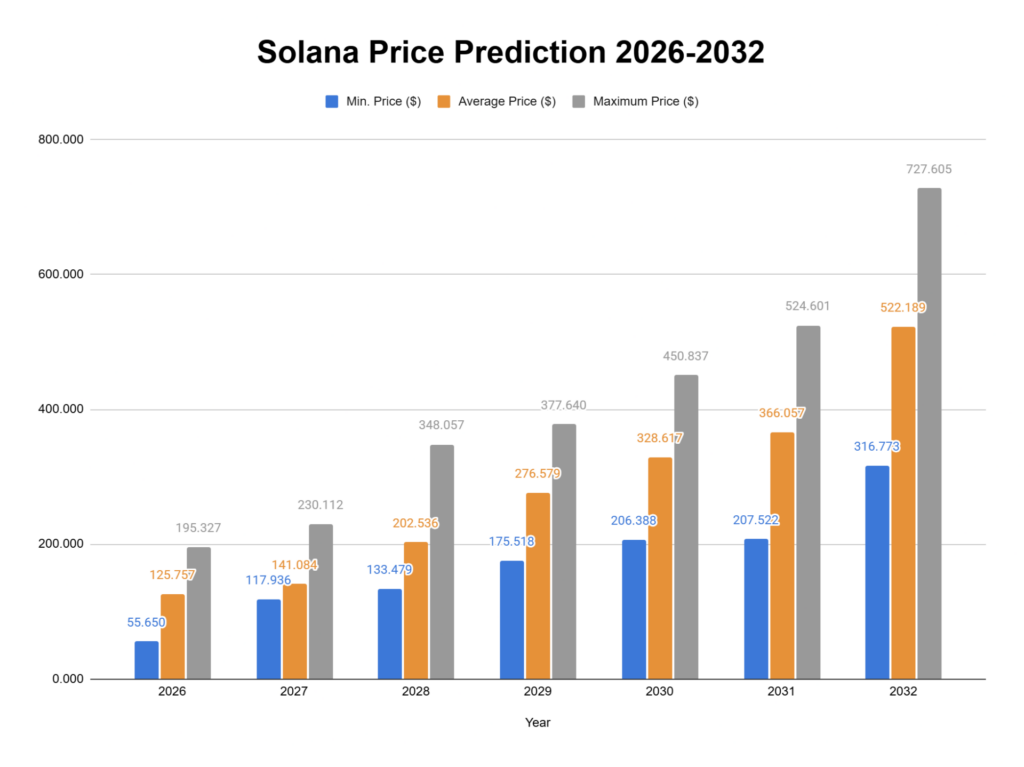
Our predictions show that SOL will achieve a high of $195.327 in 2026.
In 2029, it will range between $175.518 and $377.640, with an average price of $276.579.
By 2032, SOL is expected to trade between $316.773 and $727.605, with an average price of $522.189.
Despite occasional challenges for the Solana network ecosystem, including network congestion and competition from other blockchain platforms, the current sentiment shows that Solana demonstrates resilience and adaptability, despite the current price fluctuations, positioning itself as a leading player in the decentralized finance (DeFi) and Web3 landscape.
Overall, the prevailing sentiment regarding the current Solana price within the Solana community reflects the current sentiment of confidence and excitement among investors, driven by the growing interest in Solana with stakeholders eagerly anticipating the platform’s continued evolution and impact on the broader crypto ecosystem.
While uncertainties persist, Solana’s innovative approach, along with its low transaction fees and robust infrastructure instill optimism for its future price action, as indicated by the technical factors and technical analysis. In this article, we’ll explore Solana price prediction and market dominance, particularly when evaluated against momentum indicators. This brings the question “How high can SOL go in 2026 and beyond?” and we’ll try to answer that.
Overview
Cryptocurrency
Solana
Token
SOL
Price
$73.29(-1.85%)
Market Cap
$42.5 Billion
Trading Volume (24-hour)
$1.65 Billion
Circulating Supply
579.7 Million SOL
All-time High
$294.33 Jan 19, 2025
All-time Low
$0.5052, May 11, 2020
24-hour High
$75.11
24-hour Low
$72.81
Solana price prediction: Technical analysis
Market Sentiment
Bullish
50-Day SMA
$81.38
200-Day SMA
$100.29
Price Prediction
$82 (+5%)
Fear & Greed Index
28 (Fear)
Green Days
15/30 (50%)
14-Day RSI
62.91 (Neutral)
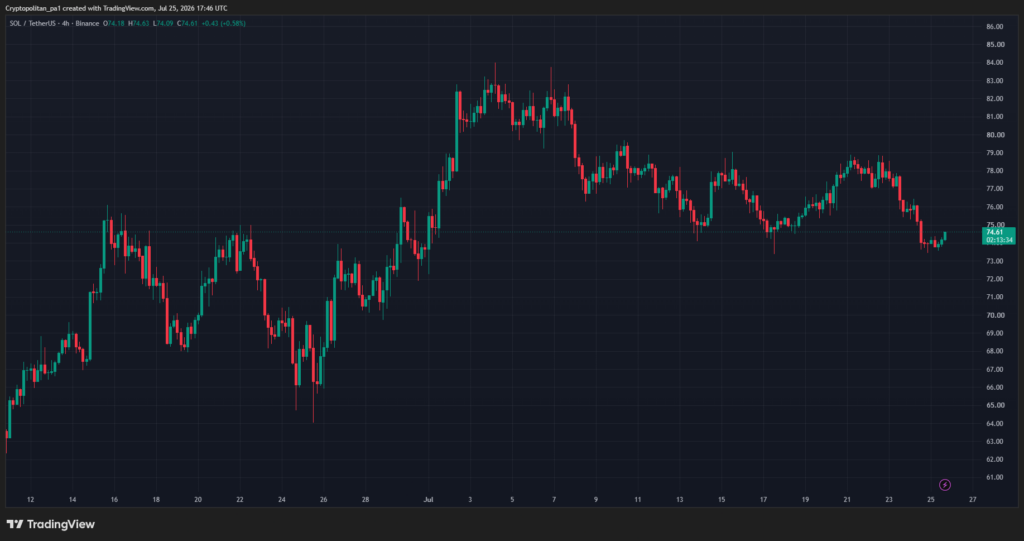
Solana price analysis: SOL falls to $73
TL;DR Breakdown:
Solana price analysis shows bearish pressure as SOL falls to $73
The altcoin lost 1.85% of its value in last 24-hours.
Support for SOL/USD is at $73
Today, on July 31, the Solana price analysis reveals bearish momentum as the price falls to the $73 mark.
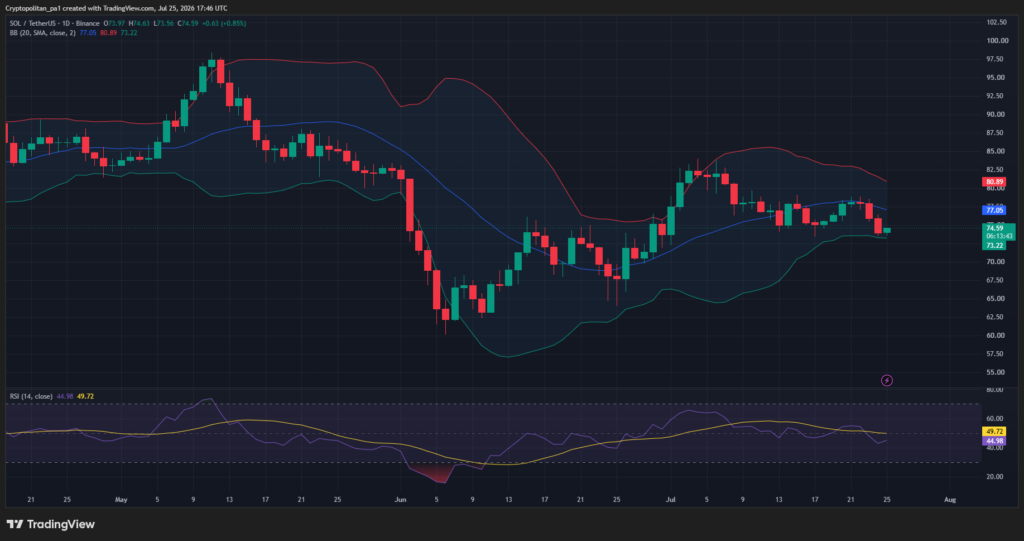
Solana price analysis 1-day chart: SOL falls to $73
The daily price chart shows a slow decline to the $73 mark where SOL finds short term support.
The distance between the Bollinger Bands defines the intensity of volatility. This distance between high and low bands is narrow, leading to increased volatility. Moving ahead, the upper limit of the Bollinger Bands indicator, acting as the resistance band, has shifted to $80.89. The indicator’s mean line, which shows a support level, has shifted to $72.60.
The Relative Strength Index (RSI) indicator is trading in the neutral region. The indicator’s value has increased to 78.80 in the last candle, and its curve suggests bearish market sentiment at the level. If buying activities continue to intensify, further volatility in the market can be expected. However, the short-term indicators suggests a further decline
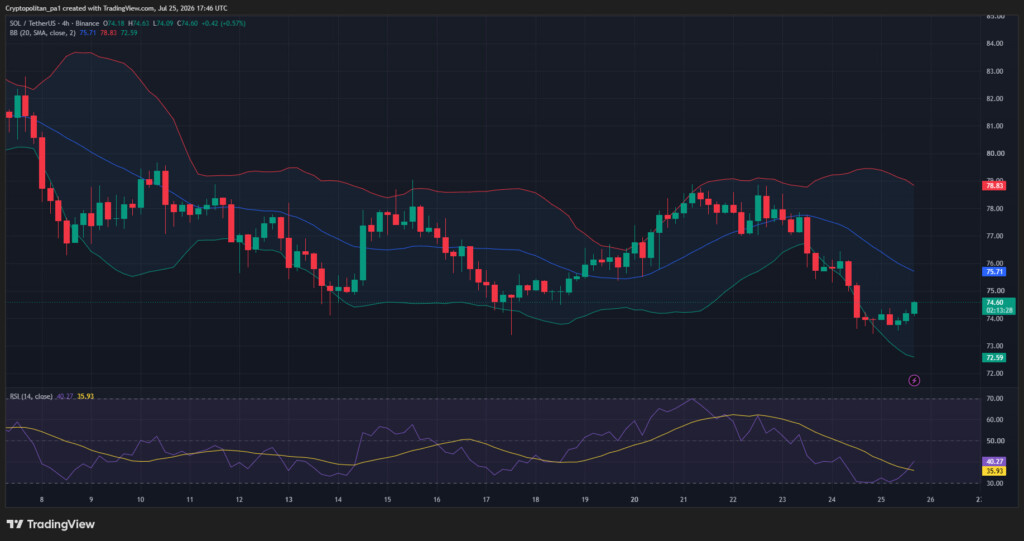
SOL/USD 4-hour price chart
The four-hour price analysis of the Solana shows the price observes bullish momentum in recent hours as price finds support at $73.
The Bollinger Bands are wide and show divergence, hinting at a falling volatility level. This level of volatility signifies decreased market unpredictability. Moving forward, the upper Bollinger Band has shifted to $74.94, securing the resistance point. Conversely, the lower Bollinger Band has moved to $72.71, indicating support.
The RSI indicator is in the overbought region. Currently at 43.91, the RSI’s position is showing bullish sentiment. The level of the index suggests low momentum with room for volatile movement across the short-term. The current slope suggests bullish pressure but we can only expect a rise back to the $79 mark if the bullish momentum is able to hold past $74.
The Solana price analysis suggests a bearish prediction based on ongoing market events for the day. The SOL/USD pair fell to the $73 mark from the highs of $79. SOL then recovered to $73.3 mark where it trades at press time.
Is SOL a good investment?
Solana is a high-performance blockchain platform known for its robust scalability and speed due to various technological advancements, particularly in the crypto space boasting a substantial Total Value Locked (TVL). The network continues to hit key development milestones. Despite a challenging month, price predictions indicate a more positive outlook, suggesting the potential for Solana’s growth and future growth.
Why is SOL down?
Solana failed to establish support at $75 and higher levels and the resulting breakdown caused a decline o $73 where it finds short-term support.
What is Solana going to be worth in 2026?
The Solana (SOL) price prediction for 2026 suggests a minimum value of $83.93 with an average price of $115.48, driven by fundamental factors in the market. The price could reach a maximum of $179.36 during the year.
Will SOL reach $1,000?
The price forecasts indicate that SOL could reach the $1000 mark by mid 2030s, influenced by trends in the broader crypto market. Given the bullish scenario and the projected positive market sentiment and growth trend, SOL might reach $1,000 within the next five years.
Can Solana reach $5,000?
Reaching $5,000 is plausible but would likely take several years beyond the current forecast period. However, a snowball in the asset’s adoption might bring the moment sooner.
Does SOL have a good long-term future?
Yes, Solana has a good long-term future, with a promising market capitalization and exciting potential ROI due to its high scalability, which makes Solana an attractive investment. Its growing adoption, strong developer community, and strategic partnerships further enhance Solana’s forecast of its potential for sustained growth.
Recent news/updates on Solana
Securitize is bringing its own stock onchain on Solana. The stock available on the New York Stock Exchange will be tokenized and available globally to Solana users
BREAKING: Securitize is bringing its own stock onchain on Solana.
The same $SECZ common stock listing on the NYSE. Issuer-sponsored, tokenized, available globally and to eligible US investors on day one. Live only on Solana. pic.twitter.com/4247WrQOo4
The SOL price prediction 2026 for July suggests a range of outcomes based on current market trends, greed index, and analysis. The forecast anticipates SOL to fluctuate between a minimum of $59.32 and an average of $81.99, and potentially attain a maximum of $98.25.
Month
Minimum Price ($)
Average Price ($)
Maximum Price ($)
July
59.32
81.99
98.25
Solana Price Prediction 2026
Solana (SOL) is predicted to reach a minimum of $55.65 in 2026. Experts suggest that future price movements indicate the coin could climb to a maximum of $217.03, with an average price around $139.73.
Year
Min. Price ($)
Average Price ($)
Maximum Price ($)
2026
55.65
139.73
217.03
Solana (SOL) price prediction 2027-2032
Year
Min. Price ($)
Average Price ($)
Maximum Price ($)
2027
117.936
141.084
230.112
2028
133.479
202.536
348.057
2029
175.518
276.579
377.640
2030
206.388
328.617
450.837
2031
207.522
366.057
524.601
2032
316.773
522.189
727.605
Solana Price Prediction 2027
In 2027, Solana’s price is forecast to trade at a minimum of $117.936, reflecting the continued growth of the Solana blockchain. The coin could reach a maximum value of $230.112, with an average trading price of $141.084.
Solana Price Prediction 2028
If bullish momentum continues into 2028, SOL may record a minimum price of $133.479, a maximum of $348.057, and an expected average of $202.536.
Solana Price Prediction 2029
Analysis indicates that Solana could maintain its upward trajectory in 2029, with the price potentially hitting a minimum of $175.518, a maximum of $377.640, and an average of $276.579.
Solana Price Prediction 2030
Based on projections for 2030, Solana may trade at a minimum of $206.388, with an average price of around $328.617 and a possible peak of $450.837.
Solana Price Prediction 2031
Solana’s price is expected to reach a minimum of $207.522 in 2031. Analysts forecast a maximum value of $524.601 and an average trading price of $366.057.
Solana Price Prediction 2032
In 2032, Solana is projected to trade at a minimum of $316.773, with an average price of $522.189, while the maximum price could reach $727.605 if favorable market conditions persist.
Solana price prediction 2027-2032
Solana market price prediction: Analysts’ SOL price forecast
FirmName
2026
2027
Changelly
$167
$248.
DigitalCoinPrice
$132.89
$162.57
Cryptopolitan’s Solana (SOL) price prediction
Our predictions show that SOL will achieve a high of $195.327 in 2026. In 2029, it will range between $175.518 and $377.640, with an average price of $276.579. By 2032, SOL is expected to trade between $316.773 and $727.605, with an average price of $522.189.
However, it is advised to do your own research and conduct expert opinion before investing in the volatile crypto market.
Solana (SOL) historic price sentiment
Solana Price History
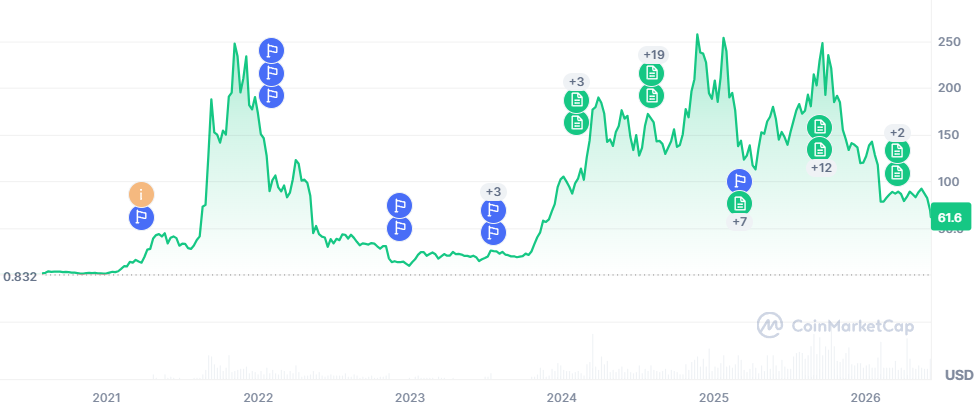
Solana was launched in April 2020 and has gained popularity over the last 18 months. Its price surged from $0.75 to a high of $214.96 in early September.
Following NFT hype and growing demand in the DeFi community, the cryptocurrency Solana (SOL) price more than tripled during the summer of 2021. Solana (SOL) token became the fastest-growing cryptocurrency and is currently ranked fifth with a live market cap of nearly $66 billion.
2022 saw Solana leap to its all-time high of $260, but SOL failed to close the year anywhere near that high, as the price came crashing down to below $40 by June. The bearish markets were marked by high skepticism as trading volumes declined throughout the crypto markets.
The price continued to trade below the $40 level until November 2023, when Solana gained momentum and started a bullish rally again to close the year at $101.84.
In 2024, Solana (SOL) saw significant growth, with its price rising from $83.62 in January to a high of $202.87, fueled by its dominance in DeFi, NFTs, and decentralized exchanges. However, the price fluctuated through the year, retracing to $131 in September after struggling to maintain key levels.
October brought a positive rebound as SOL rose from $152 to close at $167, but early November started bearish, with the price dipping to $160.
However, Solana bounced back sharply and closed the month above the $230 mark. December, on the other hand, has observed a slow start as price volatility remains low.
Solana’s (SOL) price rose significantly in January 2025 from below the $190 level to close the month above $210. However, the latter half of the month saw the price decline from the $230 mark, a trend that continued through February ending the month below $150.
In March the price continued falling as the bears continued dominating the short to mid term markets ending the month below $125. In April the bearish rally has only continued as the price falls towards $100. However, the bulls bounced back in the middle of the month and ended the month around $150.
In May the price continued to rise and ended the month above the $165 price level, a trend that could not extend through June as the month saw a decline falling below the $150 price level to end the month.
July saw a sharp rise to the asset’s volatility with SOL crossing the $200 mark. However, the price could not be maintained and SOL ended the month below the $180 level. In August, on the other hand, SOL made strides and managed to close the month above the $205 mark.
In September, the volatility rose sharply as the price rose to the $250 price level but failed to maintain the level and ended the month at $230. In October, the decline increased sharply as SOL ended the month below $170. In November, and December the decline continued with SOL ending the year at the $125 mark.
In January, the trend continued with Solana crashing towards the $100 mark during the period. In February the decline continued as SOL declined below the $80 mark near the end of the month. In March, the trend continued for the first half but later made some recovery ending the month around the $78 mark.
In April, SOL saw volatility as price spiked to the $90 mark but ended up closing the month around the $83 mark. In May, the price recovered initially but declined again to end the month around the $80 mark.
In June, the trend continued with SOL ending the month around the $73 mark.
CEO of Tau Robotics, Alexander Koch, announced in an X post that the San Francisco startup has begun renting humanoid robots to clean people’s homes.
The service would cost customers $30 an hour, even though the robots aren’t autonomous. Their hardware is made by Unitree, a Chinese manufacturer. However, the Trump administration has recently placed a ban on Chinese robot imports.
A human takes the wheel the whole time
Tau has a public waitlist and operates an invite-only service, with each visit lasting an hour. When a customer requests the service, a staff member drops off the robot at the customer’s home while a trained operator at Tau’s facility drives it. This happens in real time as an AI system manages balance and motor control.
According to Alex Koch, the service is “conceptually similar to autonomous driving,” that is, an individual retains full control of the robot until the technology can be trusted to function alone.
Human oversight is critical to the operations because today’s AI “cannot fully control a humanoid robot on its own,” thus an operator has to run the machine from Tau’s facility.
Some of these operators are employees, while some came through a recruitment agency.
Tau’s lineup of robots and its penchant for privacy
Tau has three machine models: Chelsea, Elon, and Tony. Chelsea takes care of kitchens and bathrooms with non-toxic products, while Elon learns where household items are placed over time, and Tony handles deep cleans. Customers remain home while the robots take out the trash, vacuum, clear clutter, and wipe counters.
Privacy is the trade-off. While microphones stay off, Tau records each session to train its cleaning models. Video footage is stored indefinitely unless a customer requests that it be deleted. Tau’s operators, engineers, and third-party maintain access to the footage.
The startup was founded by Alexander Koch and Cornelia Weinzierl in 2024, but has very little information about its operations published.
Chinese hardware, right after Washington placed a ban
Tau sourced the hardware of the robots from Unitree, while it designed the cameras, claws, and onboard computer in-house.
The Federal Communications Commission (FCC) has banned the importation of humanoid and quadruped robots from China for national security reasons. According to the FCC, such devices “could create supply chain vulnerabilities that could disrupt U.S. economic and national security,”
Unitree has just under 20% of the humanoid market share globally, and the company is looking at a STAR Market listing. However, with the recent ban by the Trump admin, Unitree stands in a vulnerable position as it may struggle to supply its customers, like Tau and Gatsby, a cleaning startup that charges $150 per visit and often uses the Unitree G1.
Not everyone is convinced by Tau yet
Ken Goldberg, who is a UC Berkeley engineering professor with four decades of experience, has his doubts. He considers the roll-out too early as machines may find it hard to pick objects off the floor and wipe the counters.
He views Tau’s marketing ploys as unconvincing, as viewers are unable to tell if the footage is staged. Koch disagrees, as he believes vacuuming and counter-wiping are already doable tasks for the robots.
Tau already has competition, with 1X Technologies launching its NEO home robot for a $499 monthly subscription, and Weave Robotics shipping a laundry-folding machine to a set of customers in California.
Don’t just read crypto news. Understand it. Subscribe to our newsletter. It’s free.