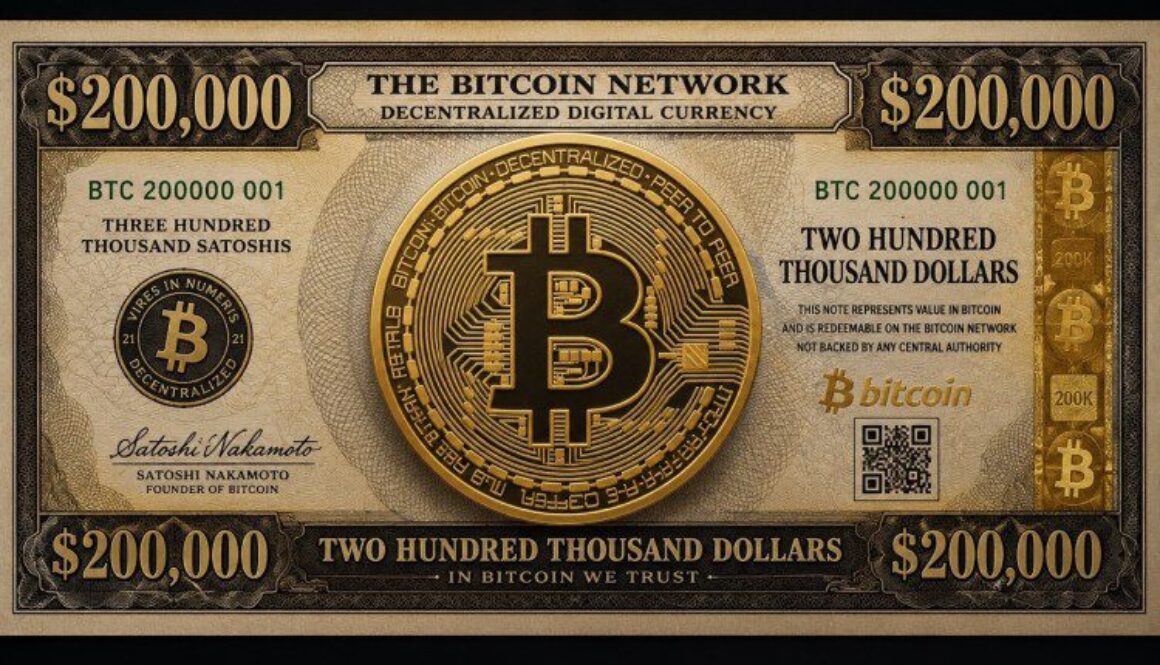
The Bitcoin price could be on track to reach $200,000 within the next one to two years, according to crypto analyst @CryptoTice_. Backed by a long-term cycle chart, the analyst argues that Bitcoin is once again moving through a familiar historical pattern, placing the current phase in what he describes as a key accumulation zone ahead of a potential major rally.
Bitcoin Price Path Points To 2027 Target
The chart maps Bitcoin’s previous market cycles and outlines a potential path toward $200,000. Based on this projection, the target could be reached within 12 to 24 months from June 2026, placing it between mid-2027 and mid-2028, with 2027 appearing as the more probable timeframe.
To support this view, the analyst compares Bitcoin’s current setup with the cycle lows recorded in 2019 and 2022, both marked as “buy zones” that were followed by major rallies. The 2019 bottom preceded a climb to roughly $69,000, while the 2022 low eventually led to a surge toward $126,000.
The analyst believes the latest correction fits the same pattern. After falling from around $126,000, Bitcoin rebounded near the $60,000 region, creating what he identifies as another accumulation zone. From there, the projection points to a recovery that ultimately pushes the Bitcoin price toward $200,000.
The consistency of this structure forms the foundation of the forecast. In each cycle, Bitcoin experiences a sharp correction, spends time consolidating, and then enters a strong expansion phase. Although the percentage gains have become smaller with each cycle, the broader upward trend remains intact.
Why The Crypto Analyst Sees A Rare Opportunity
That historical pattern is also why @CryptoTice_ argues that the current market environment may offer a significant opportunity. According to the analyst, previous cycle bottoms were formed during periods of widespread uncertainty, before sentiment eventually shifted and prices moved higher.
The chart reflects this view by projecting a gain of roughly 230% from the 2026 buy zone to the $200,000 target. While substantial, that increase is far below the explosive returns seen in Bitcoin’s earlier years, reflecting how the asset’s growth has gradually moderated as the market has matured and attracted greater institutional participation.
The forecast comes at a time when investors remain divided over Bitcoin’s next move. Some continue to focus on macroeconomic conditions, interest-rate expectations, and regulatory developments, while others see the recent pullback as another cycle correction that could eventually lead to new highs.
For the crypto analyst, the most important factor is timing. His model suggests that the current phase may represent the final stage of accumulation before the next major advance begins. If Bitcoin continues to follow the structure shown in the chart, the path to $200,000 could unfold over the next 12 to 24 months, making 2027 a year worth watching closely.
The average Sonic price prediction for 2026 is $0.03259.
Holders can anticipate a maximum price of $0.1574 in 2029.
By 2032, Sonic (S) might touch $0.2967
Sonic is a high-performance EVM Layer 1 blockchain built for DeFi applications, offering up to 400,000 TPS and sub-second finality. The network introduced its Fee Monetization (FeeM) program, allowing developers to earn up to 90% of the fees generated by their applications. Sonic also features a native Ethereum bridge called the Sonic Gateway, which includes a Fast-Lane transaction feature and a fail-safe security mechanism. For investors and traders following Sonic price prediction trends, these features are important because they support ecosystem growth, developer activity, and the chain’s long-term demand.
Sonic emerged from Fantom’s rebrand after Michael Kong announced the Sonic mainnet launch in March 2024. Fantom later fully transitioned to Sonic on January 16, 2025, as the project expanded through partnerships with Chainlink, Pyth Network, Alchemy, Dune, and Safe.
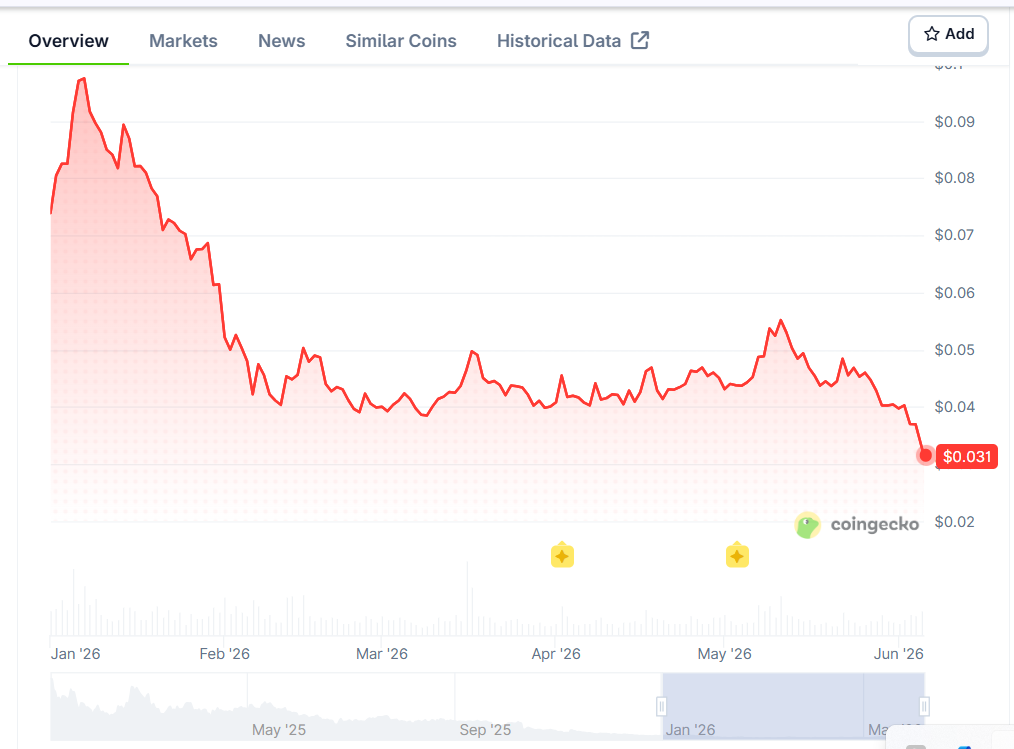
Sonic reached an all-time high of $1.03 in January 2025 before falling to a low of $0.0368 in February 2026. Investors’ questions remain. Will Sonic reclaim Fantom’s all-time high of $3.48? How high can Sonic (S) go in the coming years? Let’s take a look at Sonic’s price prediction and price prediction tool to answer these questions.
Sonic Price Prediction: An Overview
Cryptocurrency
Sonic
Token
S
Price
$0.02906
Market Cap
$83.71M
Trading Volume (24-hour)
$19.27M
Circulating Supply
2.88B S
All-time High
Jan 05, 2025 $1.03
All-time Low
Jun 05, 2026 $0.03036
24-h High
$0.040901
24-h Low
$0.040163
Sonic (S) price prediction: Technical analysis
Volatility
4.09% (Medium)
50-Day SMA
$ 0.04407
Price Prediction
$ 0.02376 (-25.50%)
14-Day RSI
37.59 (Neutral)
Green Days
11/30 (37%)
Sentiment
Bearish
Fear & Greed Index
12 (Extreme Fear)
200-Day SMA
$0.06032
Sonic price analysis S falls to a new all-time low as sellers stay in control
TL;DR Breakdown
Today’s Sonic price analysis shows strong bearish pressure as S falls to a fresh all-time low of $0.02768
Sonic’s current resistance is at $0.0321, while the immediate support remains at the all-time low of $0.0277
Today, Sonic is trading around $0.02924, down 6.32% in the last 24 hours
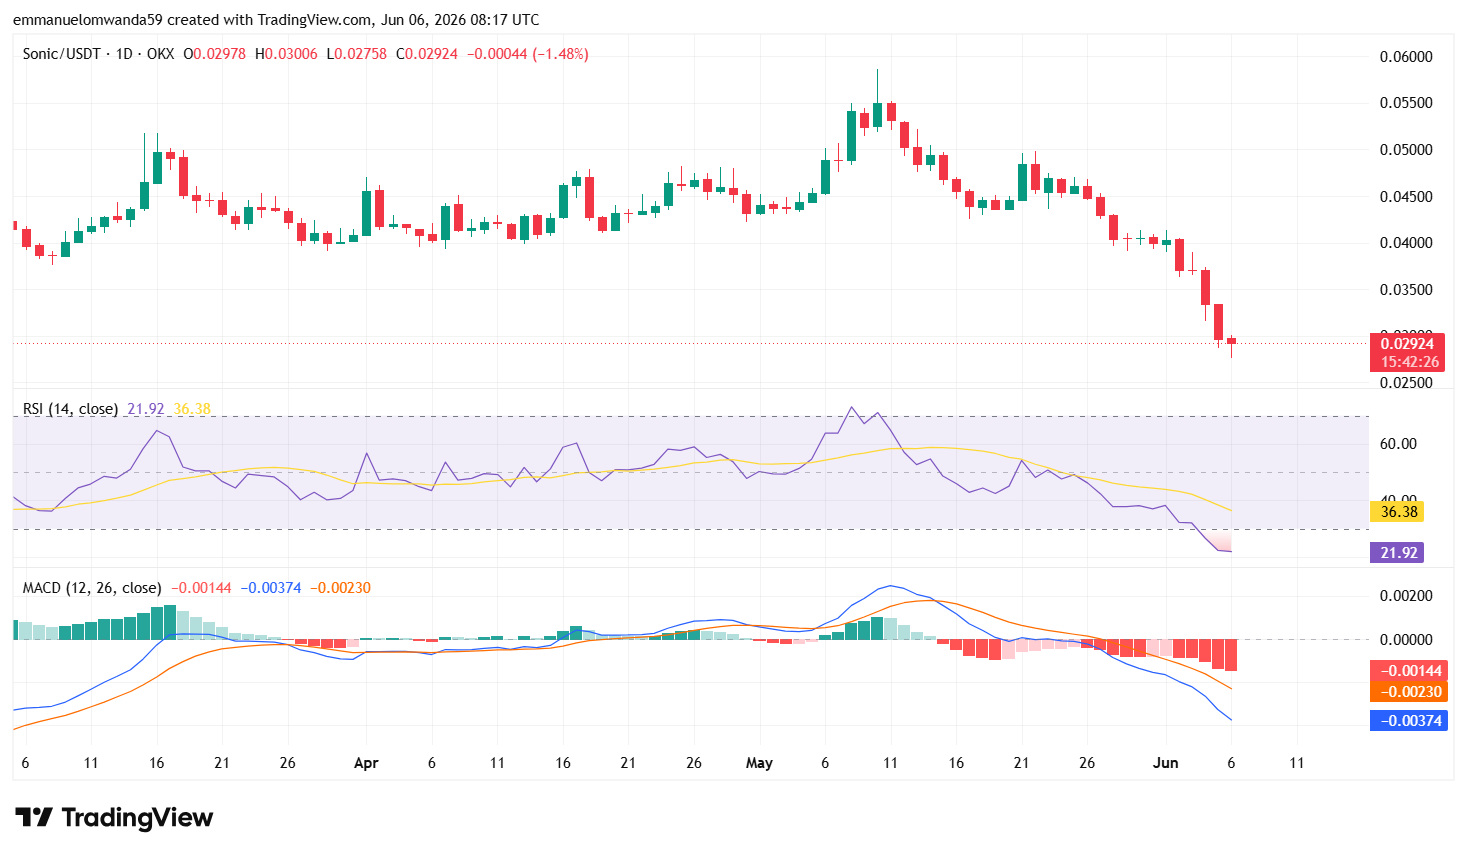
As of June 6, 2026, Sonic’s price analysis shows a bearish market structure. Sonic is currently trading at $0.02928, down 6.32% in the last 24 hours. Selling pressure increased today, driven by Sonic’s new all-time low price of $0.02768, underscoring the continued market dominance by bears. Although buyers managed to trigger a small recovery from the lows, it remains weak as the price continues to trade near historically depressed levels.
Sonic (S) price analysis 1-day chart
Analyzing the one-day chart for Sonic, it shows persistent selling pressure after the token recorded a fresh all-time low.S dropped to $0.02768, breaking below previous support levels and extending its broader downtrend that has been in place for several months.
The latest daily candle remains bearish despite a small recovery from the day’s low. The decline reflects weak market confidence, with sellers continuing to dominate price action. Sonic is now trading more than 97% below its all-time high of $1.03, showing the level of the long downtrend.
Trading activity has weakened over the past 24 hours, with volume falling by 26.14% to $18.93 million. The decline in volume suggests that market participation is cooling despite Sonic’s drop to a new all-time low, indicating limited buying interest at current levels.
S/USD Chart: TradingView
Technical indicators continue to favor sellers. The Relative Strength Index (RSI) has dropped to 21.9, placing Sonic deep in oversold territory. While such levels often precede temporary relief rallies, the indicator is yet to show any meaningful bullish divergence. The continued decline in RSI reflects strong bearish momentum and weak buying interest.
The MACD indicator remains negative as the MACD line trades below the signal line. Expanding red histogram bars suggest that downward momentum is still dominating the market despite today’s rebound from the all-time low. This setup indicates that sellers continue to control the broader trend.
Buyers need to reclaim the $0.0320 area before any meaningful short-term reversal can be considered. Until then, rallies may continue to attract selling pressure.
S’s technical analysis 4-hour chart
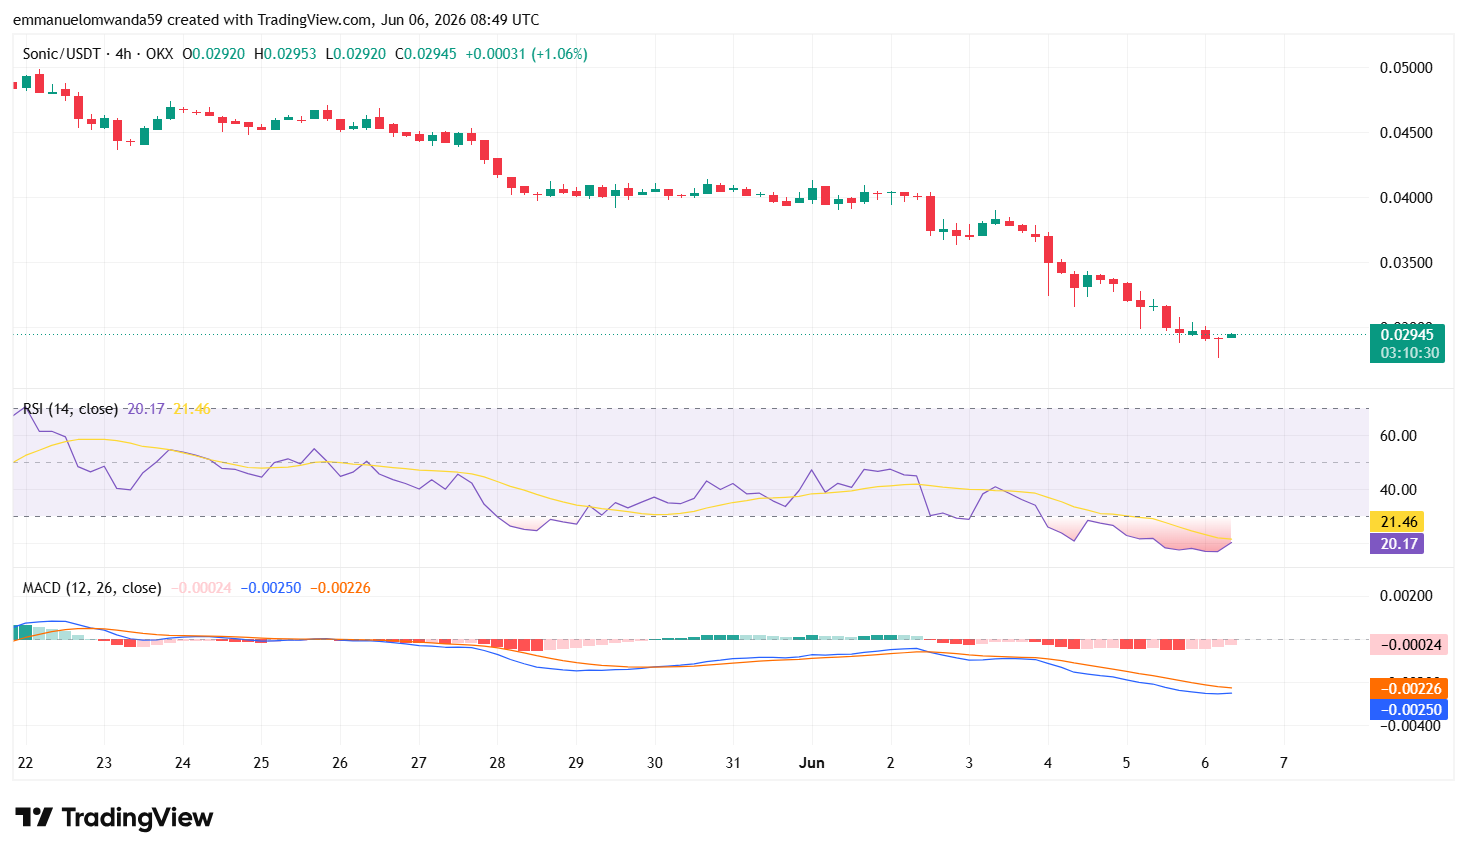
The 4-hour Sonic price chart shows bears still maintaining strong control of the market. Although the token has stabilized around the $0.0294 level, buying momentum remains weak as the broader trend continues to favor sellers.
The RSI on the 4-hour timeframe has dropped to 20.17, still in oversold territory. While this suggests selling pressure has become extreme, the indicator has yet to show a convincing recovery signal. The MACD indicator remains bearish.
S/USD Chart: TradingView
The MACD line continues to trade below the signal line, confirming that downward momentum is still dominant. However, the shrinking red histogram bars suggest that bearish momentum is beginning to slow, although buyers have not yet gained enough strength to reverse the trend.
The nearest resistance is at $0.0300, followed by a stronger barrier around $0.0320. On the downside, immediate support remains at the recently established all-time low of $0.02768. If bears force a break below this level, Sonic could face another low as price discovery continues.
Sonic technical indicators: Levels and action
Daily simple moving average (SMA)
Moving averages are calculated from the average closing price over a set period.
Period
Value
Action
SMA 3
$ 0.03570
SELL
SMA 5
$ 0.03739
SELL
SMA 10
$ 0.03926
SELL
SMA 21
$ 0.04228
SELL
SMA 50
$ 0.04407
SELL
SMA 100
$ 0.04316
SELL
SMA 200
$ 0.06032
SELL
By June 29, 2026, Sonic’s 200-day Simple Moving Average is projected to drop to $0.05181, while the 50-day SMA is estimated to reach $0.03714.
Daily exponential moving average (EMA)
Period
Value
Action
EMA 3
$ 0.03547
SELL
EMA 5
$ 0.03674
SELL
EMA 10
$ 0.03885
SELL
EMA 21
$ 0.04130
SELL
EMA 50
$ 0.04328
SELL
EMA 100
$ 0.04941
SELL
EMA 200
$ 0.08657
SELL
What can you expect from the Sonic price analysis next?
Sonic remains in a corrective trend, but Sonic’s price action is showing early signs of stabilization around the $0.0290 level, and many traders use candlestick charts to assess momentum. Each candlestick shows the opening, closing price, highest, and lowest prices for a chosen interval, helping analysts determine whether support is holding or a rebound may follow.
A successful defense of the $0.02768 support level could allow the token to recover toward $0.0300 and potentially $0.0320 in the coming sessions, according to Sonic key price levels and recent market activity. On the downside, a break below the all-time low of $0.02768 would likely expose Sonic to further weakness, with sellers attempting to establish new lower levels.
In a relatively small market, whales can control short-term moves. Until buyers reclaim the $0.0300–$0.0320 resistance zone, the overall market structure remains bearish despite oversold conditions appearing on technical indicators.
Why is Sonic down today?
Sonic (S) is trading around, down 12.44% over the last seven days, suggesting the broader trend remains bearish despite today’s modest recovery. With no major news catalyst driving recent price action, the decline appears to be due to typical altcoin volatility and profit-taking following earlier gains.
Is Sonic a good investment?
Sonic is a high-speed, scalable blockchain platform that competes with established chains such as Solana and Ethereum L2s, positioning itself as a performance-focused chain within the blockchain ecosystem. Despite its potential, investing in Sonic (S) involves risks typical of cryptocurrencies, including market volatility, so any current forecast should weigh whether it looks like a good buy right now.
While Sonic does not currently lead the market, it maintains a credible and stable position as a reliable, mid-tier chain. Sonic (S) network is also transitioning from a community-driven layer-1 to a more structured corporate model, which investors should factor in before they invest. Own research and assessing personal risk tolerance are essential for anyone considering S as a potential investment opportunity.
Will Sonic reach $5?
The price of Sonic could reach $0.1215 by 2030, with price predictions suggesting a high of $0.1678. The base case scenario for Sonic’s price by 2030 is projected to be around $0.1215, with potential highs depending on market conditions. However, achieving this depends on market conditions, overall technical factors, and fundamental factors.
Will Sonic reach $10?
Based on our technical analysis of multiple technical quantitative indicators, S’s price projections for 2032 estimate a range, with Sonic expected to reach about $0.2967 but not approach double-digit prices within the next 6 years. A move to $10 is not guaranteed; even by 2046, Sonic is expected to reach $0.8797, still far below $10 and requiring over 25,386% upside to hit that mark.
Is Sonic a safe network?
Sonic is regarded as a secure blockchain platform whose architecture differs from traditional blockchains, using its unique Lachesis consensus mechanism to enable high-speed, scalable transactions.
Its directed acyclic graph approach helps deliver theoretical throughput of up to 10,000 transactions per second with finality in less than 500 milliseconds. However, as with any blockchain network, users should exercise caution, use official channels, and follow best security practices to protect their assets.
Does Sonic have a good, long-term future?
Sonic shows potential for a strong long-term future, with price predictions suggesting significant growth by 2030 and beyond. Analysts forecast prices could reach between $0.1215 and lowest prices at $0.1678, driven by its unique blockchain technology, increasing adoption in decentralized applications, and robust ecosystem growth.
Ecosystem growth, fueled by increased developer activity and more developers joining the platform, is crucial for Sonic’s long-term success. Total Value Locked (TVL) in dApps is a critical metric for long-term growth, reflecting real-world usage and platform strength. Sonic also continues airdrop campaigns and support for liquid staking tokens to help boost TVL and revenue generation.
Additionally, the Sonic ecosystem has established a $25 million fund to attract builders and improve user metrics, further supporting future expansion. Future ecosystem expansion may also benefit from plans to pursue a Spot ETF and private investment vehicles on Nasdaq, though the long-term impact remains uncertain. However, market volatility remains a concern.
Recent news/opinion on Sonic (prev. FTM)
Sonic recently expanded its ecosystem focus through infrastructure and security upgrades, including USDC integration support and new stablecoin functionality via Flying Tulip. The developments aim to strengthen Sonic’s position as a developer-friendly EVM chain while improving on-chain utility and security, even as the token continues facing bearish pressure in the broader crypto market.
Sonic recently highlighted the growing adoption of its vertical integration model. The network revealed that its USSD stablecoin is generating approximately $80,000 in annualized real-world asset (RWA) yield without incentives, while Shadow’s AutoVault has already purchased around 350,000 S tokens through market activity.
Vertical integration on Sonic is moving from concept to data.
With zero incentives, $USSD is at ~$80K annualized RWA yield, while @ShadowOnSonic‘s AutoVault has already bought ~350K $S from market activity.
The Sonic price prediction for June 2026 suggests a modest recovery from current levels, with the price expected to range between $0.02881 and $0.03259. The average price is projected to be around $0.03259, as market sentiment, trading volume, and broader crypto market conditions continue to influence short-term price action.
Period
Potential Low ($)
Average Price ($)
Potential High ($)
Sonic (S) price prediction June 2026
$0.02881
$0.03259
$0.03259
Sonic price prediction 2026
In 2026, Sonic (S) is expected to trade between $0.02750 and $0.03789, with an average price of around $0.03270. This suggests relatively stable price action throughout the year, with modest upside potential if ecosystem growth and market sentiment improve.
Period
Potential Low ($)
Average Price ($)
Potential High ($)
Sonic Price Prediction 2026
$0.02750
$0.03270
$0.03789
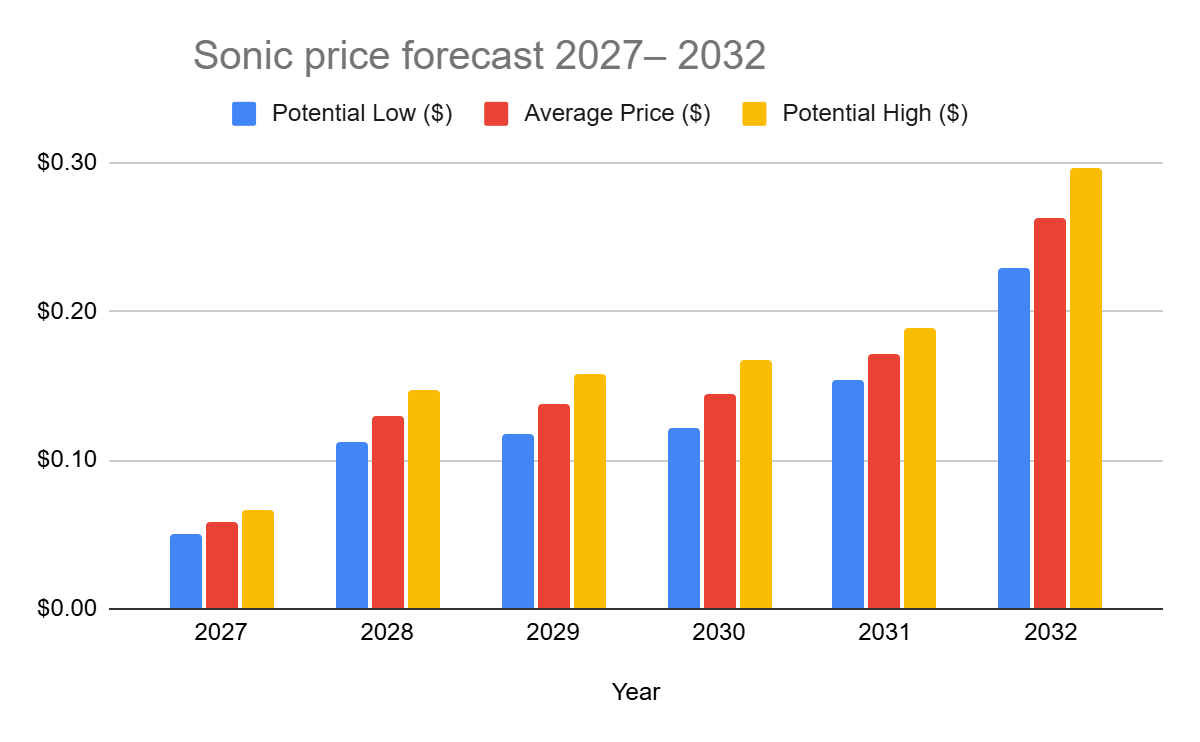
Sonic price forecast 2027– 2032
price prediction chart
Year
Potential Low ($)
Average Price ($)
Potential High ($)
2027
$0.0499
$0.0581
$0.0662
2028
$0.1128
$0.1296
$0.1465
2029
$0.1169
$0.1372
$0.1574
2030
$0.1215
$0.1446
$0.1678
2031
$0.1545
$0.1717
$0.1889
2032
$0.2285
$0.2626
$0.2967
Sonic (S) price prediction 2027
The Sonic forecast for 2027 speculates that the price might reach a maximum of $0.0662 by 2027. On the lower end, corrections may pull the price to $0.0499 with an expected average trading price of around $0.0581. As an alternate modeled scenario, the predicted price for 2027 could be around $0.03998, representing a potential 1.90% increase.
Sonic (S) price prediction 2028
Sonic’s (prev. FTM) 2028 forecast of $0.1128–$0.1465, averaging $0.1296, is linked to growing adoption of its rebranded ecosystem. By then, expanded DeFi, NFT, and gaming use cases are expected to strengthen utility and demand. The projected rise in Sonic’s price by 2028 is supported by its Fee Monetization model and the fee burning mechanism, which incentivize developer activity and reduce token supply. Network scalability upgrades and rising developer engagement support gradual appreciation, while market cycles keep growth within range.
Sonic (S) price prediction 2029
In 2029, Sonic’s market price might stabilize at $0.3238 while attaining an average trading price of around $0.2698, and a minimum price of around $0.2158. The broader outlook points to $0.03250 by the end of 2026, $0.1464 by 2030, and $0.2327 by 2040, based on combined technical and fundamental factors.
Sonic (S) price prediction 2030
Sonic is expected to reach a maximum of $0.1678 by 2030. However, it could fall to $0.1215 with an average price of $0.1446.
Sonic (S) price prediction 2031
Sonic is projected to hit a high of $0.1889 in 2031. In the event of a price correction, it could drop to $0.1545 with an average of $0.1717
Sonic (S) price prediction 2032
Sonic is expected to reach a high of $0.2967 in 2032. The average trading price is expected to be $0.2626, and the minimum price is projected to be $0.2285.
Sonic price prediction 2026-2032
Sonic market price prediction: Analysts’ FTM price forecast
Firm Name
2026
2027
Coincodex
$ 0.02589
$ 0.06573
DigitalCoinPrice
$ 0.03189
$0.0817
It’s important to note that these analyst forecasts may be influenced by broader market rallies and shifts in market sentiment, which can drive Sonic’s price targets higher or lower depending on overall investor optimism or pessimism.
Cryptopolitan’s Sonic (S) price prediction
Our predictions show that the Sonic token could achieve a minimum value of $0.02750 in 2026. The Sonic price may reach a maximum value of $0.03789, with an average trading price of $0.03270 throughout 2026. Investor confidence, along with supply and demand dynamics, plays a key role in Sonic’s price action.
Fundamental events such as hacks and other real-world occurrences can significantly impact price movements. Please note that the content provided on this page is for informational purposes only and does not constitute investment advice. Conduct your own research before making financial decisions
Sonic’s (S) historic price sentiment
Sonic price history
Fantom (FTM) launched in 2018 at $0.0182, hit a low of $0.00229 in 2020, and peaked at $3.24 in 2021 during the DeFi boom.
Following the 2022 bear market, FTM recovered to $0.55 by early 2024 before rebranding to Sonic Labs in August 2024.
The 1:1 FTM-to-Sonic (S) token swap began in December 2024, with Binance completing it by January 2025.
Sonic hit a new ATH of $1.029 in January 2025, but steadily declined to around $0.33 by late August.
By early September 2025, Sonic traded stably between $0.3092 and $0.3126.
Early September, Sonic traded around $0.309–$0.313, showing relative stability compared to its August lows.
Mid-September – Price remained in the ~$0.30–$0.33 band, with minor upward drift toward ~$0.32.
Late September – The token approached $0.26, as reported by markets, showing a decline and increased volatility.
Early October – Trading price dropped further into the ~$0.23–$0.26 range, indicating a weakening trend.
By November 3, Sonic had fallen to approximately $0.122, marking a substantial decline from early September levels.
At the beginning of November 2025, Sonic (S) traded around $0.12–$0.14, occasionally spiking to roughly $0.17 before retreating.
Through mid-November, the price generally drifted downward, reaching a low near $0.10–$0.11 around November 21.
From late November to December 3, S recovered slightly — trading in a narrow band around $0.10–$0.11, suggesting consolidation and stabilization after the mid-month slump.
From early December, Sonic traded around $0.071–$0.075 on Dec 3–Dec 6, then moved higher through mid-December as the price climbed into the $0.085–$0.095 zone by Dec 14–Dec 17, reflecting increasing buying interest late in the year.
Into late December and early January, S stabilized in the $0.07–$0.08 range before rising above $0.08, closing around $0.082–$0.086 by Jan 4 2026, showing a modest recovery into the new year.
On January 4, 2026, Sonic was trading near $0.086–$0.090 after stabilizing from December weakness, with modest rebounds in the first week of January as buyers emerged off key support levels.
By February 3, 2026, Sonic had drifted lower toward roughly $0.065–$0.070, reflecting continued selling pressure and failed rallies, with price consolidating near the low end of its recent range.
Sonic (S) traded around $0.052 to $0.048 between Feb 3 and Feb 10, 2026, before declining toward the $0.041 to $0.039 range by late February amid steady selling pressure.
From early March to Mar 14, 2026, Sonic moved between $0.038 and $0.044 with a gradual rebound attempt as the price stabilized near the $0.040 support zone.
From March 14 to late March, Sonic drifted lower from $0.0514 toward $0.040–$0.042, unable to sustain any meaningful bounces amid broad market weakness.
By April 7, its price pressed critical $0.040 support at $0.0396–$0.0414 — dangerously close to its all-time low of $0.0368 set on February 28.
Sonic is trading at around $0.04951 at the start of May 2026.
By the end of May 2026, Sonic had retreated to around $0.040, erasing much of its early-May gains after a failed rally above $0.055 and stabilizing near a key support zone amid continued selling pressure.
At the start of June 2026, Sonic traded around $0.03136, extending its decline after losing the key $0.040 support level in late May.
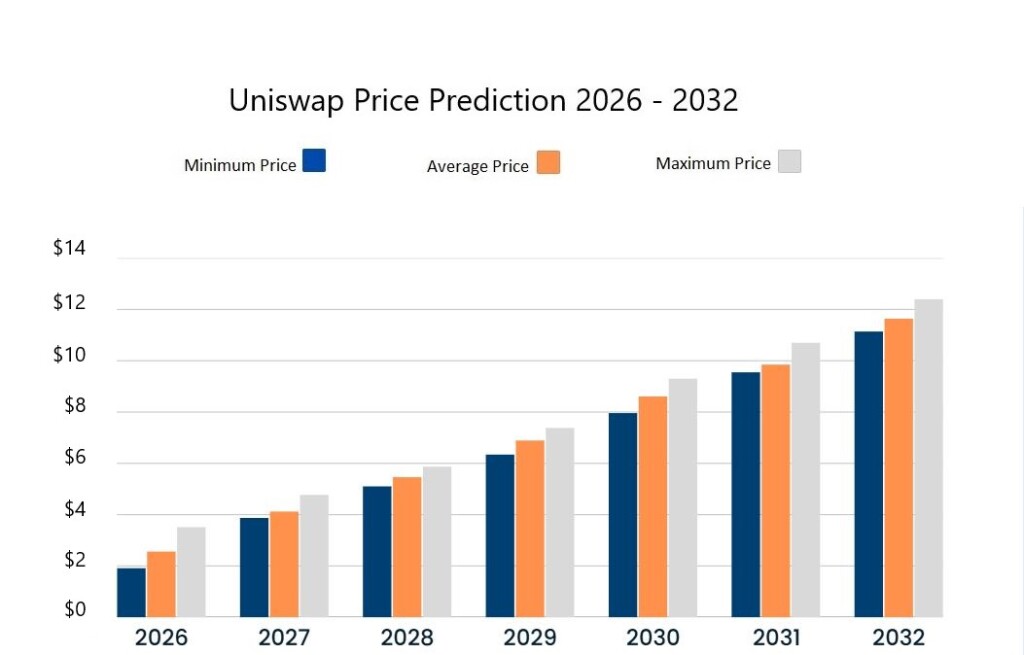
Uniswap (UNI) might reach as high as $3.51 in 2026.
Estimates for Uniswap’s average price in 2028 range from $5.10 to $5.87.
UNI’s average price in 2032 will be $11.64, with a maximum price of $12.4.
Uniswap, a DeFi protocol founded in 2018 by former mechanical engineer Hayden Adams. The Uniswap exchange is a 100% on-chain automated market maker (AMM) protocol on the Ethereum blockchain. The AMM allows DeFi users to swap ether (ETH) for any ERC-20 token without intermediaries, solving many liquidity problems most exchanges face. Uniswap’s unique features and utility make its governance token, UNI, attractive to traders and investors.
Will UNI reach $100? How high can UNI go in five years? Let’s take a look at Uniswap’s technical analysis and price prediction to provide answers to these queries.
Overview
Cryptocurrency
Uniswap
Abbreviation
UNI
Current Price
$2.43 (-0.95%)
Market Cap
$1.51B
Trading Volume (24-hour)
$140.38M
Circulating Supply
622.67M UNI
All-time High
$44.97 May 03, 2021
All-time Low
$1.03 Sep 17, 2020
24-hour High
$2.49
24-hour Low
$2.33
Uniswap price prediction: Technical analysis
Metric
Value
Price Prediction
$2.20 (-7.77%)
Fear & Greed Index
12 (Extreme Fear)
Market Sentiment
Bearish
Volatility
10.61%
Green Days
9/30 (30%)
50-Day SMA
$3.32
200-Day SMA
$4.26
14-Day RSI
21.10
Uniswap price analysis: UNI price plunges toward $2.43
TL;DR Breakdown:
Uniswap price analysis shows a downward trend toward $2.43.
The altcoin market is correcting today and UNI token has remained down 0.95% for the past 24 hours.
UNI coin has support around the $2.28 level.
On June 6, 2026, Uniswap (UNI) price analysis reveals a bearish daily trend. The altcoin’s price decreased to $2.43, reporting an 0.95% loss over the past 24 hours. From a macro perspective, the token is facing overhead selling pressure even around local lows, which aligns with a larger bearish structure. No support from the buyers’ side has been observed yet, but immediate support for UNI is present at $2.28.
Uniswap price analysis on the daily time frame
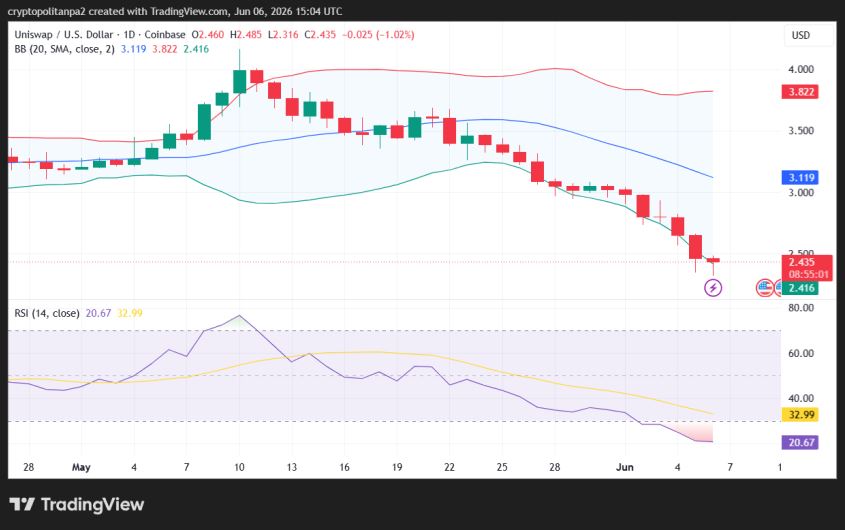
The one-day price chart for Uniswap confirms a downward trend in the market. The UNI/USD pair is hovering near the $2.43 level as the selling pressure resurges. The bearish push has significantly decreased the price, as red candlesticks on the chart signify the intraday selling momentum.
The distance between the Bollinger Bands highlights the intensity of volatility. This distance is considerable, leading to high volatility. Moreover, the upper limit of the Bollinger Bands indicator, indicating resistance, has shifted to $3.82, whereby its lower limit, indicating a broken support, has moved to $2.41.
While many view it as a simple momentum gauge, the RSI acts as a critical price prediction tool when identifying bullish/bearish divergences that precede a trend reversal. The Relative Strength Index (RSI) is trending in the oversold region. The indicator’s value was recorded at 20 today. The downward curve on the RSI signifies a bearish trend, and more instability can be expected if the selling momentum intensifies and the indicator’s score decreases further. However, the indicator can give a buy call any time, as the token is already undervalued.
Uniswap price analysis on the 4-hour chart
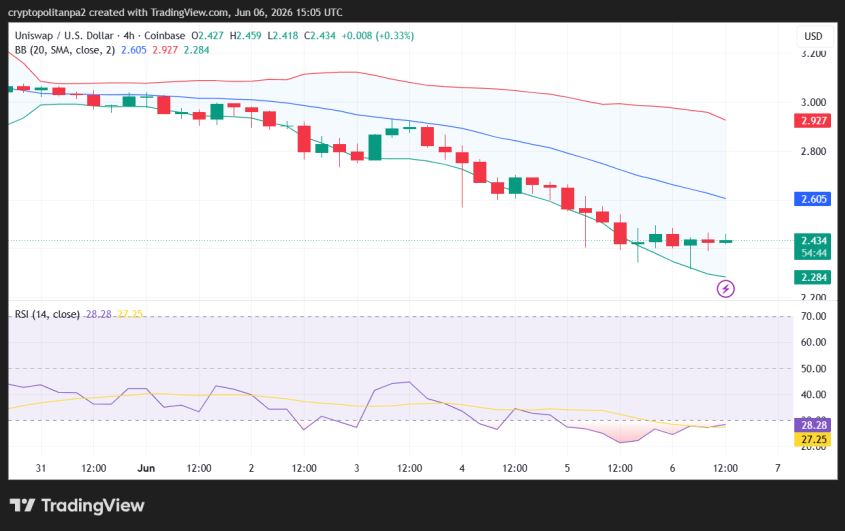
The four-hour technical analysis of Uniswap shows that the price slippage has stopped, and it is now sustaining above the support of $2.28. This is evidenced by its price hovering near $2.43 over the past four hours. UNI may decrease further in the coming hours if traders continue selling more, as the likelihood remains high. Moreover, high volatility signifies a higher chance of a reversal or further price depreciation.
The Bollinger Bands are covering more area, leading to increased volatility levels. This high volatility signals greater market unpredictability. The upper Bollinger Band has shifted to $2.92, indicating the resistance point. Conversely, the lower Bollinger Band has moved to $2.28, establishing the support point.
The Relative Strength Index (RSI) indicator’s value has slightly increased to 28 over the past few hours, with its curve pointing upwards, as the indicator is still trending in the oversold region. This condition suggests an imbalanced trading setup on the four-hour chart. However, further depreciation in the coin’s value is possible only if sellers keep crushing support zones in the next few hours.
Uniswap technical indicators: Levels and action
Daily simple moving average
Period
Value ($)
Action
SMA 3
2.63
SELL
SMA 5
2.73
SELL
SMA 10
2.88
SELL
SMA 21
3.18
SELL
SMA 50
3.32
SELL
SMA 100
3.44
SELL
SMA 200
4.26
SELL
Daily exponential moving average
Period
Value ($)
Action
EMA 3
2.60
SELL
EMA 5
2.69
SELL
EMA 10
2.86
SELL
EMA 21
3.08
SELL
EMA 50
3.27
SELL
EMA 100
3.55
SELL
EMA 200
4.28
SELL
What to expect from Uniswap price analysis next?
Uniswap price analysis suggests a bearish outlook for current market trends. The coin’s price is decreasing in the current session, as the coin shows 0.95% losses over the past 24 hours, following a bearish streak. If sellers maintain their momentum, UNI’s price could decrease toward the $2.3 range.
Is Uniswap a good investment?
Uniswap is a decentralized cryptocurrency exchange (DEX) with massive potential. Unlike traditional exchanges, Uniswap uses an automated market-matching (AMM) system. Uniswap has shown good performance over time and is expected to reach the $4.77 level by 2027 and above $12.4 by 2032.
Why is UNI down?
The broader crypto market is experiencing negative market sentiment today. Most of the top cryptocurrencies are shedding value, and so is the Uniswap token.
How much will Uniswap be worth in 2026?
The maximum UNI can reach in 2026 is $3.51, while the average price is expected to be around $2.56.
Will UNI reach $10?
Uniswap is trading just above the $2 range, down from $18.59, which it achieved in December last year. The current resistance levels are $3.16 and $3.82; a break above them can lead to $11. If UNI gets more support, $10 can be achieved by the year 2031.
Will UNI reach $50?
In May 2021, UNI touched $44.9, its all-time high, which is not much below $50. This possibility can arise again if the broader cryptocurrency market turns bullish on political and economic factors. However, this is not investment advice, and one should seek independent professional consultation before making any investment decision.
Can Uniswap reach $100 dollars?
According to the Uniswap price prediction, UNI is not expected to reach near $100 after 2032. Though this is a five-year time frame, it’s worth waiting, as the coin’s value will increase but may not reach $100.
Does UNI have a good long-term Future?
UNI is the token of the famous Uniswap decentralized exchange. It has a wide user base and good liquidity, so the coin has good prospects. Market analysts expect UNI’s price to reach $12.4 by the end of 2032, substantially higher than its current price.
Recent news/opinions on Uniswap Network
Uniswap Labs announced that an in-app wallet is now live on the Uniswap web app. Users can now sign up for a new account with TouchID, FaceID, or a passkey without any password or seed phrase.
In-App Wallet is now live on Uniswap Web App
Spin up a new account in seconds with FaceID, TouchID, or a passkey
For June 2026, UNI shows an ability to swing wildly; the anticipated minimum value of Uniswap is $2.01. The price may jump to $3.12, but the average trading price of $2.45 is expected throughout the month.
Month
Potential Low ($)
Average Price ($)
Potential High ($)
June 2026
$2.01
$2.45
$3.12
Uniswap price prediction 2026
For 2026, UNI’s price might reach a maximum of $3.51. The minimum price is expected to be $1.91, with the year’s average trading price estimated at around $2.56.
Year
Potential Low ($)
Average Price ($)
Potential High ($)
2026
$1.91
$2.56
$3.51
Uniswap price predictions for 2027-2032
Year
Potential Low
Average Price
Potential High
2027
$3.87
$4.12
$4.77
2028
$5.10
$5.46
$5.87
2029
$6.34
$6.89
$7.38
2030
$7.96
$8.61
$9.30
2031
$9.55
$9.85
$10.70
2032
$11.14
$11.64
$12.4
UNI price prediction 2027
For 2027, Uniswap’s price is projected to have a minimum value of $3.87. The price could soar up to $4.77, with an average of $4.12.
Uniswap (UNI) price prediction 2028
In 2028, the price of UNI is anticipated to hit a minimum of $5.10. The maximum price might reach $5.87, with an average trading value of $5.46.
Uniswap price prediction 2029
The 2029 forecast for Uniswap predicts a minimum price of Uniswap to be $6.34 and a maximum of $7.38, with an average price of $6.89, many folds higher than the current Uniswap price.
Uniswap price forecast 2030
The Uniswap price forecast for 2030 shows that the coin is expected to start at a minimum UNI price of $7.96 and climb to $9.30 while averaging $8.61.
Uniswap (UNI) price prediction 2031
For the 2031 Uniswap coin price prediction, the minimum projected price for Uniswap is $9.55. Traders can expect a maximum price of $10.70 and an average price of $9.85, considering the future price movements.
Uniswap price prediction 2032
For the 2032 Uniswap forecast, it is projected to have a minimum price of $11.14. The price could soar up to $12.4, with an average of $11.64.
UNI market price prediction: Analysts’ UNI price forecast
Firm Name
2026
2027
DigitalCoinPrice
$3.81
$4.23
Coincodex
$1.94
$2.42
Cryptopolitan’s Uniswap price prediction
Our price prediction for Uniswap shows that UNI will reach a high of $3.51 near the end of 2026. In 2027, it will trade between an expected range of $3.87 and $4.77. In 2032, UNI will range between $11.14 and $12.4, with an average price of $11.64. It is important to consider that the predictions are not investment advice. Professional consultation is suggested, or you can carry out your own research.
Uniswap historic price sentiment
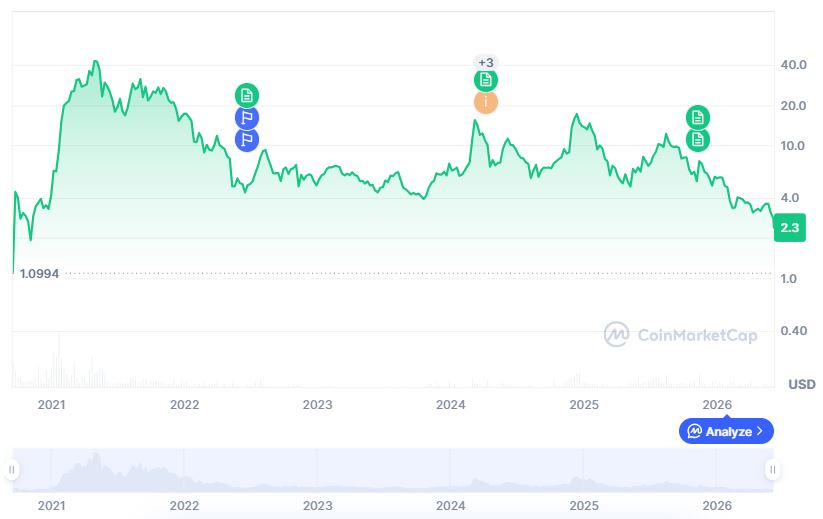
Uniswap price history. Source: Coinmarketcap
Uniswap (UNI) token launched on September 17, 2020, starting at $3.00. It quickly rose to $7.00 before reaching an all-time low of $1.03 (CoinGecko) or $0.4190 (CoinMarketCap) on the same day. UNI ended the year at $5.00 after a gradual recovery during the 2020 bull run.
In 2021, UNI surged 400% in January to $20. By March, it hit $28; on May 3, it reached an all-time high (ATH) of $44.93, skyrocketing its market capitalization. It ended the year near $18 after a significant decline.
Throughout 2022, UNI continued to decline as the cryptocurrency prices kept falling, dropping to around $5.5 by June as the bearish trend persisted.
The crypto market rebounded in 2023, and UNI saw bullish momentum, peaking at $7.77 on December 28.
UNI began 2024 on a downtrend, briefly recovering to $15 by March 6. After mid-May, it faced selling pressure, falling to $0.14 by July 31, as UNI holders kept selling assets.
It stabilized in August at around $5 and traded above $6 at the start of September.
In October, UNI reached a peak of $8, and November saw a peak price of $13.58. In December, UNI soared to $18.60.
In February 2025, Uniswap was trading near $12, which was below January price levels of $15.
In March, it dipped further down, reaching the $7.4 range, and the descent continued into April with a price of $4.7. However, some bullish price action was observed in May, when UNI jumped to $7.5 and finally peaked at $11.74 in July.
August proved a bullish month as UNI/USD reached a yearly high price of $12.31, while it remained in a downtrend in September and October.
UNI traded near the $5.7 mark in early November. After surging toward $10 in mid-November, the price of UNI declined again toward $5.5 in early December.
At the start of January 2026, UNI was trending near the $5.8 level, but in March its price decreased to $3.79.
In April, UNI was trading just above the $3 level, and it was maintaining that level until the end of May, but it decreased to $2.3 in June, as the current market sentiment is bearish.
Our Aptos price prediction anticipates a high of $5.54 by the end of 2026.
In 2028, it will range between $19.33 and $25.91, with an average price of $20.18.
In 2030, it will range between $79.95 and $99.65, with an average price of $82.60.
The Aptos blockchain has aggressively attracted capital into its ecosystem, with its total value locked (TVL) rising above $275 million.
Aptos is a high-performance layer-1 blockchain with a mature ecosystem of decentralized finance (DeFi) applications.
Aptos network continues to build decentralized applications and tools for developers. But how about APT’s performance? How high will it go? Is APT a good investment? Let’s explore these questions in our Cryptopolitan price predictions from 2026 to 2032.
Overview
Cryptocurrency
Aptos
Symbol
APT
Current price
$0.9501
Aptos crypto market cap
$778.84M
Trading volume
$89.9M
Circulating supply
819.72M
All-time high
$19.90 on Jan 30, 2023
All-time low
$0.7926 on Feb 23, 2026
24-hour high
$0.951
24-hour low
$0.8908
Aptos price prediction: Technical analysis
Metric
Value
Volatility (30-day variation)
5.79%
50-day SMA
$0.9699
200-day SMA
$1.37
Current APT sentiment
Bearish
Green days
15/30 (50%)
Fear and Greed Index
23 (Extreme Fear)
Aptos price analysis
At press time, May 29, Aptos had crossed below $1.00, up 0.83% in 24 hours and down 3.36% in 30 days. Its trading volume fell by 15.10% over the last 24 hours to $86 million.
The MACD histograms show APT run this week was driven by little momentum. The move came after APT corrected from its highest this month at $1.239. Its relative strength index (RSI) is in neutral territory (45.69). It is oversold when the value drops below 30.
The chart highlights APT’s run this month. The latest candle formation is suggestive of a bullish continuation. Its momentum, however, remains negative, limiting further gains below $1.00. The $1 mark is the pivot level above which APT could rise to $1.20. A reversal would send it back to the April lows at $0.80.
Aptos technical indicators: Levels and action
Daily simple moving average (SMA)
Period
Value ($)
Action
SMA 3
0.9523
SELL
SMA 5
0.9537
SELL
SMA 10
0.9529
SELL
SMA 21
1.00
SELL
SMA 50
0.9699
SELL
SMA 100
0.9524
SELL
SMA 200
1.37
SELL
Daily exponential moving average (EMA)
Period
Value ($)
Action
EMA 3
0.9475
SELL
EMA 5
0.9512
SELL
EMA 10
0.9591
SELL
EMA 21
0.9734
SELL
EMA 50
0.9808
SELL
EMA 100
1.09
SELL
EMA 200
1.60
SELL
What to expect from the APT price analysis next?
According to the technical indicators, APT is bearish. Over the short term, the charts show APT broke out to the downside, supported by negative market momentum. There is support at $0.09, which, if broken, could send APT to $0.08; otherwise, $1.20 is a likely target if the market reverses.
Why is Aptos down?
There is widespread altcoin weakness, with technical breakdowns detected across several major tokens, including APT, triggering sell signals and momentum loss.
Will Aptos reach $10?
Yes, Aptos will rise above $10 in 2027. The move will come as the market corrects to previous highs.
Will Aptos reach $100?
According to the Cryptopolitan price prediction, Aptos will reach $100 in 2032.
Will Aptos reach $1000?
Per the Cryptopolitan price prediction, it remains unlikely that Aptos will get to $1000 before 2032.
What is the long-term price prediction for Aptos?
According to Cryptopolitan price predictions, Aptos will trade higher in the years to come. However, factors such as market crashes or stringent regulations could invalidate this bullish theory.
How high can Aptos coin go?
Per the Cryptopolitan price prediction, Aptos will reach a high of $146 in 2032.
Recent news
The Aptos community passed a proposal to introduce deflationary tokenomics in a vote that ended on March 1. The change sets a hard cap on the total supply of APT tokens at 2.1 billion, aligning with a broader shift towards performance-driven tokenomics.
Aptos price prediction May 2026
The Aptos price forecast for May ranges from a minimum of $0.82 to a maximum of $1.40. The average price for the month will be $0.94.
Month
Potential low ($)
Potential average ($)
Potential high ($)
May
0.82
0.94
1.40
Aptos price prediction 2026
For 2026, APT’s price will range between $0.85 and $3.54. The average price for the period will be $2.72.
Year
Potential low ($)
Potential average ($)
Potential high ($)
2026
0.85
2.72
3.54
APT price prediction 2027–2032
Year
Potential low ($)
Potential average ($)
Potential high ($)
2027
5.59
11.18
14.84
2028
19.33
20.18
25.91
2029
34.08
35.59
40.67
2030
54.42
56.24
67.14
2031
79.95
82.60
99.65
2032
121.21
125.84
145.97
Aptos price prediction 2027
The Aptos APT price prediction estimates it will range between $5.59 and $14.84, with an average price of $11.18.
Aptos price prediction 2028
Aptos coin price prediction climbs even higher into 2028. According to predictions, APT’s trading price will range from $19.33 to $25.91, with an average price of $20.18.
Aptos price prediction 2029
Our analysis indicates a further acceleration in APT’s price. It will trade between $34.08 and $40.67, with an average price of $35.59.
Aptos price prediction 2030
According to the Aptos forecast for 2030, the APT price will range from $54.42 to $67.14, with an average of $56.24.
APT price prediction 2031
According to the Aptos price prediction for 2031, the price will range between $79.95 and $99.65, with an average of $82.60.
Aptos price prediction 2032
The Aptos price prediction for 2032 is a high of $145.97. It will reach a minimum price of $121.21 and an average price of $125.84.
Our predictions indicate that APT will reach a high of $5.54 by the end of 2026. In 2028, it will range between $19.33 and $25.91, with an average of $20.18. In 2031, it will range between $79.95 and $99.65, with an average price of $82.60. Note that the predictions are not investment advice. Seek independent professional consultation or do your research.
Aptos raised seed funding in January 2022, led by a16z. Series A funding included Apollo, Dragonfly, Franklin Templeton, and others.
Some members previously worked on the Diem blockchain, a project proposed by Facebook.
The Aptos mainnet launched in October 2022 with an initial supply of 1 billion tokens.
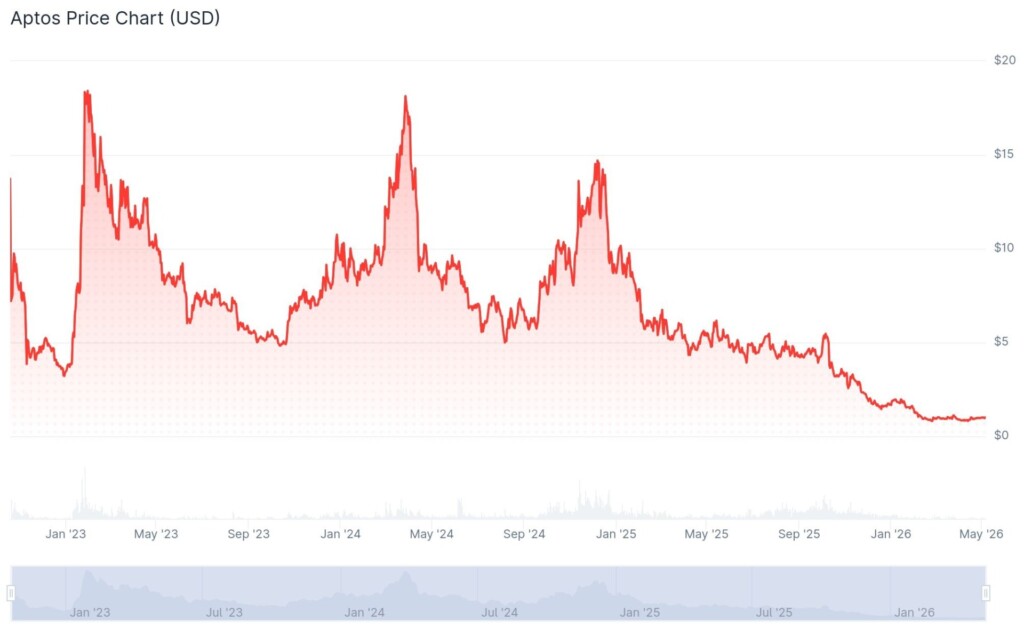
After the launch hype, Apt fell to its lowest in December 2022, at $3.09. A month later, the tables turned, as it peaked at $19.90 on January 30, 2023.
It pumped, partly driven by the NFT market. Collections such as Aptos Monkeys and Aptomingod have attracted more users.
On June 6, it fell below its initial listing price, extending losses from the preceding months.
In October, it began correcting, rising to $8.47 in November.
In 2024, it broke above $10, reaching $18 in March. From April, it reversed, falling below $10. By September, it had fallen to $6. It recovered in October, rising above $7.50. It crossed into November, trading at $8.9, and rose to $13.91. It corrected and traded at $13.24 into December.
It was later corrected and crossed into 2025, trading at $8.71. The drop continued into February, and in May, it fell below $5.10.
In October, it crossed above $5.30, then assumed a bear run, and by November, it had dropped to $3.21. In December, it reached support levels at $1.70. It maintained the levels into January 2026.
Later, it turned bearish, falling below $1 in March and $0.90 in April. In May, it rose back above $1.00.
Hyperliquid (HYPE) recently broke into the top 10 cryptocurrencies by market capitalization, sitting alongside top players like Bitcoin (BTC) and Ethereum (ETH), after its price surged past $50 and set a new all-time high. Now, on-chain analytics platforms are showing what HYPE’s ultimate price could become if it surpasses Ethereum’s market cap.
Hyperliquid’s ATH Price If It Surpasses Ethereum’s Market Cap
Hyperliquid skyrocketed past $50 a few days ago, surpassing Dogecoin’s ranking to take the 9th spot as one of the largest cryptocurrencies in terms of market capitalization. The move marks the first time the token has traded above this zone since late October 2025.
Currently, HYPE has extended its rally well beyond $60. The breakout reflects a strong shift in trading activity around the token, as well as renewed interest and confidence in DeFi protocols and AI-backed tokens. HYPE’s move back into this historic price range also suggests that traders and investors are once again engaging more actively with Hyperliquid’s perpetual futures DEX.
Interestingly, the recent rally in the HYPE price has brought renewed focus on Ethereum, one of Hyperliquid’s biggest crypto and DeFi rivals. While Ethereum remains a dominant benchmark for decentralized applications, Hyperliquid is designed specifically for financial trading and derivatives.
Nevertheless, data from Marketcapof has revealed how high HYPE’s price could reach if its market capitalization of $15.99 billion surpasses Ethereum’s, which is around $250.99 billion. Projections indicate the token could move well beyond its previous all-time high, potentially reaching approximately $1,127, marking a 17.92x from present levels.
At more extreme ATH levels, where market euphoria is likely at its peak, estimates place HYPE as high as $2,633. This would represent a gain of about 42x from current prices, underscoring the scale of the cryptocurrency’s potential upside.
Competition Intensifies As HYPE Captures More ETF Inflows Than ETH
Before recording an ATH, Hyperliquid has been strengthening its market position as capital continues to rotate away from major legacy assets like Bitcoin and Ethereum toward newer, high-growth protocols. HYPE’s recent performance reflects both rising adoption of its DEX platform and a broader shift in liquidity across the crypto sector.
A key driver behind the bullish momentum was the launch of spot HYPE ETFs by investment management firms Bitwise and 21Shares in May. The products have attracted millions of dollars in inflows, underscoring steady institutional demand for HYPE amid heightened derivatives activity.
Earlier in the year, market volatility linked to the US-Iran war triggered record perpetual futures volume on Hyperliquid, pushing activity on the platform to new highs. Liquidity conditions also improved after Coinbase, the world’s largest crypto exchange, became the official USDC provider on Hyperliquid.
Against this backdrop, Ethereum dominance is waning significantly. The cryptocurrency’s price has struggled to maintain momentum, falling roughly 30% year-to-date. ETF flow data reflects this shift, with about $1 billion exiting Bitcoin and Ethereum products while XRP and HYPE funds recorded about $94 million in combined inflows.
XRP could climb as high as $20 if a breakout pattern from 2018 repeats itself, according to pseudonymous Korean financial analyst Ninedex.
That scenario, while not his main call, hinges on the token breaking out of the upper edge of a channel structure that has shaped its price movement for over a decade.
The Long Road From $1.34
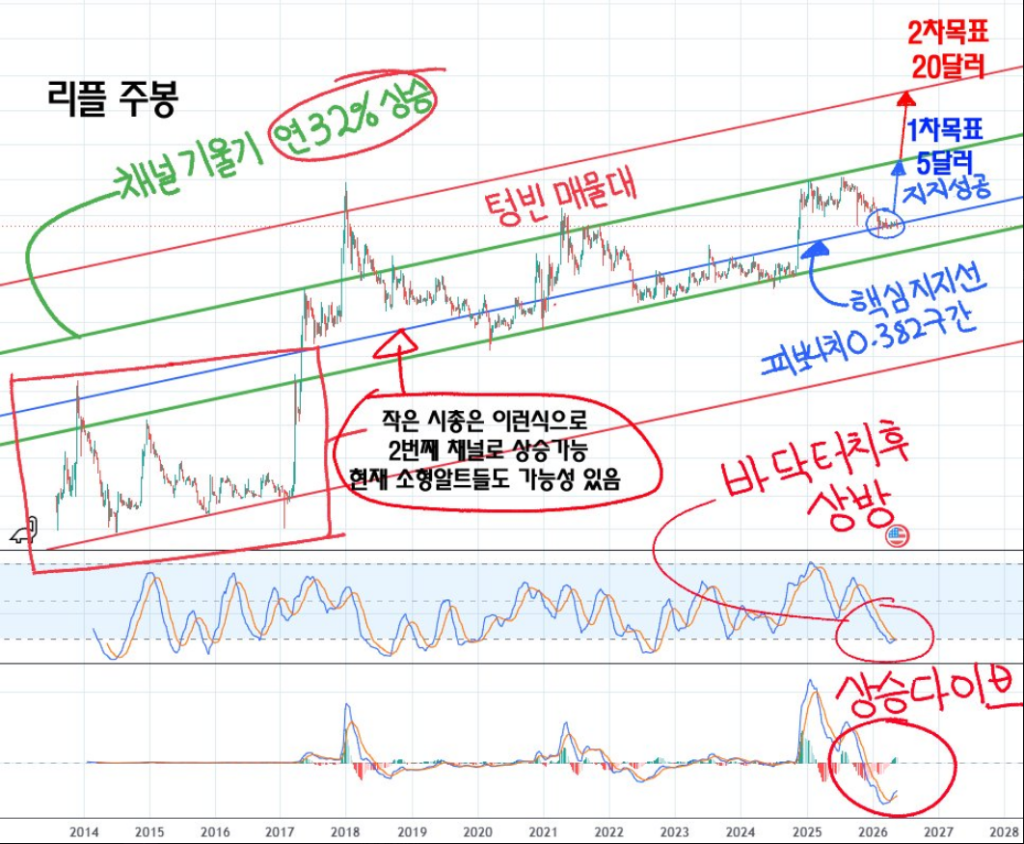
XRP is currently trading around $1.34, down nearly 13% from its May 14 high of $1.54. Despite the pullback, Ninedex argues the token is still holding a key support zone within what he describes as a multi-year ascending channel — one that has guided XRP since it began trading in 2013.
Based on his analysis, that support sits just above the lower boundary of the channel’s middle layer and aligns with the Fibonacci 0.382 level, which corresponds to the $1.40 price area.
The zone was built over an extended period between 2022 and 2024, which is why he considers it one of the strongest long-term support levels in XRP’s history.
XRP spent its early years in the lower section of that channel before a broad crypto rally in early 2017 pushed it into the middle range. It briefly entered the upper channel in January 2018 when prices surged above $3, but a sharp correction followed and pulled it back into the middle layer.
Ninedex says the token has stayed there for the past eight years, and its ability to hold that zone is what keeps it among the major assets in the market rather than slipping back to minor status.
26.05.25 리플 코인 분석.
리플 주봉을 분석해보겠습니다.
리플의 경우 철저히 자본팽창을 추종하며,
연성장 32%의 기울기를 가지고 있으며,
14년~16년이후 소형알트에서 메이저 알트가 되며,
채널이 한 계단 상승하였습니다.
(옥석이 가려진 몇몇 소형 알트들의 미래라고 생각함.)
The transition from a small altcoin to a top-tier asset happened precisely because XRP moved up a layer in the channel during that 2017 cycle, he argues.
Technicals Back The Bullish Read
Ninedex pointed to two technical signals that support his outlook. The weekly stochastic indicator has bounced from 15 points to 20 points — a level he says has historically marked one of XRP’s rare oversold conditions.
The MACD, meanwhile, has formed a golden cross on its EMA lines, with the oscillator moving back into positive territory, which he reads as a sign that market momentum is turning upward.
His primary target is $5, reachable if XRP climbs toward the upper boundary of the middle channel. But he also noted that XRP’s history of sharp rallies and its large community base could push prices well beyond typical expectations — and if it breaks into the upper channel again, $20 becomes the figure he has in mind.
Featured image from Unsplash, chart from TradingView
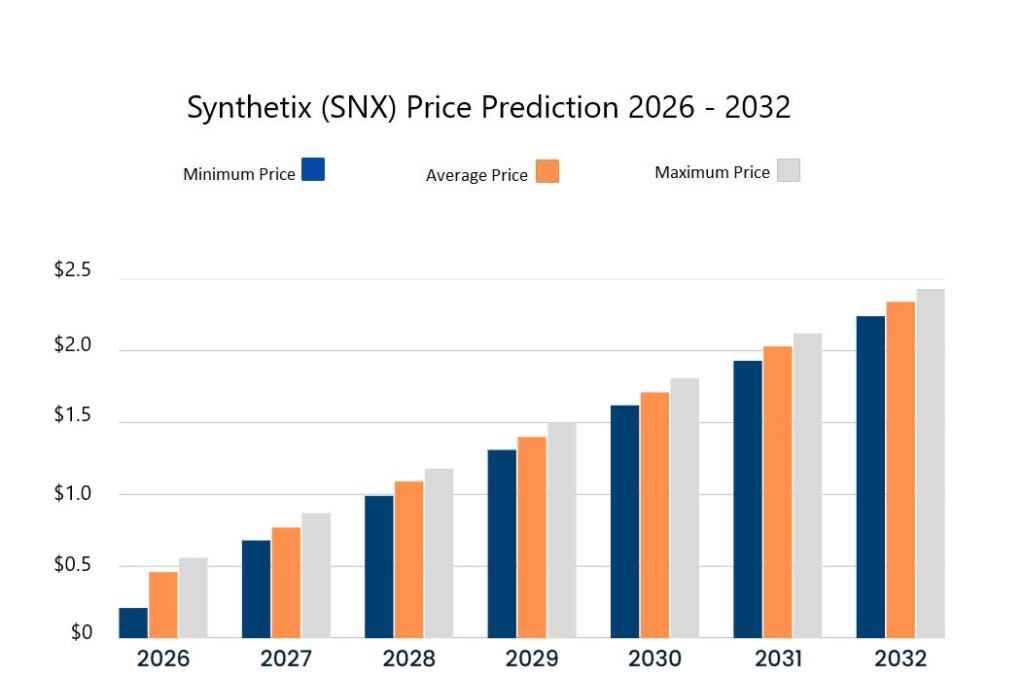
The average SNX price prediction for 2026 is $0.560931.
In 2028, it will range between $0.99721 and $1.18, with an average price of $1.09.
In 2032, it will range between $2.24 and $2.43, with an average price of $2.34.
SNX is the native token for the Synthetix Network and is used for governance. It is listed on top exchanges like Binance, Uniswap, Coinbase, OKX, and Bybit. Synthetic is a decentralized protocol that allows you to create and transact synthetic tokens on the Ethereum blockchain.
Is SNX a good investment? Will it go up? Where will it be in five years? Let’s get into the SNX price prediction and technical analysis.
Overview
Cryptocurrency
Synthetix
Abbreviation
SNX
Current Price
$0.322 (+6.68%)
Market Cap
$110.61M
Trading Volume (24-hour)
$7.58M
Circulating Supply
344.51M SNX
All-time High
$28.77 (Feb 14, 2021)
All-time Low
$0.03258 (Jan 5, 2019)
24-hour High
$0.3252
24-hour Low
$0.295
SNX price prediction: Technical analysis
Metric
Value
Price Prediction
$0.2820 (-8.41%)
Fear & Greed Index
30 (Fear)
Market Sentiment
Neutral
Volatility
5.30% (High)
Green Days
12/30 (40%)
50-Day SMA
$0.3115
200-Day SMA
$0.4025
14-Day RSI
42.28 (Neutral)
Synthetix price analysis
TL;DR Breakdown:
Synthetix coin price analysis confirmed a solid bullish trend, with the price set at $0.322.
The altcoin gained a significant 6.68% in the last 24 hours.
SNX coin faces resistance around $0.329.
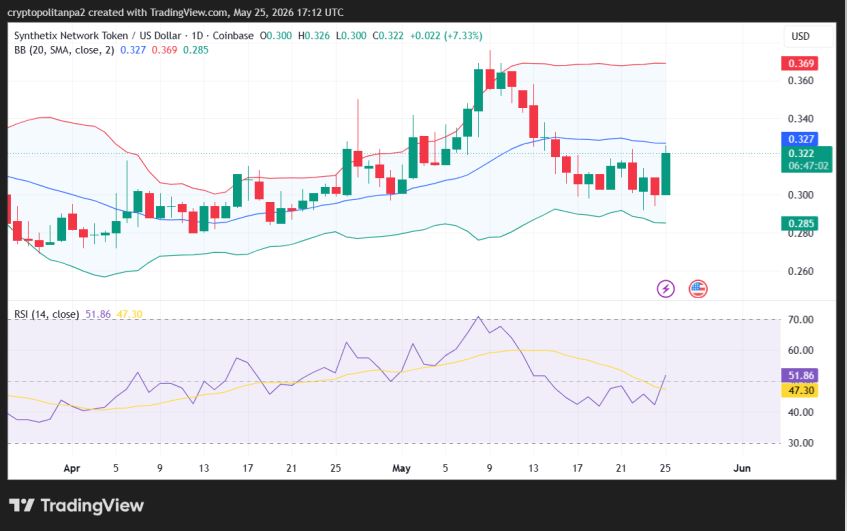
On May 25, 2026, Synthetix price analysis reveals an upward trend with a solid bullish recovery, as the altcoin’s price climbs back to $0.322 over the day. Overall, the cryptocurrency gained a significant 6.68% in value in the last 24 hours, rebounding sharply from yesterday’s steep correction. However, resistance is also present at $0.329, which may slow down the current bullish trend.
SNX/USD 1-day chart analysis
The one-day chart for Synthetix (SNX) reflects a bullish trend following recent corrections; however, the market has yet to shift into a fully buyer/seller-dominated phase. The token has registered significant gains of 6.68% for the last 24 hours, as it has increased to $0.322 today. A new green candlestick on the price chart highlights the presence of bullish dominance.
The distance between the Bollinger Bands defines the intensity of volatility. This distance is wide, leading to high volatility at the moment. Currently, the upper limit of the Bollinger Bands indicator, indicating resistance, sits at $0.369. Meanwhile, its lower limit, serving as support, has moved to $0.285.
The Relative Strength Index (RSI) indicator curve is trending in the neutral area, currently at 51. This situation suggests that buyers are currently controlling the momentum, and bullish pressure might increase if they continue to lead as the coin gains value.
SNX/USD 4-hour chart analysis
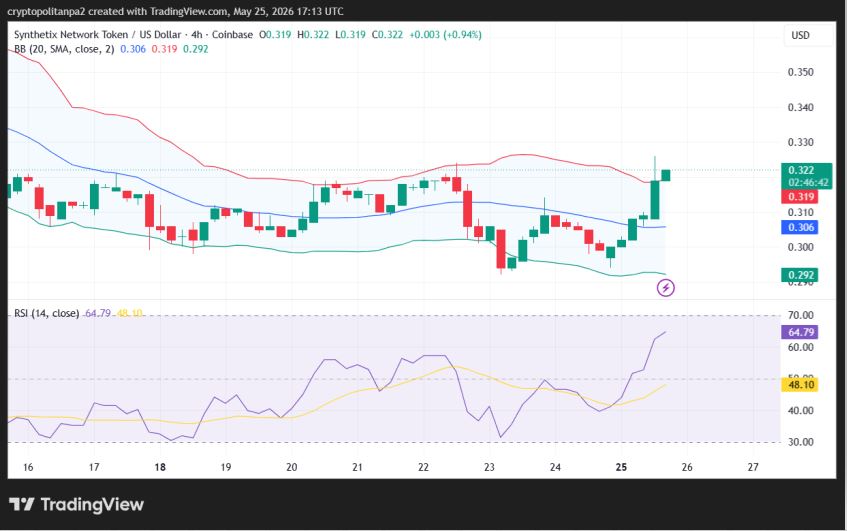
The four-hour price analysis of Synthetix Coin also signals buying interest for the coin at the current price level. The SNX/USD price significantly increased to $0.322 after going through a recovery in the last four hours. The volatility levels are increasing on the 4-hour chart, suggesting a high probability of an upcoming reversal or further price appreciation.
The upper Bollinger Band has shifted to $0.319, indicating a broken resistance level. The lower Bollinger Band has moved to $0.292, showing the support level. Overall, the indicator suggests that the bulls have taken the price above the upper limit of the indicator.
The RSI indicator is in the neutral region. Its value increased to 64 over the past four hours. The upward curve on the RSI graph reflects a positive market sentiment. The bulls have been dominating the price chart for the past few hours, and this trend has also resulted in a relatively balanced trading setup for intraday traders for the time being.
SNX technical indicators: Levels and action
Daily simple moving averages
Period
Value ($)
Action
SMA 3
0.3038
BUY
SMA 5
0.3086
BUY
SMA 10
0.3097
BUY
SMA 21
0.3268
SELL
SMA 50
0.3115
BUY
SMA 100
0.3137
BUY
SMA 200
0.4025
SELL
Daily exponential moving averages
Period
Value ($)
Action
EMA 3
0.3044
BUY
EMA 5
0.3067
BUY
EMA 10
0.3120
BUY
EMA 21
0.3170
BUY
EMA 50
0.3166
BUY
EMA 100
0.3394
SELL
EMA 200
0.4166
SELL
What can we expect from the SNX price analysis next?
Synthetix Coin price analysis shows a bullish trend regarding current market events. The coin’s price has been trending near $0.322 for the last 24 hours. If the buying momentum continues, the SNX price might retest resistance at the $0.347 level. Conversely, if selling pressure overwhelms, the altcoin may again plunge to the $0.292 level.
Is SNX a good investment?
The Synthetix rebranding in 2018 rejuvenated the ecosystem, which has grown continually with multiple listed synths. Despite concerns over the stability of its stablecoins, SNX, the native token, is set to mark new records, as seen in Cryptopolitan’s SNX price predictions from 2026 to 2032. It is expected that SNX will reach $1.81 by 2030.
Why is SNX up?
The cryptocurrency market is getting positive sentiment today, and SNX is following suit. From a larger perspective, the token is slowly recovering as the SNX price is trading at $0.322, and it has seen an appreciation of 6.68% of its total value in the last 24 hours, and the gains are on the higher side.
What is the target price for SNX?
The target price for SNX is $0.560931 for the current year, which is still quite higher than the current Synthetix price.
Will SNX reach $5?
The current price action does not justify predicting a $5 target. However, in the cryptocurrency market, things change rapidly, and if the token maintains its price levels, a recovery can be initiated. It can be expected that SNX will reach a maximum of $2.43 by 2032. However, this is not investment advice, and anyone willing to purchase SNX tokens should seek independent professional consultation.
Will SNX reach $1?
Considering the future price movements, SNX will reach the $1 level by 2028. The last time SNX was seen at the $1 level was in November 2025.
Will SNX reach $10?
According to crypto analysts’ price predictions, SNX may not reach this level in the next five years. Considering the current market cap of the token, it seems like a distant target.
Will SNX reach $100?
No, market analysts don’t expect SNX to reach $100 during the next 10 years, considering the long term Synthetix price forecast.
How high can SNX go?
The highest expected price for SNX is $2.14, which it will achieve in 2032.
Does SNX have a future?
SNX is trading significantly lower than its mid-December price levels, making it an ideal time for buyers to enter the market. Given its current low price and a favorable future valuation of $2.43 by the end of 2032, the asset appears to be a worthwhile investment. However, one’s own research is advised.
Recent news/ updates on SNX
Synthetix introduced the new Synthetix Markets page. The option will show live stats for market sentiment, open interest, 24h volume, funding rate, token dominance, and implied volatility + alt dominance.
Introducing the new & improved Synthetix Markets page ⚔️
This month, SNX is expected to reach a high of $0.430, with an average price of $0.310 and a minimum trading price of $0.243.
Month
Potential Low ($)
Potential Average ($)
Potential High ($)
May
$0.243
$0.310
$0.430
SNX price prediction 2026
The price of SNX is predicted to reach a minimum value of $0.211 by Q4 of 2026. Traders can anticipate a maximum value of $0.560931 and an average trading price of $0.467442.
Year
Potential Low ($)
Potential Average ($)
Potential High ($)
2026
$0.211
$0.467442
$0.560931
SNX price predictions 2027 – 2032
Year
Potential Low ($)
Potential Average ($)
Potential High ($)
2027
0.685582
0.77907
0.872559
2028
0.99721
1.09
1.18
2029
1.31
1.40
1.50
2030
1.62
1.71
1.81
2031
1.93
2.03
2.12
2032
2.24
2.34
2.43
Synthetix price prediction 2027
The year 2027 will experience more bullish momentum. According to the SNX price prediction, it will range between $0.685582 and $0.872559, with an average trading price of $0.77907.
Synthetix price prediction 2028
The Synthetix Network token prediction climbs even higher into 2028. According to the projections, the price of SNX will range between $0.99721 and $1.18, with an average of $1.09.
Synthetix price prediction 2029
According to our Synthetix Network token price prediction for 2029, we expect a maximum price of Synthetix to be $1.50, a minimum price of $1.31, and an average price of $1.40.
Synthetix price prediction 2030
According to the Synthetix price prediction for 2030, the price of SNX will range from $1.62 to $1.81, with an average price of $1.71.
Synthetix price prediction 2031
The Synthetix Network token price prediction for 2031 indicates the price will range between $1.93 and $2.12. The average Synthetix price forecast is $2.03.
SNX price prediction 2032
The Synthetix forecast for 2032 is a high of $2.43. According to the SNX coin price prediction, it will reach a minimum price of $2.24 and average at $2.34.
Our analysis shows that SNX has been highly volatile since its historical listing price. It remains unpredictable at current levels, with predictions indicating it will break out higher. SNX will achieve a high of $0.560931 by the end of 2026. SNX is expected to trade between $0.685582 and $0.872559 in 2027. In 2032, SNX will be priced between $2.24 and $2.43 with an average price of $2.34.
Synthetix historic price sentiment
SNX price history | Coinmarketcap
Kain Warwick launched Synthetix in September 2017 under Havven (HAV).
The HAV Airdrop Campaign ran between 4 and 14 February 2018 and offered two million tokens for around $1 million.
On November 30, 2018, Synthetic announced its rebranding from Havven. This included renaming its native token, HAV (Havven token), to SNX. The contract address did not change.
It registered its lowest price at $0.03258 on January 5, 2019.
Unlike most mega-altcoins, SNX did not rally after launch; it consistently traded below $0.5 until the last quarter of 2019.
In 2020, it made a mega rally to $7.3, as per historical SNX market data. In the 2021 bull cycle, it shot higher, and on February 14, it registered its all-time high at $28.77.
It reversed to $5 in July before pumping again to $15 in September.
In the 2022 crypto winter, SNX shed most of its value as it retreated to the $2 mark by the end of the year.
In 2023, it consistently traded between $1.5 and $3 until the last quarter, when it had its break.
In March 2024, SNX reached a high of $5; in July, SNX came down from the $2.01 to $1.65 range.
In August 2024, the SNX token’s price dipped as low as $1.20, and September saw a maximum price of $1.71.
In October 2024, SNX dipped and became rangebound. It closed the month with a $1.31 price tag, while December saw a stream of improved prices with a peak price of $3.38.
During the remainder of December, SNX kept shedding its value, and it entered 2025 with a wave of correction to $1.90.
The highest price of the SNX token was 2.27 in January, but it corrected to $1.20 in February.
In March, SNX price declined to $0.89, and in April it further descended to the $0.77 range.
In May 2025, it saw some recovery to $0.926, improving its market capitalization, and in July, the token peaked at $0.781, showing significant growth.
From August to September, SNX’s average price remained around $0.65 to $0.67, and in October 2025, SNX was trading above $1, finally peaking at $2.58 on the 13th of the month.
At the start of November, the SNX token was trending below $1.00. By the end of November, the price of SNX declined toward $0.55.
SNX started 2026 with a price tag of $0.45 under bearish pressure, and it decreased to $0.34 in February. The token was maintaining its price level near the same range till April.
In May, SNX is trending near $0.314, as the current market sentiment is neutral.
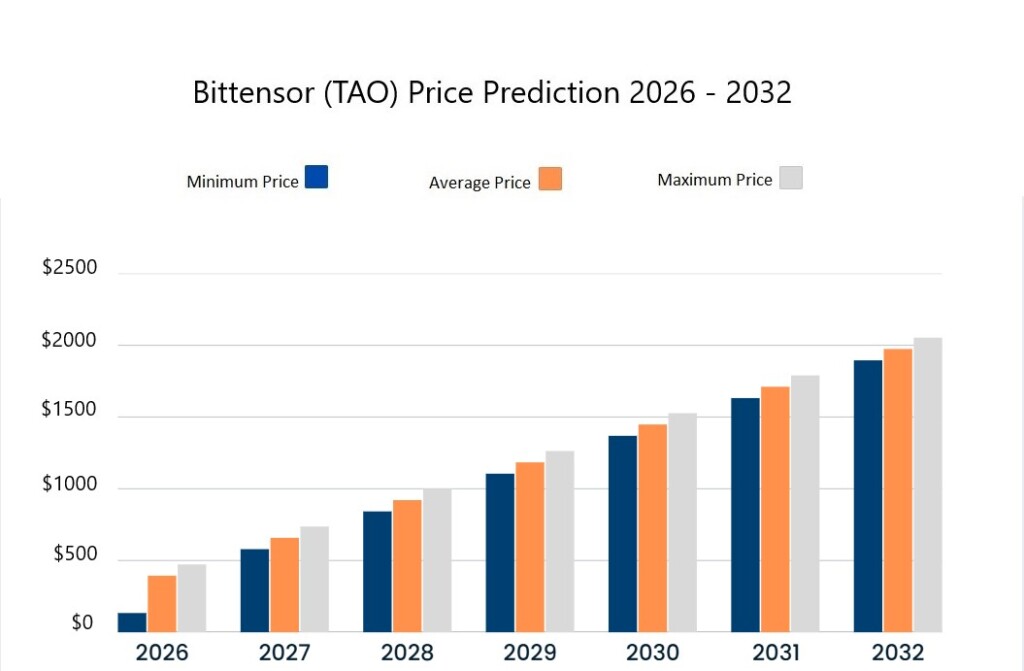
Bittensor price predictions anticipate a high of $473.94 by the end of 2026.
In 2028, TAO will range between $842.56 and $1,000.54, with an average price of $921.55.
In 2032, TAO will range between $1,895.75 and $2,053.73, with an average price of $1,974.74.
Bittensor is one of the most renowned AI-facilitated decentralized networks that promotes blockchain and artificial intelligence infusion. By leveraging Proof of Learning (POL) technology, Bittensor supports user privacy while minimizing errors. The AI models within the network are reliable, flexible, and up-to-date with modern technological advancements. The AI-based Bittensor network prioritizes cross-chain integration and native token expansions to promote collaboration among various decentralized AI networks.
TAO uses reliable authentication methods to ensure a successful transfer of nodes through its AI knowledge to correct models. The process is made possible through the PoL consensus method, which secures this process. Moreover, this technology helps to develop different stages of more advanced AI technology within the blockchain. Bittensor also uses its TAO token to incentivize node operators and AI developers.
What’s next for Bittensor and TAO in 2026 and beyond? Let’s get into the TAO price prediction and technical analysis.
Overview
Cryptocurrency
Bittensor
Ticker
TAO
Current price
$277.96 (+0.71%)
Market cap
$3.04B
Trading volume (24-hour)
$171.08M
Circulating supply
10.93M TAO
All-time low
$30.40 on May 14, 2023
All-time high
$767.68 on Apr 11, 2024
24-hour low
$280.10
24-hour high
$269.05
TAO price prediction: Technical analysis
Metric
Value
Price Volatility (30-day variation)
8.04% (Very High)
14-day RSI
48.47
50-day SMA
$275.59
200-day SMA
$258.86
Market Sentiment
Neutral
Fear and greed index
30 (Fear)
Green days
13/30 (43%)
Bittensor price analysis
TL;DR Breakdown:
TAO price analysis confirms a bullish trend at $277.96.
The altcoin has gained 0.71% over the day.
TAO token has support at $265.
On May 25, 2026, TAO price analysis indicates a mild bullish daily trend, with Bittensor currently trading at $277.96. The altcoin has shown a 0.71% increase in value over the last 24 hours, primarily due to the swift recovery observed over the day, as the token is slipping from sellers’ grip. Buyers remain in control as the TAO price has the nearest support at the $274 level, and it may continue to maintain above the aforementioned level for the coming days.
TAO/USD 1-day chart analysis
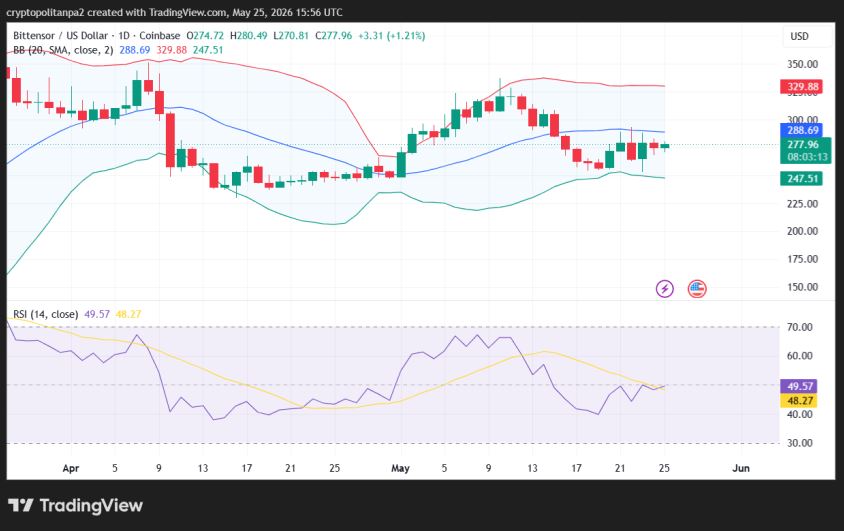
The one-day price chart of Bittensor confirmed a bullish trend for the altcoin. The TAO/USD pair value has slightly recovered to $277.96 following a bearish spell. The comparatively high volatility suggests a higher chance of a reversal in the trend or further price appreciation.
The distance between the Bollinger Bands determines the market volatility. Currently, this distance is wide, leading to high volatility levels. Moreover, the upper limit of the Bollinger Bands indicator, indicating resistance, has shifted to $329. Whereby its lower limit, indicating support, has moved to a low of $247.
The Relative Strength Index (RSI) indicator is in the neutral region, in contrast to the other technical factors, which also seem to be bearish. Its curve also increased to 54 during the day. This slowly increasing price movement today reflects a relatively balanced trading setup in the market under the larger bearish trend. However, if the bullish momentum accelerates, the RSI value will move further up into the neutral region.
TAO/USD 4-hour chart analysis
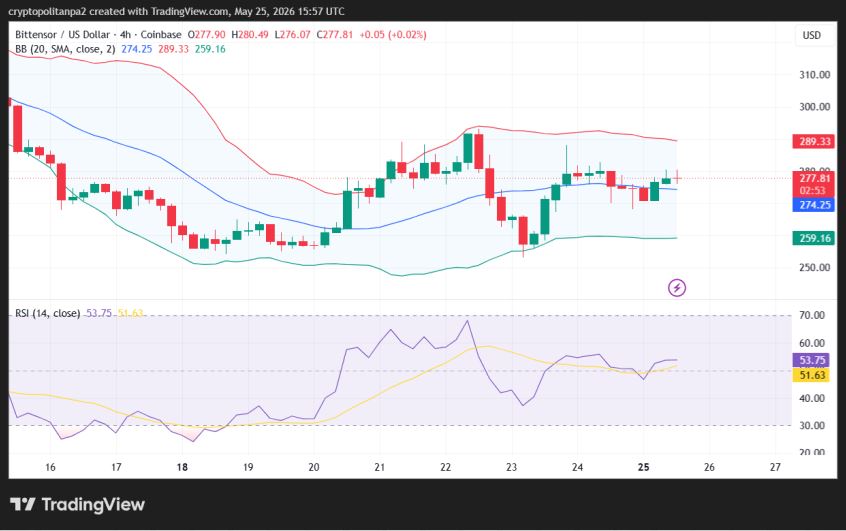
The four-hour price chart for the Bittensor coin signifies a weak bearish trend, as the token’s price movements are again in a downward direction, with sellers trying to control the market. In the past few hours, the cryptocurrency’s value has slightly decreased to $277.81. Red candlesticks on the price chart signal a returning selling pressure.
The Bollinger Bands are expanding, as the volatility level is high on the 4-hour chart. The high volatility suggests higher market unpredictability. The upper Bollinger Band has shifted to a $289 high, indicating the resistance level. Conversely, the lower Bollinger Band is at $259, indicating the support level.
Multiple technical quantitative indicators are still bearish, but the RSI indicator is in the neutral region. However, the current score of 53 and decreasing numbers confirm selling pressure. The declining curve on the indicator’s graph shows rising selling activity and bearish progress as the market conditions turn unfavorable on an hourly basis.
Bittensor technical indicators: Levels and actions
Daily simple moving average (SMA)
Period
Value ($)
Action
SMA 3
273.13
BUY
SMA 5
274.28
BUY
SMA 10
271.05
BUY
SMA 21
289.05
SELL
SMA 50
275.59
BUY
SMA 100
255.45
BUY
SMA 200
258.86
BUY
Daily exponential moving average (EMA)
Period
Value ($)
Action
EMA 3
274.73
BUY
EMA 5
273.97
BUY
EMA 10
276.07
BUY
EMA 21
279.09
SELL
EMA 50
275.26
BUY
EMA 100
267.74
BUY
EMA 200
274.04
BUY
What can we expect from Bittensor price analysis next?
Bittensor (TAO) fundamental analysis indicates a bullish outlook for current market trends. The TAO/USD price has slightly recovered to $277.96, but the bearish momentum has not faded yet. Most technical indicators signal bearishness, but the price charts lean in favor of the buyers, suggesting a potential move toward the $294 level, due to today’s recovery.
Is Bittensor TAO a good investment?
TAO coin continues to trade higher, indicating growing adoption among crypto investors as AI development and machine learning progress. Despite this, the coin faces uncertainties and volatility like all other cryptocurrencies. Our Cryptopolitan price prediction explores its potential profit and expected movements from 2026 to 2032 while considering the past performance. However, this is not investment advice, and one must conduct their own research before taking any investment decision according to their risk tolerance.
Why is TAO up?
TAO is up primarily due to buying pressure from traders after some degree of bullish price action, mainly due to strong market sentiment surrounding speculative AI tokens and the AI industry at large. Recent stability near key support levels also played a role in the resurrection of the bullish trend as traders started buying following a bull rally, and the token’s price has also increased during the past 24 hours.
How much is the Bittensor stock worth?
Bittensor (TAO) powers the Bittensor Network and is not a stock. Stocks are usually traded on stock exchanges, and stock ownership represents a stake in a company. Buying TAO tokens gives the buyer certain rights within the Bittensor Network, for example, governance participation but not ownership in a company. However, Bittensor (TAO) tokens can be purchased and traded on different exchanges, including Binance, Bitget, Coinbase, KuCoin, and Kraken. See our price analysis part for day-to-day price changes of the TAO token.
What is the price prediction for TAO 2026?
The highest Bittensor (TAO) price prediction for 2026 is around $570.20, but it is not easy to predict Bittensor price movements due to its volatile nature.
Will Bittensor reach $1000?
Yes, Bittensor should surpass $1000 by 2028. Its price will range between $842.56 and $1,000.54 during that period, which makes it a viable option to buy Bittensor tokens, considering the future performance and long-term trends, as decentralized AI development is expected to scale exponentially.
What is the total supply of Bittensor?
The total supply of Bittensor (TAO) tokens is 21 million TAO.
Does Bittensor have a good long-term future?
According to most market observers, Bittensor TAO will trade higher in the coming years. However, factors like market crashes or difficult regulations could invalidate this bullish theory.
Recent news/ opinions on Bittensor
ORO just went live on Bittensor, a specialized marketplace focused on AI agents for real-world e-commerce. It is important to remember that ORO (subnet 15) outperformed OpenAI’s GPT-5.4 on some complex online shopping evaluations.
ORO is now live on Bittensor, an open arena for AI agents.
A decentralized evaluation platform where miners submit AI shopping agents and validators assess them independently, with top performers earning emissions.
— xTAO – a Bittensor company (@xtaohq) May 1, 2026
Bittensor price prediction May 2026
A break of resistance will result in a mini bull run, with the next target at $352 during the month. The average price is expected to be $263, according to the current forecast. In a bearish scenario, TAO could drop to $197 at its lowest.
Month
Potential low
Potential average
Potential high
May 2026
$197
$263
$352
Bittensor price prediction 2026
The technical indicators are bullish on TAO for the end of 2026. It is anticipated to trade between $134 and $473.94, with an average price of $394.95, according to the Bittensor price prediction.
Year
Potential low
Potential average
Potential high
2026
$134
$394.95
$473.94
Bittensor price predictions 2027-2032
Year
Minimum Price
Average Price
Maximum Price
2027
$579.26
$658.25
$737.24
2028
$842.56
$921.55
$1,000.54
2029
$1,105.86
$1,184.84
$1,263.83
2030
$1,369.15
$1,448.14
$1,527.13
2031
$1,632.45
$1,711.44
$1,790.43
2032
$1,895.75
$1,974.74
$2,053.73
Bittensor’s price forecast 2027
TAO is expected to gain bullish momentum in 2027. According to the updated Bittensor forecast, the token will range between $579.26 and $737.24, with an average price of $658.25.
Bittensor price prediction 2028
The Bittensor outlook strengthens further in 2028. Analysts expect TAO to trade between $842.56 and $1,000.54, with an average yearly price of $921.55.
Bittensor TAO price prediction 2029
The 2029 Bittensor price prediction suggests TAO will move between a minimum of $1,105.86 and a maximum of $1,263.83, settling at an average price of $1,184.84 for the year.
Bittensor price prediction 2030
For 2030, Bittensor price predictions indicate a trading range from $1,369.15 to $1,527.13, with an average expected price of $1,448.14.
Bittensor crypto price prediction 2031
In 2031, Bittensor price prediction, TAO is projected to range between $1,632.45 and $1,790.43, with an average price of $1,711.44, which is quite higher than its current value.
Bittensor price prediction 2032
The Bittensor price prediction for 2032 places TAO between $1,895.75 and $2,053.73, with an average price of $1,974.74.
TAO market price prediction: Analysts’ TAO price forecast
Platform
2026
2027
Digitalcoinprice
$202.28
$224.87
Coincodex
$245.77
$245.77
Cryptopolitan’s Bittensor (TAO) price prediction
According to our predictions, TAO could recover to $473.94 by the end of December 2026. We expect TAO to maintain a trading range of $579.26-$737.24, with an average of $658.25 in 2027. Note that the predictions are not investment advice. Seek independent professional consultation or do your research.
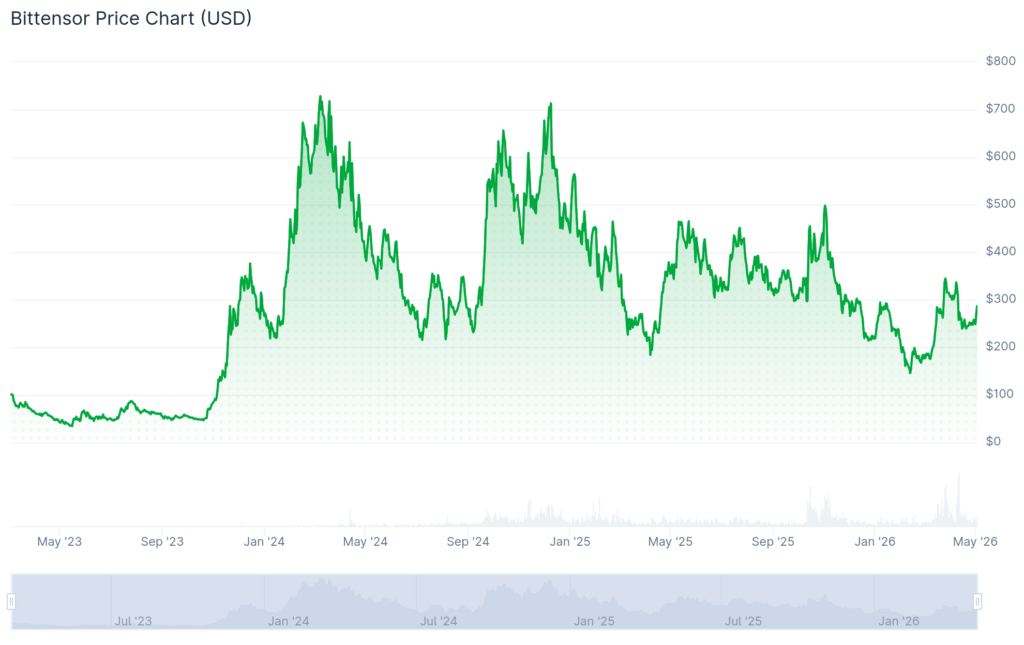
TAO launched on March 6, 2023, at $93.4, but fell below its opening price within a week, sliding into the $76 range.
By early April, it had lost half its value, dropping to $47, and continued downward to its $30.83 low in May before slowly recovering to $63 by the end of the month.
The token climbed to $86.18 in July, just under its launch price, then pulled back again and traded near $54 through October.
Momentum returned in November, pushing TAO into the $95 range, showing continuous improvement, and then sharply to a peak of $379 on December 15, 2023.
TAO trended downward into early 2024 but surged to its all-time high of $757.60 in March. It quickly corrected to $522 in April and continued weakening through mid-year, reaching $216 in July.
A brief rebound to $357 faded again as the token slipped back toward the mid-$200s by late summer, as per the crypto market price history records.
Momentum returned in October, pushing TAO into the $660 range before cooling to $468, according to the historical price data. It climbed once more to $679 in November but ultimately closed 2024 at $440.69, as the broader crypto market turned bearish again.
TAO opened in 2025 at $439.73, peaked at $565 in January, and its price decreased to the $324 level in February, taking down the token’s market capitalization as the technical indicators turned bearish due to some fundamental factors.
In March, TAO dipped to the $259 mark and descended further to $228 in April; however, in May, it recovered to $467 as the Bittensor market revived.
In October, TAO observed its year’s lowest prices extending toward $200.44.
TAO opened trading in November at $506, lost 46% of its value, and closed the month at $269.11, while at the start of December, the coin was trading between $256.29 and $298.90.
At the start of January 2026, TAO was trading near the $223 range, as the market shifted towards the bearish side.
In March, TAO traded below the psychological level of $200, but it surged past $300 in the month of April. At the start of May, TAO is trending above the $260 range, as current market sentiment turned decidedly bullish once again.
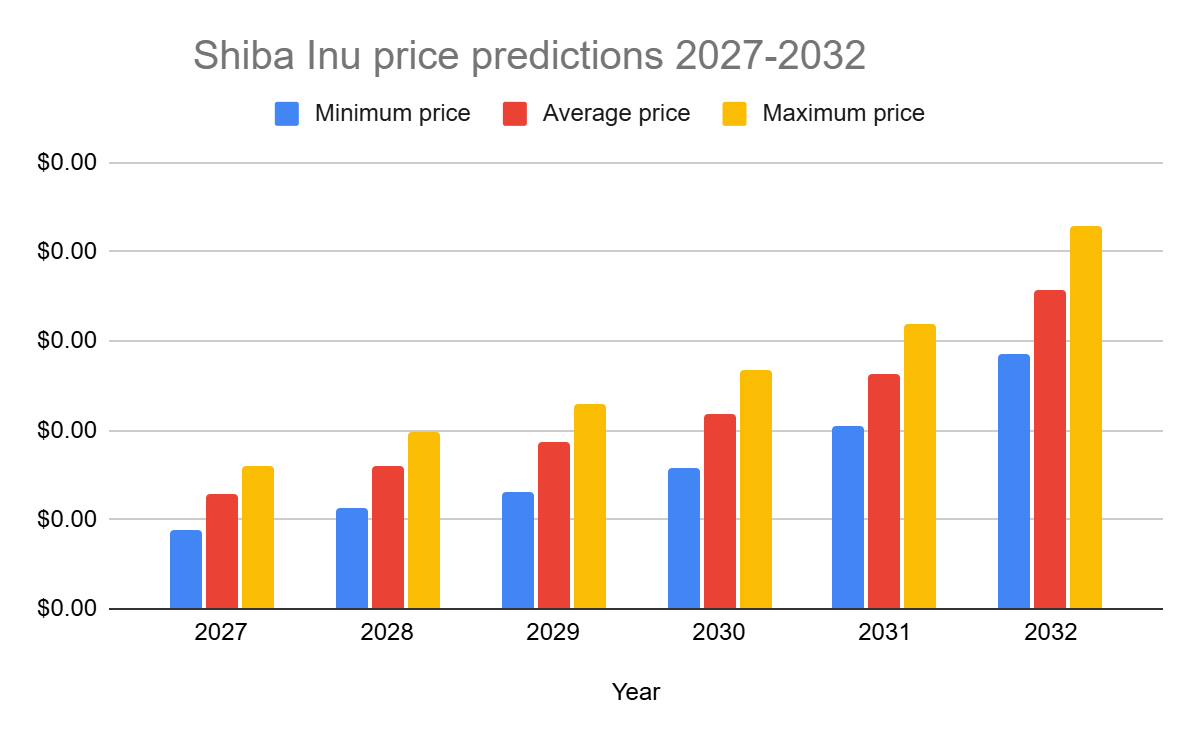
In 2026, the Shiba Inu coin price prediction suggests a maximum value of $0.00001775.
In 2029, SHIB is expected to reach a maximum value of $0.00002290.
The price of Shiba Inu is predicted to reach a maximum value of $0.00004280 in 2032.
Shiba Inu (SHIB) was initially launched as a meme coin with ambitions to surpass Dogecoin’s popularity and market presence. Over time, Shiba coin has continued to expand its ecosystem through Shibarium, ShibaSwap, and new utility-driven updates. Recent developments show growing activity as the team launched “Shib Owes You” (SOU), introduced AI tools through “Shibarium Skills,” and addressed RPC connection issues affecting users.
At the same time, SHIB gained real-world utility after integrating with OnePay, a payment network backed by Walmart. Shibarium also surpassed 270 million wallet addresses, showing steady adoption and increasing on-chain activity.
As Shiba Coin’s ecosystem grows, questions arise about SHIB’s market capitalization and its price trajectory. How much will Shiba Inu be worth in the coming years? Will the advancements drive SHIB to new highs and impact the market’s price action?
Will SHIB ever reach $1? In this Shiba Inu price prediction, analyzed by Cryptopolitan, we’ll determine future SHIB price trends between 2026 and 2032.
Today, SHIB price analysis shows a bearish pressure toward $0.0000056
The current resistance for SHIB is at $0.0000060
The immediate Support for SHIB is at $0.0000053
The SHIB price analysis for 24 May 2026 shows that SHIB continues to face selling pressure as the meme coin declines toward $0.0000056. Currently, sellers are attempting to maintain bearish momentum after recent rejection near higher resistance levels.
Analyzing the daily chart, it is clear that the SHIB price is facing bearish pressure as sellers push it toward $0.0000056. On the daily chart, SHIB opened at $0.00000568, climbed to a high of $0.00000570, dropped to a low of $0.00000563, and closed near $0.00000566. The token declined by around 0.35% in the last 24 hours, showing weakening bullish momentum.
The 24-hour trading activity remained subdued, reflecting cautious sentiment among traders as SHIB struggles to recover above immediate resistance channels. Price action suggests bears are attempting to hold the token below $0.0000058, while buyers defend the key support zone around $0.0000053.
The RSI-14 trend line has dropped below the neutral zone and trades at 37.19, indicating that sellers are currently controlling market momentum. The declining RSI curve also hints at weak buying strength and the possibility of continued consolidation or downside movement in the short term.
The MACD indicator remains in bearish territory, with the MACD line trading below the signal line and red histograms forming, confirming negative momentum and strengthening bearish sentiment on the daily timeframe.
The Immediate resistance for SHIB is at $0.0000060, while strong support is forming near the $0.0000053, where buyers may attempt to prevent further downside pressure.
Analyzing the 4-hour SHIB price chart, it shows that sellers continue dominating the short-term trend as SHIB struggles to recover above immediate resistance levels. Price action shows continued weakness below the EMA trend lines, with bears attempting to maintain pressure around the $0.0000056 region.
The RSI-14 indicator trades around 44.7, showing that bearish momentum is easing slightly, though buyers still lack enough strength for a strong breakout. The RSI curve is attempting to recover from oversold conditions, hinting at a possible short-term consolidation if buying activity improves.
The BoP indicator remains in a slightly negative region, suggesting sellers are still controlling short-term momentum near support zones. Additionally, the MACD trend line continues forming weak red histograms below the signal line, indicating that bearish momentum remains active on the 4-hour timeframe.
Immediate resistance on the 4-hour chart is positioned near $0.0000058, while support is forming around the $0.0000054 level.
Shiba Inu technical indicators: Levels and action
Daily simple moving average (SMA)
Period
Value
Action
SMA 3
$0.000005731
BUY
SMA 5
$0.000005756
SELL
SMA 10
$0.000006053
SELL
SMA 21
$0.000006196
SELL
SMA 50
$0.000006103
SELL
SMA 100
$0.000006026
SELL
SMA 200
$0.000007082
SELL
Daily exponential moving average (EMA)
Period
Value
Action
EMA 3
$0.000005758
SELL
EMA 5
$0.000005816
SELL
EMA 10
$0.000005961
SELL
EMA 21
$0.000006084
SELL
EMA 50
$0.000006122
SELL
EMA 100
$0.000006370
SELL
EMA 200
$0.000007345
SELL
What to expect from the SHIB price analysis next?
SHIB may continue trading under bearish pressure in the short term unless buyers push the price above the immediate resistance near $0.0000058. If sellers maintain control and SHIB breaks below the $0.0000054 support zone, the meme coin could see a deeper correction toward lower support levels.
Is Shiba Inu a good investment?
Shiba Inu (SHIB) is currently consolidating between key support and resistance. A breakout above resistance could lead to gains, while failure to hold support may cause further downside. SHIB may suit investors comfortable with volatility, but it’s important to monitor price action closely before making any investment decision.
Why is Shiba Inu down today?
SHIB recently declined as broader macro risk-off conditions triggered heavy selling across meme coins, with investors moving away from speculative assets amid rising inflation and Treasury yields. The downturn was intensified by large SHIB exchange inflows, bearish technical breakdowns below key support levels, and increased selling pressure from short-term traders.
Recent news on Shiba Inu
Shiba Inu (SHIB) has been included in SBI VC Trade’s “Rent Coin” lending program in Japan, offering yields of around 2% to 5% APY over a ~28-day term. The move follows SHIB’s addition to Japan’s Green List, reinforcing its status as a regulated asset and expanding its use into lending and passive income services.
SHIB included in SBI VC Trade lending expansion in Japan
SBI VC Trade continues its “Rent Coin” lending program with Shiba Inu officially listed among supported assets. The latest campaign confirms SHIB remains part of their active lending lineup.
More than 1.1 trillion SHIB tokens moved on-chain recently over the last 24 hours as whale activity intensified, while exchange reserves dropped to nearly 81 trillion SHIB, the lowest level seen in 2026 so far. Large holders continued moving tokens away from centralized exchanges into private wallets, signaling possible accumulation despite calm price action across the broader market.
SHIB Whales Just Moved 1.1 Trillion Tokens as Exchange Supply Hits 2026 Low
More than 1.1 trillion SHIB moved on-chain in the last 24 hours as whale activity accelerated behind the scenes.
At the same time, exchange reserves dropped to around 81T SHIB, the lowest level recorded… pic.twitter.com/BTsovUIQgo
Shiba Inu’s network activity continued expanding as the total holder count climbed to over 1.58 million wallets, while exchange reserves remained near yearly lows at 81.31 trillion SHIB. Recent on-chain data also showed sustained exchange outflows and negative netflows of over 452 billion SHIB, signaling continued accumulation behavior despite subdued market trading activity.
SHIB Market Snapshot
SHIB holder count has climbed to 1,585,249 wallets, continuing the steady expansion of the network while exchange reserves remain near yearly lows.
Latest exchange data: • Total Exchange Reserve: 81.31T SHIB • Total Exchange Netflow: -452.72B SHIB • 7D…
Yes, according to crypto experts’ long-term predictions, SHIB’s role in the cryptocurrency market is projected to lead it to reach $0.00005 behold 2032.
Will SHIB reach $100?
SHIB’s goal of reaching $100 is virtually impossible given its vast circulating supply in the meme coin market, which significantly influences its price movements. Additionally, to get the $100 mark, SHIB would require a significant increase in its market cap, which is beyond imagination for a meme coin.
Does SHIB have an excellent long-term future?
The Shiba Inu price made headlines in January 2025 after Shytoshi Kusama, the lead developer, stepped down. However, SHIB shows some positive movement, suggesting the ecosystem may have a promising long-term future.
However, its success will also depend on macroeconomic factors, partnerships, broader market adoption trends, and other regulatory developments that influence market cycles. You are advised to seek investment advice, do your own research, and gather expert opinions before investing in the highly volatile crypto market.
Shiba Inu price prediction for May 2026
The Shiba Inu price forecast for May 2026 is expected to range from $0.00000560 to $0.000007757. The average price for SHIB is projected to be around $0.00000668, assuming a gradual recovery and moderate buying interest.
Month
Potential low
Potential average
Potential high
May 2026
$0.00000560
$0.00000668
$0.000007757
Shiba Inu price prediction 2026
The shiba inu cost in 2026 is predicted to range from a minimum of $0.000005173 to a maximum of $0.000027, with an average price of $0.000016086. The Shiba Inu price prediction for 2026 suggests a potential high of $0.000027 and a low of $0.000005173.
Year
Potential low
Potential average
Potential high
2026
$0.000005173
$0.000016086
$0.000027
Shiba Inu price predictions 2027-2032
Year
Minimum price
Average price
Maximum price
2027
$0.00000890
$0.00001280
$0.00001610
2028
$0.00001140
$0.00001590
$0.00001980
2029
$0.00001320
$0.00001870
$0.00002290
2030
$0.00001580
$0.00002190
$0.00002680
2031
$0.00002040
$0.00002630
$0.00003190
2032
$0.00002860
$0.00003570
$0.00004280
Shiba Inu Price Prediction 2027
In 2027, the price of Shiba Inu is projected to reach a minimum level of $0.00000890. The SHIB price could rise to a maximum of $0.00001610, with an average trading price of $0.00001280 as the market gradually recovers and the ecosystem grows.
Shiba Inu Price Prediction 2028
The price of Shiba Inu is expected to reach a minimum level of $0.00001140 in 2028. The SHIB price could climb to a maximum level of $0.00001980, with an average price of $0.00001590 throughout the year.
Shiba Inu Price Prediction 2029
In 2029, the price of Shiba Inu is predicted to reach a minimum level of $0.00001320. The SHIB price could reach a maximum level of $0.00002290, with an average trading price of $0.00001870.
Shiba Inu Price Prediction 2030
In 2030, Shiba Inu is forecast to trade at a minimum value of $0.00001580. The price could reach a maximum of $0.00002680, with an average trading value of $0.00002190.
Shiba Inu Price Prediction 2031
In 2031, the price of Shiba Inu is expected to reach a minimum value of $0.00002040. The SHIB price could reach a maximum value of $0.00003190, with an average value of $0.00002630.
Shiba Inu Price Prediction 2032
Shiba Inu price is forecast to reach a lowest level of $0.00002860 in 2032. The SHIB price could reach a maximum level of $0.00004280, with an average forecast price of $0.00003570.
Our predictions show that the Shiba Inu cryptocurrency will achieve a minimum value of $0.00000545 in 2026. The Shiba Inu price could reach a maximum value of $0.00001775, with an average trading price of $0.00001160 throughout 2026. Please note that the content provided and other content on this page are for informational purposes only and do not constitute investment advice. Seek independent professional consultation or do your research.
Shiba Inu historic price sentiment
Shiba Inu Price History: Coinmarketcap
Shiba Inu surged over 300% shortly after launch, triggering a trading frenzy similar to Dogecoin’s early 2021 rally. During this period, many investors rushed to buy SHIB on easy-to-use platforms as its popularity surged and exchanges quickly listed the token to meet demand.
Shiba Inu’s price action has been marked by significant volatility, with sharp spikes and corrections driven by community hype, market sentiment, and broader crypto trends.
In 2022, SHIB started near $0.000025 but dropped to around $0.000008 by May, then moved between $0.000007 and $0.000010 for the rest of the year.
In early 2023, Shiba Inu briefly spiked to $0.000015 in February but declined gradually, stabilizing around $0.000010 by June 2023 and closing the year at $0.00001033.
In March 2024, SHIB climbed to $0.000045 before consolidating between $0.000017 and $0.000029. By late 2024, the price moved between $0.000015 and $0.000033.
In 2025, SHIB gradually declined from $0.000021 to below $0.000009 by December, despite brief rebounds during the year.
In early 2026, SHIB briefly recovered to $0.0000098 in January but fell to the $0.0000065 range in February.
In January 2026, Shiba Inu jumped from about $0.0000087 to near $0.0000098 before pulling back and stabilizing around $0.0000093.
As of February 2026, Shiba Inu (SHIB) experienced volatility, fluctuating between approximately $0.0000065 and $0.0000068, with short-term rebounds failing to sustain upward momentum.
At the start of March 2026, Shiba Inu (SHIB) remained under pressure, trading around $0.0000054 after slipping from the February range.
Shiba Inu (SHIB) experienced a bullish momentum on March 16, 2026, with the price rising 8% in 24 hours to approximately and over 17% for the week.
By the end of March 2026, Shiba Inu (SHIB) traded at around $0.0000058 after failing to sustain recoveries from mid-month gains.
By mid-April 2026, Shiba Inu (SHIB) traded around $0.0000061, showing slight stabilization after recovering from the early March range, though buying momentum remained limited.
At the start of May 2026, Shiba Inu (SHIB) traded around $0.0000062, moving in a tight range with slight consolidation, as the market showed weak momentum and no strong buying pressure.
Tezos price prediction suggests a recovery to $1.10 by the end of 2026.
XTZ could reach a maximum price of $4.50 by the end of 2029.
By 2032, XTZ’s price may surge to $7.20.
Tezos started strong as a platform for smart contracts and decentralized apps. After being released in 2018, its price touched an all-time high of $9.12 in 2021. However, throughout this time, it faced issues like lawsuits and power struggles, causing a loss of investor trust.
Eventually, the overall market’s effects plummeted the coin’s price, and it has failed to recover to the same mark since then. However, collaborations and innovations are growing on the Tezos network, bringing it into close competition with other smart contract platforms like Ethereum and Solana.
Many crypto enthusiasts ask questions like, “Can the Tezos coin hit $50 in the long term?” or at least, “Will Tezos survive?”
Let’s get into Tezos price prediction and technical analysis.
Overview
Cryptocurrency
Tezos
Ticker
XTZ
Current price
$0.343
Market cap
$372.71M
Trading volume (24-hour)
$78.16M
Circulating supply
1.085B XTZ
All-time high
$9.18 on October 04, 2021
All-time low
$0.3366 on March 29, 2026
24-hour high
$0.3591
24-hour low
$0.3325
Tezos price prediction: Technical analysis
Metric
Value
Volatility (30-day Variation)
4.24% (Medium)
50-day SMA
$0.3641
14-Day RSI
38.79 (Neutral)
Sentiment
Bearish
Fear & Greed Index
28 (Fear)
Green days
14/30 (47%)
200-day SMA
$0.4460
Tezos price analysis
TL;DR Breakdown:
XTZ remains below key resistance after falling roughly 14% from recent highs.
The daily MACD still favors bears despite slowing downside momentum.
Holding above $0.33-$0.34 is crucial for short-term recovery attempts.
Tezos price analysis 1-day chart
As of May 23, Tezos remains under bearish pressure after failing to hold above the $0.40 region earlier this month. The daily chart shows XTZ trading around $0.344, down roughly 14% from the recent local high near $0.40. Although price action has stabilized over the last few sessions, momentum indicators still favor sellers.
XTZ is currently trading below the Bollinger mid-band at $0.366, while the upper band near $0.409 continues acting as major resistance. MACD remains negative, with the MACD line still below the signal line despite histogram bars beginning to weaken slightly. That suggests bearish momentum is slowing, but a confirmed reversal has not emerged yet.
Support is forming around $0.33-$0.34, which has prevented a deeper breakdown so far. However, bulls need a sustained move back above $0.36 to regain short-term strength.
Tezos price analysis 4-hour chart
The 4-hour chart shows mild recovery attempts after Tezos briefly dipped toward the $0.33 zone. The coin has reclaimed the short-term Alligator averages, suggesting sellers may be losing immediate control.
The CMF indicator has turned positive at 0.06, showing capital inflows are gradually returning after several weak sessions. However, upside momentum still looks limited as XTZ remains below the broader trend resistance near $0.35-$0.36.
If buyers maintain control above $0.34, Tezos could attempt another push toward $0.36. Failure to hold current support may reopen downside risk toward $0.32.
Tezos technical indicators: Levels and action
Daily simple moving average (SMA)
Period
Value
Action
SMA 3
$0.3434
BUY
SMA 5
$0.3411
BUY
SMA 10
$0.3520
SELL
SMA 21
$0.3671
SELL
SMA 50
$0.3641
SELL
SMA 100
$0.3726
SELL
SMA 200
$0.4460
SELL
Daily exponential moving average (EMA)
Period
Value
Action
EMA 3
$0.3409
BUY
EMA 5
$0.3436
BUY
EMA 10
$0.3512
SELL
EMA 21
$0.3602
SELL
EMA 50
$0.3680
SELL
EMA 100
$0.3905
SELL
EMA 200
$0.4420
SELL
What to expect from XTZ price analysis next?
Tezos is stabilizing after a recent decline, but the broader structure still leans bearish until stronger resistance levels are reclaimed. The short-term chart shows improving buying activity, though bulls still need confirmation through higher highs and stronger momentum.
Is Tezos a long term investment?
Tezos could be a good investment as its price movements in the past and recent times reflect opportunities for massive gains. Of course, there have been significant bear markets, but the price recoveries that followed put money in the pockets of traders.
Also, the platform is quite developed and supports DeFi solutions, decentralized applications, and NFTs, so there are utilities that can keep the coin’s price afloat and upward. However, as always, you should always do your research because crypto can be extremely volatile.
Will Tezos recover?
Yes, Tezos is likely to recover by the end of this year. Expert forecasts suggest that XTZ will approach $1.5 by then.
Will Tezos reach $10?
Yes, Tezos can reach $10. Its all-time high was $9.18; significant bullish momentum will be required to recapture this level.
Will Tezos reach $50?
Based on expert analysis, Tezos may not reach $50 anytime soon. A huge market cap will be required to reach that point. However, mass adoption and integration with new systems could make this possible.
Does Tezos have a good long-term future?
Tezos seems to have a good long-term future because the platform regularly brings updates, and development is ongoing. It also fits into the larger narrative of decentralized finance and decentralized applications.
Recent news/opinion on Tezos
Tezos X Previewnet test goes live
📣 Tezos X Previewnet test network is now live
Explore the new execution layer with EVM and Michelson running on a shared ledger.
If the bulls back XTZ, the token could break out, reaching a peak of $0.59 while maintaining an average trading price of $0.42 in May 2026. Traders can expect a minimum price of $0.32.
Tezos price prediction
Minimum price ($)
Average price ($)
Maximum price ($)
XTZ price prediction May 2026
0.32
0.42
0.59
Tezos price prediction 2026
Experts believe the overall outlook for Tezos (XTZ) in 2026 is positive. Investors can expect a minimum market price of $0.28, an average price of $0.55, and a maximum price of $1.10.
Tezos price prediction
Minimum price ($)
Average price ($)
Maximum price ($)
Tezos price prediction 2026
0.28
0.55
1.10
Tezos price prediction 2027-2032
Year
Minimum Price ($)
Average Price ($)
Maximum Price ($)
2027
$0.40
$0.90
$2.20
2028
$0.60
$1.50
$2.80
2029
$0.75
$2.20
$4.50
2030
$0.55
$2.60
$5.00
2031
$0.80
$3.50
$6.50
2032
$1.20
$4.21
$7.20
Tezos price prediction for 2027
The XTZ price prediction for 2027 indicates a continued rise, with minimum and maximum prices of $0.40 and $2.20, respectively, and an average price of $0.90.
Tezos price prediction for 2028
Tezos’s price is expected to reach a minimum of $0.60 in 2028. The maximum expected XTZ price is $2.80, with an average price of $1.50.
Tezos price prediction for 2029
The XTZ price prediction for 2029 estimates a minimum price of $0.75, a maximum price of $4.50, and an average price of $2.20.
Tezos price prediction for 2030
The Tezos price prediction for 2030 suggests a minimum price of $0.55 and an average price of $2.60. The maximum Tezos price is set at $5.00.
Tezos price prediction for 2031
The XTZ price prediction for 2031 anticipates a surge in price, resulting in a maximum price of $6.50. Based on expert analysis, investors can expect an average price of $3.50 and a minimum of $0.80.
Tezos price forecast for 2032
According to the XTZ price forecast for 2032, Tezos is anticipated to trade at a minimum price of $1.20, a maximum price of $7.20, with an average price of $4.21.
Per the Cryptopolitan team, Tezos is expected to reach $0.5 in Q2 2026, and forecasts through 2032 point to a positive outlook for XTZ breaking above the $3 mark. For that to happen, future price movements and an increase in Tezos’ adoption must be bullish.
Tezos mainnet went live in September 2018 and immediately gained popularity for dealing with the environmental impact of blockchain technologies at that time with its PoS model.
XTZ’s price peaked during the bullish cycle of 2021, reaching above $9.0.
After 4 April 2022, XTZ’s price plummeted below $4.0; by 9 May, it had sharply fallen below the $2 mark.
XTZ surged to about $1 at the beginning of December 2022, but the bears reclaimed the market by the end of the month, resulting in a drop to $0.73. The coin recovered in 2023, averaging a market price of $0.8.
Despite its partnership milestones, Tezos (XTZ) had a bearish 2024. The coin peaked at $1.4 in April but dropped about 60% by August.
Buyers returned in September, driving the price to $0.7015, and momentum carried into November with a peak of $1.856. The rally extended to December, when XTZ reached $1.909 before corrections brought the year-end close to $1.286.
XTZ peaked at $1.49 in January 2025 before dropping to an average of $0.72 in February. From March to May, it consolidated below $0.70 with an overall average of $0.66.
In June, it traded between $0.4752 and $0.6362, while July averaged $0.7232. August opened at $0.7605 and averaged $0.8212.
September saw a minimum of $0.6437, a maximum of $0.8292, and an average of $0.7261. In October, XTZ traded between $0.5986 and $0.4692.
In November, Tezos (XTZ) traded between $0.4758 – $0.7454, and in December, it traded between $0.4223 and $0.5300.
In January 2026, the coin traded between $0.4472 – $0.6352, and in February, the coin traded between $0.3588 – $0.4473. In March, XTZ traded within the range of $0.3366 – $0.4088, and in April, the coin traded between $0.339 – $0.397.
As of May 2026, Tezos (XTZ) is trading around $0.343.