
Optimism price prediction 2026–2032: Will OP token gain momentum?
Key takeaways:
- By the end of 2026, OP is expected to have a minimum and maximum price of about $0.08 and $0.45, respectively.
- Optimism price prediction for 2029 suggests the token could reach a maximum value of $2.80.
- In 2032, OP tokens will range between $0.55 and $4.50, with an average value of $1.90.
Optimism’s (OP) commitment to innovation is highlighted by its support for Layer-3 solutions. These solutions enable the development of decentralized applications (dApps) on top of Layer-2 chains, contributing to the expansive Optimism Superchain.
The platform’s initiatives, including introducing custom gas tokens and Plasma mode aimed at reducing onboarding and operational costs, make it more accessible for new users and developers. As the market closely watches the price movements and growth trajectory of the token, can Optimism reach $10 soon?
Let’s get into the OP price prediction for 2026 – 2032.
Overview
| Cryptocurrency | Optimism |
| Token | OP |
| Price | $0.1255 |
| Market Cap | $271.45M |
| Trading Volume | $54.66M |
| Circulating Supply | 2.150B OP |
| All-time High | $4.85 (Mar 06, 2024) |
| All-time Low | $0.2519 (Dec 26, 2025) |
| 24-hour High | $0.1314 |
| 24-hour Low | $0.1243 |
Optimism price prediction: Technical analysis
| Metric | Value |
| Volatility (30-day Variation) | 10.55% (Very High) |
| 50-Day SMA | $0.1254 |
| 14-Day RSI | 43.56 (Neutral) |
| Sentiment | Bearish |
| Fear & Greed Index | 28 (Fear) |
| Green Days | 13/30 (43%) |
| 200-Day SMA | $0.2242 |
Optimism price analysis
TL;DR Breakdown:
- OP has fallen roughly 30% from its recent local high near $0.18.
- The daily MACD and the 4-hour structure both confirm bearish momentum.
- RSI is oversold, but bulls still lack confirmation of a reversal.
Optimism 1-day price chart
As of May 18, OP remains under heavy bearish pressure after failing to sustain its sharp breakout rally earlier this month. The token surged toward $0.18 before reversing aggressively and has now dropped to $0.1257, marking a decline of roughly 30% from the recent peak.
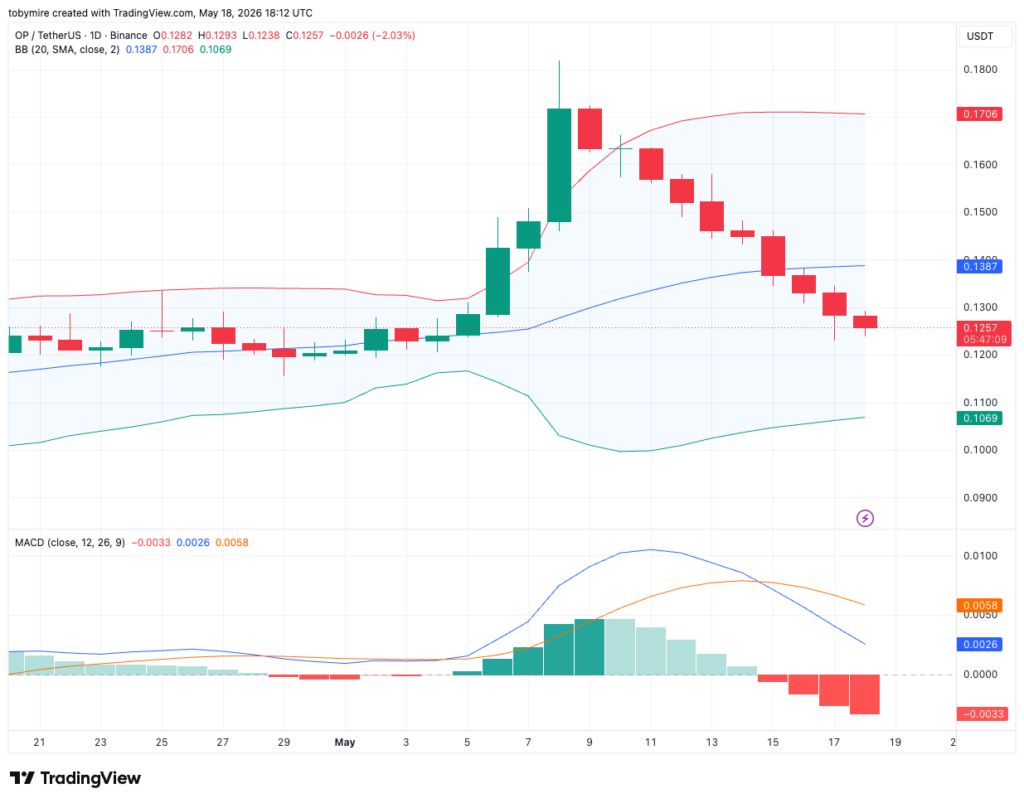
The daily chart shows OP trading below the Bollinger mid-band at $0.1387, while MACD has completed a bearish crossover with expanding red histogram bars, confirming fading momentum and increasing seller dominance. Consecutive lower closes also suggest buyers are struggling to defend key support zones.
The immediate support sits near $0.123-$0.125. If this range breaks, OP could revisit the psychological $0.12 level and potentially slide toward $0.11. On the upside, bulls need to reclaim $0.13 first before any meaningful recovery attempt toward $0.138 becomes possible.
Optimism 4-hour price chart
The 4-hour chart remains decisively bearish, with OP trading below all Alligator moving averages while printing a clear lower-high structure. RSI has dropped to 26, signaling oversold conditions, though no strong reversal confirmation has appeared yet.
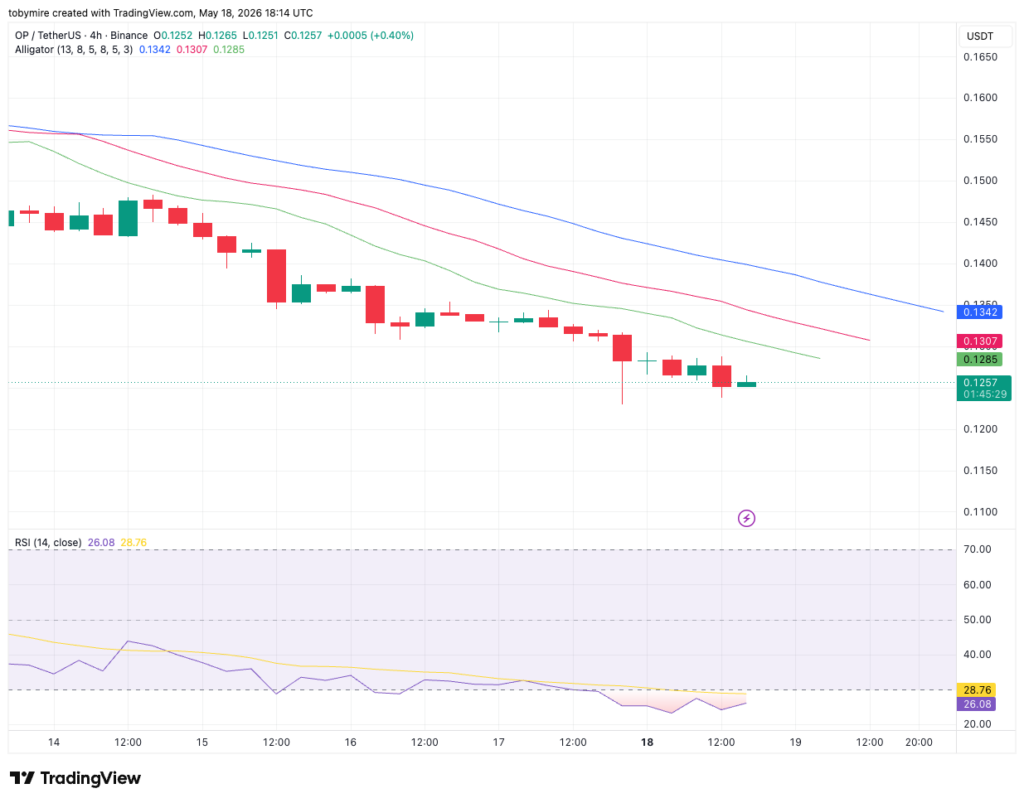
OP continues drifting downward with weak bullish candles failing to gain momentum. The trend still favors sellers unless OP can recover above the $0.128-$0.13 resistance zone in the short term.
A short relief bounce is possible due to the oversold RSI reading, but sustained upside remains unlikely while momentum indicators stay negative.
Optimism technical indicators: Levels and action
Daily simple moving average (SMA)
| Period | Value | Action |
|---|---|---|
| SMA 3 | $0.1324 | SELL |
| SMA 5 | $0.1376 | SELL |
| SMA 10 | $0.1496 | SELL |
| SMA 21 | $0.1376 | SELL |
| SMA 50 | $0.1254 | BUY |
| SMA 100 | $0.1311 | SELL |
| SMA 200 | $0.2242 | SELL |
Daily exponential moving average (EMA)
| Period | Value | Action |
|---|---|---|
| EMA 3 | $0.1326 | SELL |
| EMA 5 | $0.1367 | SELL |
| EMA 10 | $0.1406 | SELL |
| EMA 21 | $0.1383 | SELL |
| EMA 50 | $0.1344 | SELL |
| EMA 100 | $0.1583 | SELL |
| EMA 200 | $0.2422 | SELL |
What to expect from Optimism?
Optimism’s recent rally has fully cooled off, and both timeframes now point to continued bearish pressure. Unless buyers reclaim key resistance levels quickly, OP could continue grinding lower toward the $0.12-$0.11 range.
Is Optimism a good crypto investment?
Optimism (OP) could be a good investment if you believe in Ethereum scaling and the growth of Layer 2 solutions. However, like all crypto, it’s risky, and its value depends on adoption and market trends. Only invest what you’re willing to lose!
Will OP recover?
A recovery is possible, but we fear the overall bearish sentiment makes a short-term rebound unlikely. However, as the market consolidates, we expect reduced volatility, which may lead to a breakout in either direction, depending on market dynamics.
Will OP reach $50?
Reaching $50 for Optimism (OP) would be an ambitious target, requiring a significant increase in its price. This level would likely only be achievable in a highly favorable market environment, with substantial advancements in Ethereum adoption, widespread use of Layer 2 solutions, and strong overall market growth.
Will OP reach $100?
Reaching $100 for Optimism (OP) would be extremely ambitious and require unprecedented growth and adoption.
Does Optimism have a good long-term future?
Yes, Optimism shows strong potential for growth and sustained interest, indicating a positive long-term outlook.
Recent news/opinion on Optimism
- Alchemix v3 is now live on OP Mainnet. The release introduces Mix-Yield Tokens, a Fixed-Duration Transmuter, and 90% LTV vaults.
Optimism price prediction May 2026
Optimism’s price prediction for May 2026 suggests a potential low of $0.1053, an average of $0.115, and a high of $0.1302.
| Optimism price prediction | Potential Low | Potential Average | Potential High |
| Optimism price prediction May 2026 | $0.1053 | $0.115 | $0.1302 |
Optimism price prediction 2026
The price of Optimism is predicted to reach a maximum value of $0.45 in 2026. Traders can anticipate a minimum price of $0.08 and an average trading price of $0.18.
| Optimism price prediction | Potential Low | Potential Average | Potential High |
| Optimism price prediction 2026 | $0.08 | $0.18 | $0.45 |
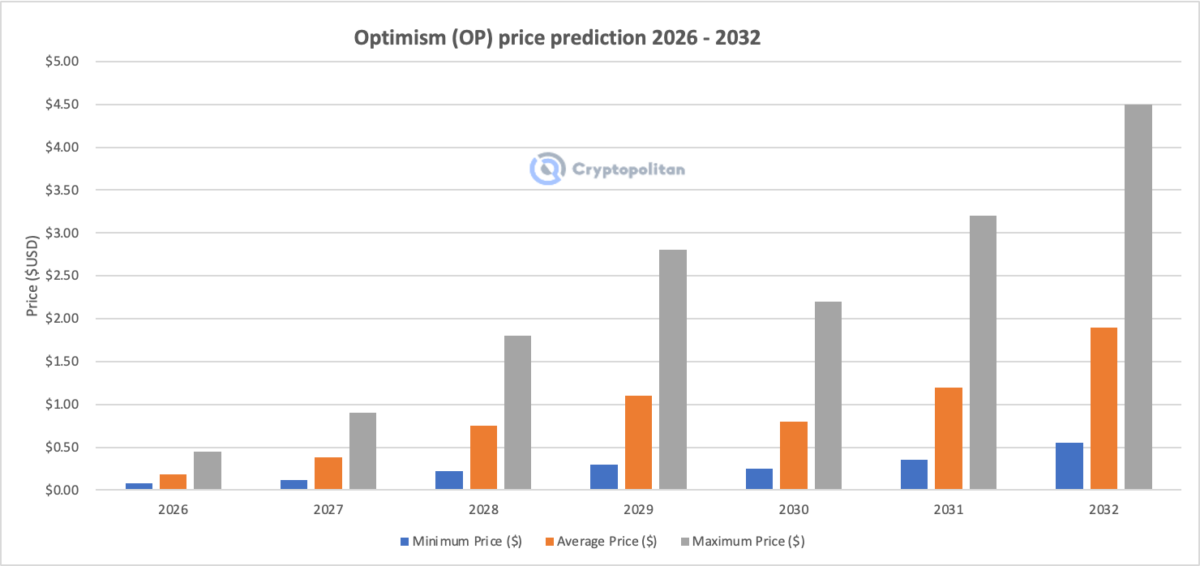
Optimism price predictions 2027–2032
| Year | Minimum Price ($) | Average Price ($) | Maximum Price ($) |
| 2027 | $0.12 | $0.38 | $0.90 |
| 2028 | $0.22 | $0.75 | $1.80 |
| 2029 | $0.30 | $1.10 | $2.80 |
| 2030 | $0.25 | $0.80 | $2.20 |
| 2031 | $0.35 | $1.20 | $3.20 |
| 2032 | $0.55 | $1.90 | $4.50 |
Optimism price prediction 2027
In 2027, the Optimism price prediction suggests a maximum price of $0.90, an average trading price of $0.38, and a minimum price of $0.12.
Optimism price prediction 2028
Per the Optimism price forecast for 2028, OP could reach a peak price of $1.80. The average price is projected around $0.75, with a minimum expected at $0.22.
Optimism price prediction 2029
The Optimism price prediction for 2029 suggests a peak value of $2.80. The minimum trading price is expected to be $0.30, while the average market value is projected to be around $1.10.
Optimism price prediction 2030
The Optimism forecast for 2030 suggests a minimum price of $0.25, a maximum price of $2.20, and an average price of $0.80.
Optimism price prediction 2031
According to the Optimism price prediction for 2031, OP could potentially reach a maximum price of $3.20, a minimum price of $0.35, and an average value of around $1.20.
Optimism price prediction 2032
In 2032, the minimum price of Optimism is forecasted to be around $0.55. OP’s value can reach a maximum of $4.50 with an average trading value of $1.90.
Optimism market price prediction: Analysts’ OP price forecast
| Firm | 2026 | 2027 |
| CoinCodex | $0.1274 | $0.3488 |
| DigitalCoinPrice | $0.15 | $0.0578 |
Cryptopolitan’s Optimism (OP) price prediction
Cryptopolitan’s overall price prediction for Optimism (OP) suggests a conservative outlook for the cryptocurrency in the near term. For 2026, the maximum forecast price is between $0.6 and $0.8. Over the next few years, Optimism is projected to appreciate substantially, with prices anticipated to rise from a minimum of $4 to a maximum of $6 by 2032.
Optimism historic price sentiment
- OP launched with an initial value of $4.57 on May 31 but dropped sharply in June due to the UST stablecoin de-pegging and LUNA collapse, closing June at $0.5434. It further declined to $0.4147 by mid-July. In August, OP briefly surged above $1.90, but by mid-October, it dropped to $0.70 following the FTX collapse.
- In Q1 2023, OP surged past $3.00 during a crypto bull run but lost 66% shortly after. A recovery saw it close the year at $3.90.
- OP saw an eventful 2024, reaching an all-time high of $4.85 in March before sliding below $2.30 by mid-April. After a brief recovery to over $2.90 in May, it entered a bearish phase, trading at $1.82–$1.96 by July and $1.54–$1.62 by October. November brought a spark of hope with a peak at $2.60. OP closed December within the range of $1.611–$2.773.
- In January 2025, OP peaked at $2.18 but lost momentum, dropping to as low as $0.84 in February. OP peaked at $0.9346 in March, $0.8523 in May, $0.7478 in June, and in July, $0.86.
- In August, OP traded between $0.6178 and $0.880, and in September, it maintained an average price of $0.74.
- In November, OP traded between $0.2888 – $0.4516, and in December, the coin traded between $0.3117 – $0.3264.
- In January 2026, the coin maintained a trading range of $0.2213 and $0.3731, and in February, it traded between $0.109 – $0.2. In March, OP traded between $0.1001 – $0.1391, and in April, the coin maintained an average price of $0.11.
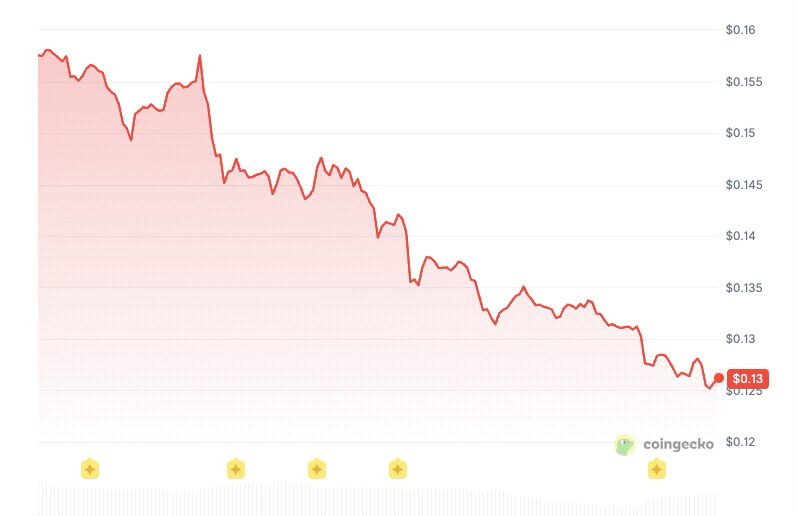
- In May, the coin is trading between $0.1252 – $0.1581.