The lead research analyst at Glassnode has highlighted how the Bitcoin supply clustered at the top levels might have to shift down before a sustained recovery can take shape.
Bitcoin Cost Basis Distribution Shows Massive Supply Above $80,000
In a new post on X, Glassnode lead research analyst CryptoVizArt has discussed how the Bitcoin supply is looking from the perspective of the Cost Basis Distribution (CBD). The CBD is an on-chain indicator that tells us about the amount of BTC that was purchased at each of the levels that the cryptocurrency has visited during its history. Below is the chart for the metric shared by CryptoVizArt.
As is visible in the graph, there is a decent amount of Bitcoin supply that was purchased at recent price levels. This supply cluster has built up as the asset has consolidated in the region since February.
While this cluster isn’t small, it’s still less dense than some other zones. From the chart, it’s apparent that there are regions above $80,000 that host the break-even level of an extreme amount of supply approaching the 495,000 BTC mark.
These zones extend up to the top levels from the 2025 bull market. Earlier, the levels near $126,000 used to be even more dense, but as the digital asset sector has gone through this downturn, supply has changed hands at lower levels, weakening these clusters. However, the zones continue to be dominant relative to the clusters below $80,000.
“The Cost Basis Distribution heatmap shows a dense supply cluster in the $80k–$126k range, representing coins still held by buyers near cycle highs,” noted the analyst. Naturally, all of these holders are in a notable amount of unrealized loss right now.
Generally, underwater investors act as an impediment to price surges as they sell near their break-even. This effect could in part be what capped out the recovery rally in May. CryptoVizArt explained:
For a sustained recovery to take shape, this supply needs to gradually migrate into new buyers’ hands at lower cost basis levels. As that wall softens, the overhang pressure eases and demand has room to build conviction.
In the past, the process has often taken some time to occur for Bitcoin. “This transition can be achieved through deeper correction and/or bear market continuation,” said the Glassnode researcher.
It now remains to be seen how the CBD will develop for Bitcoin in the near future, particularly in terms of whether the top buyers finally capitulate to new investors.
BTC Price
Bitcoin plummeted to $59,000 last week, but the asset opened on Monday with some recovery as its price is now floating around $63,200.
Solana (SOL) price fell about 17% over the past week, but the real damage sits beneath the chart. Capital left the ecosystem, long-term holders capitulated, and trading activity faded together.
The price drop was the surface. On-chain, three measures show the selloff ran deeper than a routine pullback, and they explain why the bounce off $60, the latest low, still looks fragile.
Capital Actually Left the Solana Ecosystem
The first crack is in total value locked, or TVL. It is the dollar value of assets deposited in a network’s DeFi protocols. Solana’s DeFi-only TVL sits near $4.87 billion (excluding liquid staking), down about 9.55% over the past week and roughly 15% over 30 days.
A falling TVL means users pulled liquidity out of Solana’s apps rather than simply marking existing deposits lower. That points to capital leaving the network, not just prices dropping.
Want more token insights like this? Sign up for Editor Harsh Notariya’s Daily Crypto Newsletter here.
The exit raises a sharper question about who was selling, and the holder data provides the answer.
Even Long-Term Solana Holders Left
The deepest damage shows in the holder’s behavior. Hodler net position change, a metric that tracks whether long-term holders of 155 days or more are adding or reducing supply, fell sharply amid the TVL and price decline.
The figure dropped from about 3.27 million SOL on May 31 to roughly 2.36 million SOL by June 6, as the price slid toward its low. When the most patient holders sell into weakness, it shows conviction broken, not just speculative interest.
That loss of long-term confidence is the clearest sign the selloff was structural, and the trading data confirms it.
Trading Activity and DEX Dominance Both Slid
The cooling shows in volume. Centralized exchange volume for SOL peaked at $7.03 billion on June 6, the height of the selloff, then dropped back as the panic eased, leaving turnover at its lowest since that spike.
Do note that the 7-day rising trend is due to the high volume days on June 5 and June 6.
Solana’s DEX dominance, its share of total decentralized exchange volume across crypto, is also slipping. It sits near 22.6%, below its 60-day average of 23.3% and down from a near-term high of about 30.4% on June 4.
Falling dominance shows the weakness is structural, not just a SOL price move, as capital rotates away from Solana’s on-chain trading.
Together, the three measures explain what really broke during the crash.
The Rebound Looks Fragile Until One On-Chain Level Clears
There is one tentative positive. As Solana price bounced about 13% off its June 6 low near $60, hodler net position change turned higher again. This hints that long-term holders started buying once the price stabilized.
This is not a price prediction, but the on-chain cost basis shows the hurdle ahead. The cost basis distribution heatmap, which maps the prices at which holders actually acquired their SOL, shows a dense cluster of supply near $74 to $75.
Holders who bought there tend to sell when the price returns to their entry, creating resistance.
Until DeFi TVL stabilizes and that supply zone clears, the rebound stays fragile. Whether long-term holders keep buying or fading activity wins out will decide whether Solana’s price builds on its bounce or slips back toward its low.
The average Sonic price prediction for 2026 is $0.03259.
Holders can anticipate a maximum price of $0.1574 in 2029.
By 2032, Sonic (S) might touch $0.2967
Sonic is a high-performance EVM Layer 1 blockchain built for DeFi applications, offering up to 400,000 TPS and sub-second finality. The network introduced its Fee Monetization (FeeM) program, allowing developers to earn up to 90% of the fees generated by their applications. Sonic also features a native Ethereum bridge called the Sonic Gateway, which includes a Fast-Lane transaction feature and a fail-safe security mechanism. For investors and traders following Sonic price prediction trends, these features are important because they support ecosystem growth, developer activity, and the chain’s long-term demand.
Sonic emerged from Fantom’s rebrand after Michael Kong announced the Sonic mainnet launch in March 2024. Fantom later fully transitioned to Sonic on January 16, 2025, as the project expanded through partnerships with Chainlink, Pyth Network, Alchemy, Dune, and Safe.
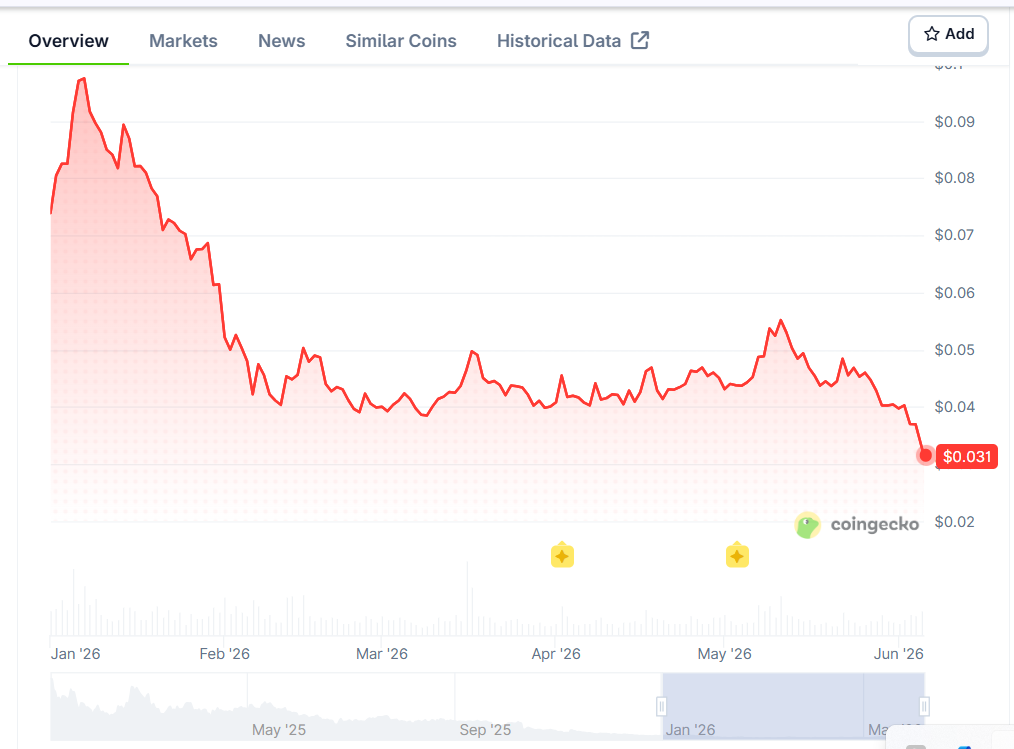
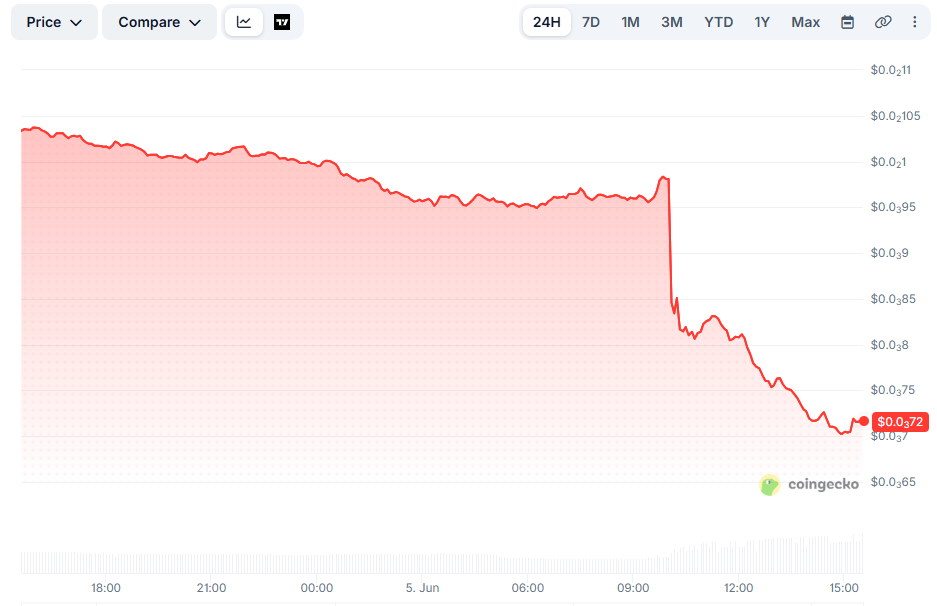
Sonic reached an all-time high of $1.03 in January 2025 before falling to a low of $0.0368 in February 2026. Investors’ questions remain. Will Sonic reclaim Fantom’s all-time high of $3.48? How high can Sonic (S) go in the coming years? Let’s take a look at Sonic’s price prediction and price prediction tool to answer these questions.
Sonic Price Prediction: An Overview
Cryptocurrency
Sonic
Token
S
Price
$0.02906
Market Cap
$83.71M
Trading Volume (24-hour)
$19.27M
Circulating Supply
2.88B S
All-time High
Jan 05, 2025 $1.03
All-time Low
Jun 05, 2026 $0.03036
24-h High
$0.040901
24-h Low
$0.040163
Sonic (S) price prediction: Technical analysis
Volatility
4.09% (Medium)
50-Day SMA
$ 0.04407
Price Prediction
$ 0.02376 (-25.50%)
14-Day RSI
37.59 (Neutral)
Green Days
11/30 (37%)
Sentiment
Bearish
Fear & Greed Index
12 (Extreme Fear)
200-Day SMA
$0.06032
Sonic price analysis S falls to a new all-time low as sellers stay in control
TL;DR Breakdown
Today’s Sonic price analysis shows strong bearish pressure as S falls to a fresh all-time low of $0.02768
Sonic’s current resistance is at $0.0321, while the immediate support remains at the all-time low of $0.0277
Today, Sonic is trading around $0.02924, down 6.32% in the last 24 hours
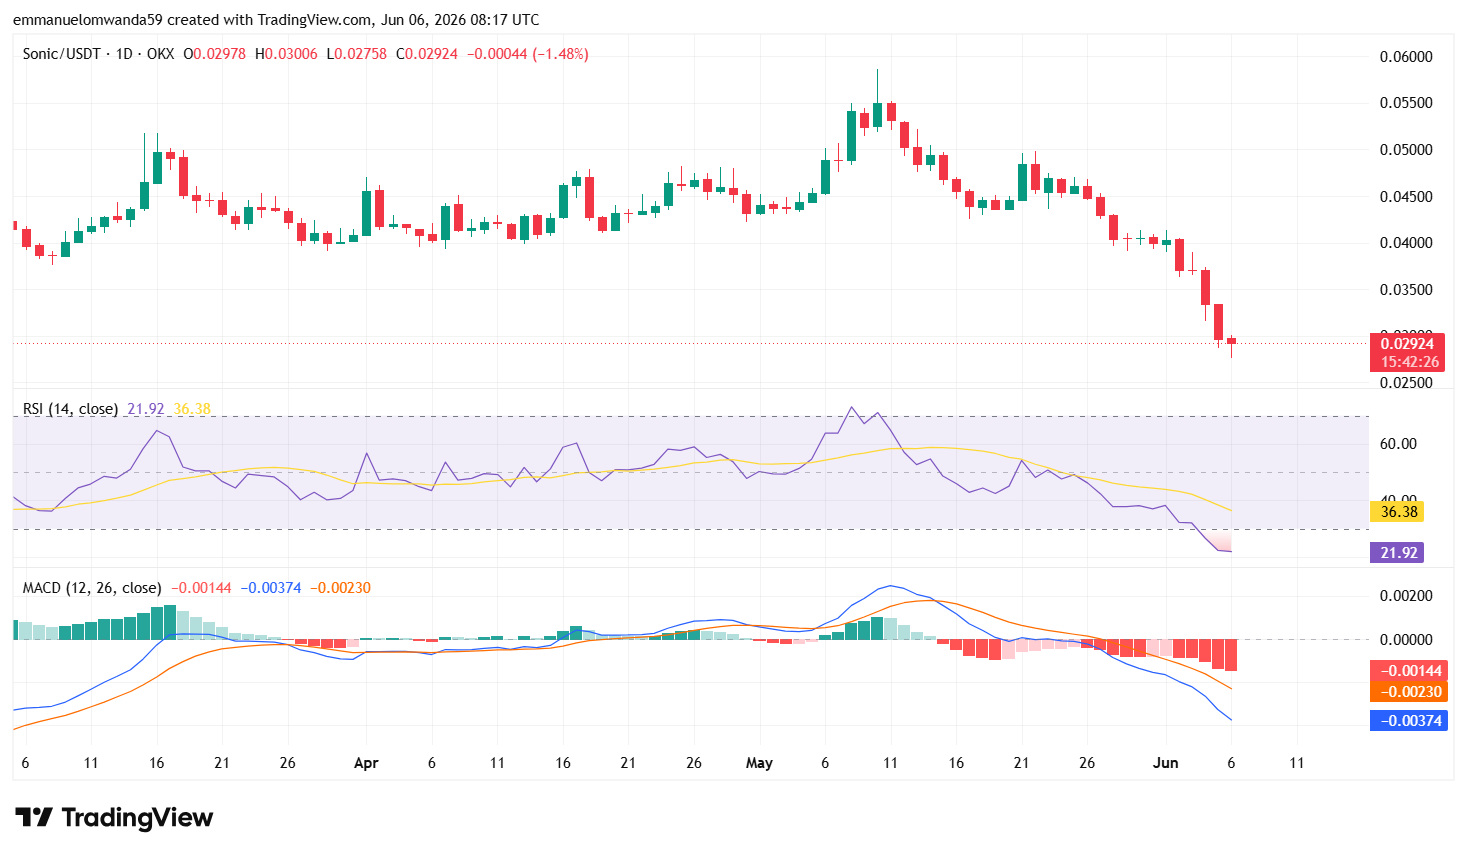
As of June 6, 2026, Sonic’s price analysis shows a bearish market structure. Sonic is currently trading at $0.02928, down 6.32% in the last 24 hours. Selling pressure increased today, driven by Sonic’s new all-time low price of $0.02768, underscoring the continued market dominance by bears. Although buyers managed to trigger a small recovery from the lows, it remains weak as the price continues to trade near historically depressed levels.
Sonic (S) price analysis 1-day chart
Analyzing the one-day chart for Sonic, it shows persistent selling pressure after the token recorded a fresh all-time low.S dropped to $0.02768, breaking below previous support levels and extending its broader downtrend that has been in place for several months.
The latest daily candle remains bearish despite a small recovery from the day’s low. The decline reflects weak market confidence, with sellers continuing to dominate price action. Sonic is now trading more than 97% below its all-time high of $1.03, showing the level of the long downtrend.
Trading activity has weakened over the past 24 hours, with volume falling by 26.14% to $18.93 million. The decline in volume suggests that market participation is cooling despite Sonic’s drop to a new all-time low, indicating limited buying interest at current levels.
S/USD Chart: TradingView
Technical indicators continue to favor sellers. The Relative Strength Index (RSI) has dropped to 21.9, placing Sonic deep in oversold territory. While such levels often precede temporary relief rallies, the indicator is yet to show any meaningful bullish divergence. The continued decline in RSI reflects strong bearish momentum and weak buying interest.
The MACD indicator remains negative as the MACD line trades below the signal line. Expanding red histogram bars suggest that downward momentum is still dominating the market despite today’s rebound from the all-time low. This setup indicates that sellers continue to control the broader trend.
Buyers need to reclaim the $0.0320 area before any meaningful short-term reversal can be considered. Until then, rallies may continue to attract selling pressure.
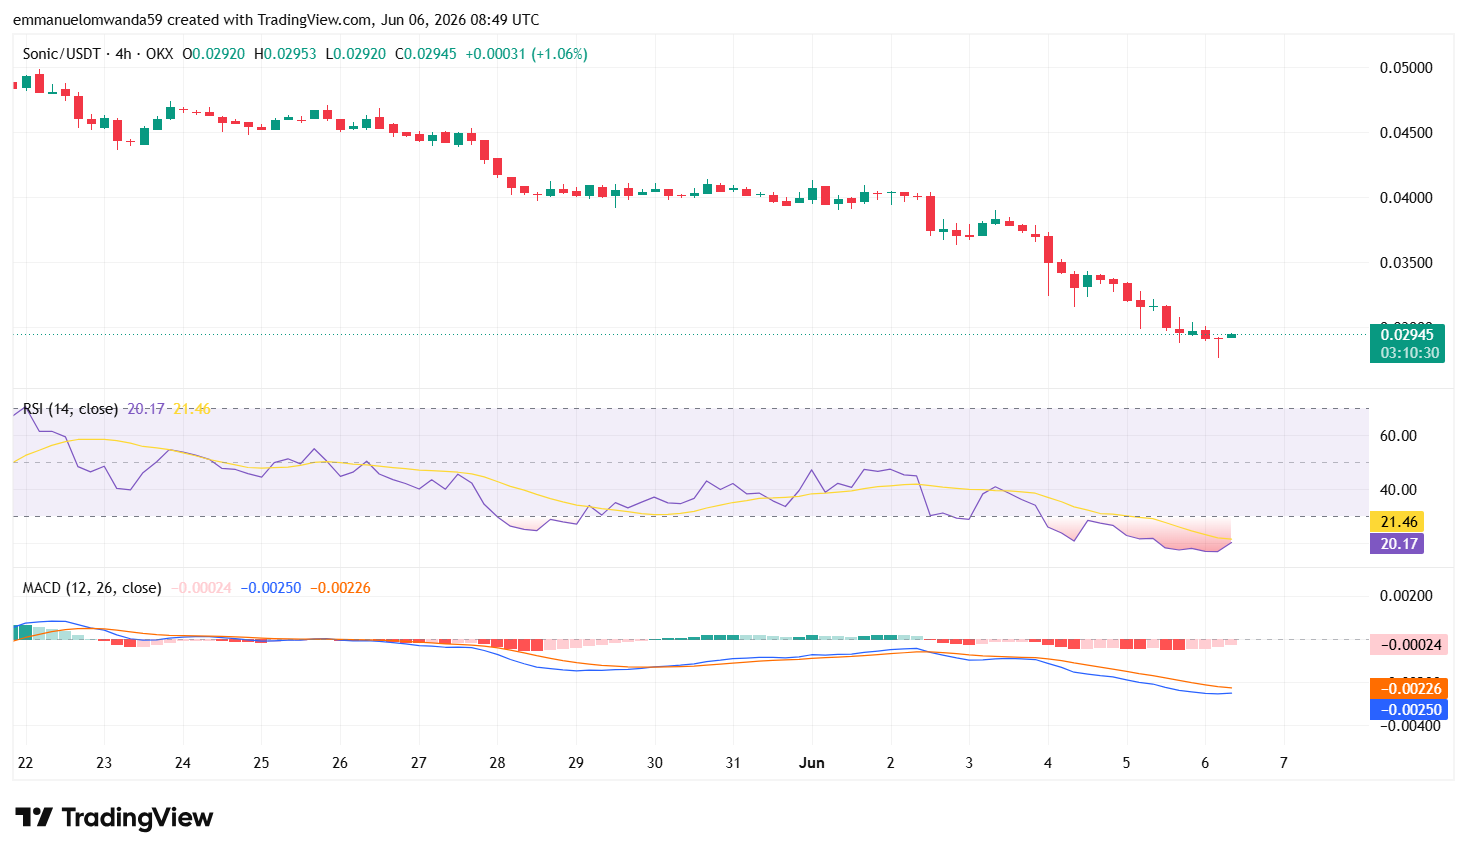
S’s technical analysis 4-hour chart
The 4-hour Sonic price chart shows bears still maintaining strong control of the market. Although the token has stabilized around the $0.0294 level, buying momentum remains weak as the broader trend continues to favor sellers.
The RSI on the 4-hour timeframe has dropped to 20.17, still in oversold territory. While this suggests selling pressure has become extreme, the indicator has yet to show a convincing recovery signal. The MACD indicator remains bearish.
S/USD Chart: TradingView
The MACD line continues to trade below the signal line, confirming that downward momentum is still dominant. However, the shrinking red histogram bars suggest that bearish momentum is beginning to slow, although buyers have not yet gained enough strength to reverse the trend.
The nearest resistance is at $0.0300, followed by a stronger barrier around $0.0320. On the downside, immediate support remains at the recently established all-time low of $0.02768. If bears force a break below this level, Sonic could face another low as price discovery continues.
Sonic technical indicators: Levels and action
Daily simple moving average (SMA)
Moving averages are calculated from the average closing price over a set period.
Period
Value
Action
SMA 3
$ 0.03570
SELL
SMA 5
$ 0.03739
SELL
SMA 10
$ 0.03926
SELL
SMA 21
$ 0.04228
SELL
SMA 50
$ 0.04407
SELL
SMA 100
$ 0.04316
SELL
SMA 200
$ 0.06032
SELL
By June 29, 2026, Sonic’s 200-day Simple Moving Average is projected to drop to $0.05181, while the 50-day SMA is estimated to reach $0.03714.
Daily exponential moving average (EMA)
Period
Value
Action
EMA 3
$ 0.03547
SELL
EMA 5
$ 0.03674
SELL
EMA 10
$ 0.03885
SELL
EMA 21
$ 0.04130
SELL
EMA 50
$ 0.04328
SELL
EMA 100
$ 0.04941
SELL
EMA 200
$ 0.08657
SELL
What can you expect from the Sonic price analysis next?
Sonic remains in a corrective trend, but Sonic’s price action is showing early signs of stabilization around the $0.0290 level, and many traders use candlestick charts to assess momentum. Each candlestick shows the opening, closing price, highest, and lowest prices for a chosen interval, helping analysts determine whether support is holding or a rebound may follow.
A successful defense of the $0.02768 support level could allow the token to recover toward $0.0300 and potentially $0.0320 in the coming sessions, according to Sonic key price levels and recent market activity. On the downside, a break below the all-time low of $0.02768 would likely expose Sonic to further weakness, with sellers attempting to establish new lower levels.
In a relatively small market, whales can control short-term moves. Until buyers reclaim the $0.0300–$0.0320 resistance zone, the overall market structure remains bearish despite oversold conditions appearing on technical indicators.
Why is Sonic down today?
Sonic (S) is trading around, down 12.44% over the last seven days, suggesting the broader trend remains bearish despite today’s modest recovery. With no major news catalyst driving recent price action, the decline appears to be due to typical altcoin volatility and profit-taking following earlier gains.
Is Sonic a good investment?
Sonic is a high-speed, scalable blockchain platform that competes with established chains such as Solana and Ethereum L2s, positioning itself as a performance-focused chain within the blockchain ecosystem. Despite its potential, investing in Sonic (S) involves risks typical of cryptocurrencies, including market volatility, so any current forecast should weigh whether it looks like a good buy right now.
While Sonic does not currently lead the market, it maintains a credible and stable position as a reliable, mid-tier chain. Sonic (S) network is also transitioning from a community-driven layer-1 to a more structured corporate model, which investors should factor in before they invest. Own research and assessing personal risk tolerance are essential for anyone considering S as a potential investment opportunity.
Will Sonic reach $5?
The price of Sonic could reach $0.1215 by 2030, with price predictions suggesting a high of $0.1678. The base case scenario for Sonic’s price by 2030 is projected to be around $0.1215, with potential highs depending on market conditions. However, achieving this depends on market conditions, overall technical factors, and fundamental factors.
Will Sonic reach $10?
Based on our technical analysis of multiple technical quantitative indicators, S’s price projections for 2032 estimate a range, with Sonic expected to reach about $0.2967 but not approach double-digit prices within the next 6 years. A move to $10 is not guaranteed; even by 2046, Sonic is expected to reach $0.8797, still far below $10 and requiring over 25,386% upside to hit that mark.
Is Sonic a safe network?
Sonic is regarded as a secure blockchain platform whose architecture differs from traditional blockchains, using its unique Lachesis consensus mechanism to enable high-speed, scalable transactions.
Its directed acyclic graph approach helps deliver theoretical throughput of up to 10,000 transactions per second with finality in less than 500 milliseconds. However, as with any blockchain network, users should exercise caution, use official channels, and follow best security practices to protect their assets.
Does Sonic have a good, long-term future?
Sonic shows potential for a strong long-term future, with price predictions suggesting significant growth by 2030 and beyond. Analysts forecast prices could reach between $0.1215 and lowest prices at $0.1678, driven by its unique blockchain technology, increasing adoption in decentralized applications, and robust ecosystem growth.
Ecosystem growth, fueled by increased developer activity and more developers joining the platform, is crucial for Sonic’s long-term success. Total Value Locked (TVL) in dApps is a critical metric for long-term growth, reflecting real-world usage and platform strength. Sonic also continues airdrop campaigns and support for liquid staking tokens to help boost TVL and revenue generation.
Additionally, the Sonic ecosystem has established a $25 million fund to attract builders and improve user metrics, further supporting future expansion. Future ecosystem expansion may also benefit from plans to pursue a Spot ETF and private investment vehicles on Nasdaq, though the long-term impact remains uncertain. However, market volatility remains a concern.
Recent news/opinion on Sonic (prev. FTM)
Sonic recently expanded its ecosystem focus through infrastructure and security upgrades, including USDC integration support and new stablecoin functionality via Flying Tulip. The developments aim to strengthen Sonic’s position as a developer-friendly EVM chain while improving on-chain utility and security, even as the token continues facing bearish pressure in the broader crypto market.
Sonic recently highlighted the growing adoption of its vertical integration model. The network revealed that its USSD stablecoin is generating approximately $80,000 in annualized real-world asset (RWA) yield without incentives, while Shadow’s AutoVault has already purchased around 350,000 S tokens through market activity.
Vertical integration on Sonic is moving from concept to data.
With zero incentives, $USSD is at ~$80K annualized RWA yield, while @ShadowOnSonic‘s AutoVault has already bought ~350K $S from market activity.
The Sonic price prediction for June 2026 suggests a modest recovery from current levels, with the price expected to range between $0.02881 and $0.03259. The average price is projected to be around $0.03259, as market sentiment, trading volume, and broader crypto market conditions continue to influence short-term price action.
Period
Potential Low ($)
Average Price ($)
Potential High ($)
Sonic (S) price prediction June 2026
$0.02881
$0.03259
$0.03259
Sonic price prediction 2026
In 2026, Sonic (S) is expected to trade between $0.02750 and $0.03789, with an average price of around $0.03270. This suggests relatively stable price action throughout the year, with modest upside potential if ecosystem growth and market sentiment improve.
Period
Potential Low ($)
Average Price ($)
Potential High ($)
Sonic Price Prediction 2026
$0.02750
$0.03270
$0.03789
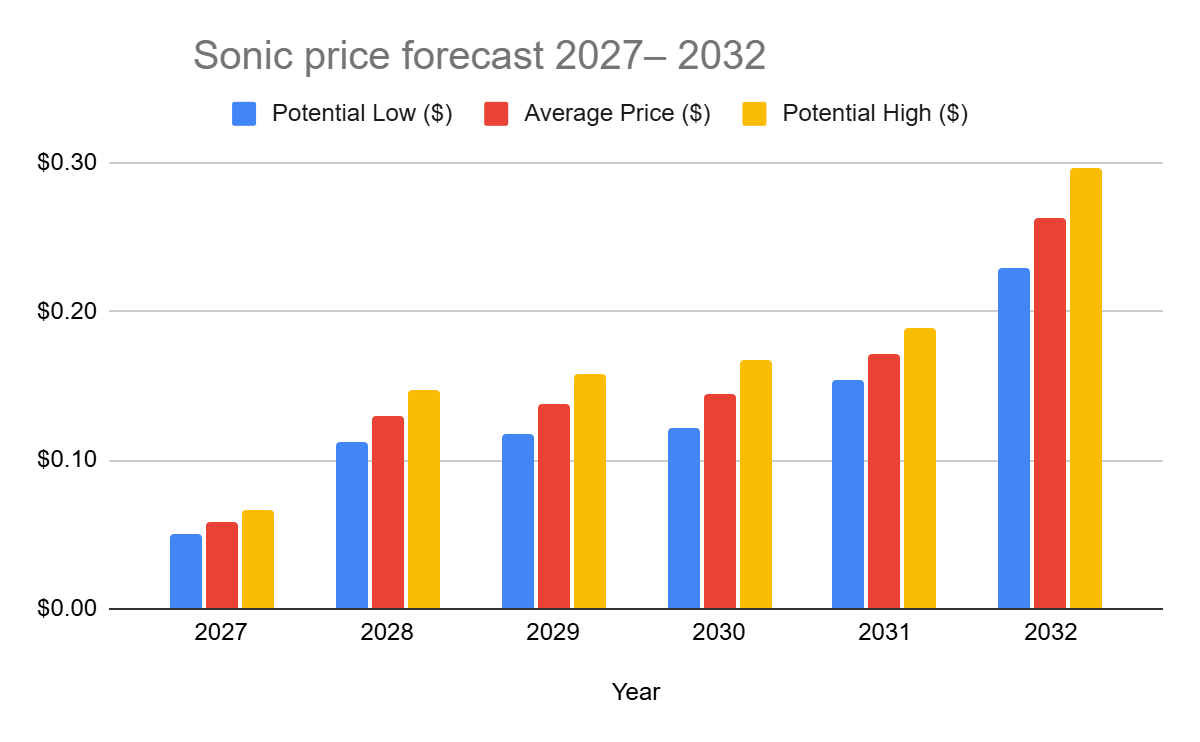
Sonic price forecast 2027– 2032
price prediction chart
Year
Potential Low ($)
Average Price ($)
Potential High ($)
2027
$0.0499
$0.0581
$0.0662
2028
$0.1128
$0.1296
$0.1465
2029
$0.1169
$0.1372
$0.1574
2030
$0.1215
$0.1446
$0.1678
2031
$0.1545
$0.1717
$0.1889
2032
$0.2285
$0.2626
$0.2967
Sonic (S) price prediction 2027
The Sonic forecast for 2027 speculates that the price might reach a maximum of $0.0662 by 2027. On the lower end, corrections may pull the price to $0.0499 with an expected average trading price of around $0.0581. As an alternate modeled scenario, the predicted price for 2027 could be around $0.03998, representing a potential 1.90% increase.
Sonic (S) price prediction 2028
Sonic’s (prev. FTM) 2028 forecast of $0.1128–$0.1465, averaging $0.1296, is linked to growing adoption of its rebranded ecosystem. By then, expanded DeFi, NFT, and gaming use cases are expected to strengthen utility and demand. The projected rise in Sonic’s price by 2028 is supported by its Fee Monetization model and the fee burning mechanism, which incentivize developer activity and reduce token supply. Network scalability upgrades and rising developer engagement support gradual appreciation, while market cycles keep growth within range.
Sonic (S) price prediction 2029
In 2029, Sonic’s market price might stabilize at $0.3238 while attaining an average trading price of around $0.2698, and a minimum price of around $0.2158. The broader outlook points to $0.03250 by the end of 2026, $0.1464 by 2030, and $0.2327 by 2040, based on combined technical and fundamental factors.
Sonic (S) price prediction 2030
Sonic is expected to reach a maximum of $0.1678 by 2030. However, it could fall to $0.1215 with an average price of $0.1446.
Sonic (S) price prediction 2031
Sonic is projected to hit a high of $0.1889 in 2031. In the event of a price correction, it could drop to $0.1545 with an average of $0.1717
Sonic (S) price prediction 2032
Sonic is expected to reach a high of $0.2967 in 2032. The average trading price is expected to be $0.2626, and the minimum price is projected to be $0.2285.
Sonic price prediction 2026-2032
Sonic market price prediction: Analysts’ FTM price forecast
Firm Name
2026
2027
Coincodex
$ 0.02589
$ 0.06573
DigitalCoinPrice
$ 0.03189
$0.0817
It’s important to note that these analyst forecasts may be influenced by broader market rallies and shifts in market sentiment, which can drive Sonic’s price targets higher or lower depending on overall investor optimism or pessimism.
Cryptopolitan’s Sonic (S) price prediction
Our predictions show that the Sonic token could achieve a minimum value of $0.02750 in 2026. The Sonic price may reach a maximum value of $0.03789, with an average trading price of $0.03270 throughout 2026. Investor confidence, along with supply and demand dynamics, plays a key role in Sonic’s price action.
Fundamental events such as hacks and other real-world occurrences can significantly impact price movements. Please note that the content provided on this page is for informational purposes only and does not constitute investment advice. Conduct your own research before making financial decisions
Sonic’s (S) historic price sentiment
Sonic price history
Fantom (FTM) launched in 2018 at $0.0182, hit a low of $0.00229 in 2020, and peaked at $3.24 in 2021 during the DeFi boom.
Following the 2022 bear market, FTM recovered to $0.55 by early 2024 before rebranding to Sonic Labs in August 2024.
The 1:1 FTM-to-Sonic (S) token swap began in December 2024, with Binance completing it by January 2025.
Sonic hit a new ATH of $1.029 in January 2025, but steadily declined to around $0.33 by late August.
By early September 2025, Sonic traded stably between $0.3092 and $0.3126.
Early September, Sonic traded around $0.309–$0.313, showing relative stability compared to its August lows.
Mid-September – Price remained in the ~$0.30–$0.33 band, with minor upward drift toward ~$0.32.
Late September – The token approached $0.26, as reported by markets, showing a decline and increased volatility.
Early October – Trading price dropped further into the ~$0.23–$0.26 range, indicating a weakening trend.
By November 3, Sonic had fallen to approximately $0.122, marking a substantial decline from early September levels.
At the beginning of November 2025, Sonic (S) traded around $0.12–$0.14, occasionally spiking to roughly $0.17 before retreating.
Through mid-November, the price generally drifted downward, reaching a low near $0.10–$0.11 around November 21.
From late November to December 3, S recovered slightly — trading in a narrow band around $0.10–$0.11, suggesting consolidation and stabilization after the mid-month slump.
From early December, Sonic traded around $0.071–$0.075 on Dec 3–Dec 6, then moved higher through mid-December as the price climbed into the $0.085–$0.095 zone by Dec 14–Dec 17, reflecting increasing buying interest late in the year.
Into late December and early January, S stabilized in the $0.07–$0.08 range before rising above $0.08, closing around $0.082–$0.086 by Jan 4 2026, showing a modest recovery into the new year.
On January 4, 2026, Sonic was trading near $0.086–$0.090 after stabilizing from December weakness, with modest rebounds in the first week of January as buyers emerged off key support levels.
By February 3, 2026, Sonic had drifted lower toward roughly $0.065–$0.070, reflecting continued selling pressure and failed rallies, with price consolidating near the low end of its recent range.
Sonic (S) traded around $0.052 to $0.048 between Feb 3 and Feb 10, 2026, before declining toward the $0.041 to $0.039 range by late February amid steady selling pressure.
From early March to Mar 14, 2026, Sonic moved between $0.038 and $0.044 with a gradual rebound attempt as the price stabilized near the $0.040 support zone.
From March 14 to late March, Sonic drifted lower from $0.0514 toward $0.040–$0.042, unable to sustain any meaningful bounces amid broad market weakness.
By April 7, its price pressed critical $0.040 support at $0.0396–$0.0414 — dangerously close to its all-time low of $0.0368 set on February 28.
Sonic is trading at around $0.04951 at the start of May 2026.
By the end of May 2026, Sonic had retreated to around $0.040, erasing much of its early-May gains after a failed rally above $0.055 and stabilizing near a key support zone amid continued selling pressure.
At the start of June 2026, Sonic traded around $0.03136, extending its decline after losing the key $0.040 support level in late May.
Bitcoin’s bearish structure over the past few weeks has raised clear concerns about the flagship cryptocurrency’s future. Amid these concerns are speculations concerning its trajectory, some of which point to bottoms as low as $25,000. However, an on-chain analyst recently took to the social media platform X to explain why Bitcoin’s fall to $25,000 is an unlikely scenario in its current cycle.
Electrical Cost Model Points To Potential Bitcoin Bottom
In a June 6 post on X, crypto analyst Ted Pillows implied that the Bitcoin price might see further declines before a definitive bear market bottom is established. This conjecture is based on the Bitcoin Electrical Cost model.
For context, the model estimates Bitcoin’s fundamental production costs by measuring the electricity required to mine new BTC. Because mining operations tend to consume substantial amounts of energy, the metric is often used as a proxy for Bitcoin’s inherent value. This is because it represents the minimum price at which miners can sustainably operate over the long term.
In line with historical data, Pillows explained that Bitcoin bear markets have never fallen below this Electrical Cost, despite the severe drawdowns seen during these periods. On the contrary, bear markets have often found bottoms near this crucial price level.
Pillows pointed out that Bitcoin’s current Electrical Cost sits at approximately $48,694 — a threshold still somewhat far from Bitcoin’s current market price. According to the analyst, this suggests that the BTC price could find support near $50,000 if the current downturn continues.
However, Pillows highlighted a caveat in this analysis, stating that it would take an extraordinary global event for this support zone to be broken. In the event that the world is hit by a recession or a pandemic as severe as COVID, the Bitcoin price could temporarily fall below its estimated production cost due to panic-driven sales.
Silent BTC Accumulation On Binance Underway As Outflows Steadily Climb
In a Quicktake post on CryptoQuant, analyst CryptoOnchain highlighted an interesting contradiction ongoing within the Bitcoin market. According to the on-chain analyst, BTC accumulation events have been underway on Binance.
The analyst noted that technical indicators — notably, the RSI (14) and the EMA50/200 — are telling a clearly bearish story. RSI readings, for example, have fallen to extreme levels near 6.4, and the EMA50/200 currently displays a “Death Cross” pattern.
At the same time, Binance’s Exchange Netflows reads as negative (-0.58σ), indicating that Bitcoin is leaving Binance consistently—an event that further suggests its holders are accumulating BTC rather than simply panic-selling. But then CryptoOnchain explained that the unignorable threat of a long squeeze still looms, given the high Open Interest.
As of this writing, the price of BTC stands at around $602,388, reflecting an almost 3% jump in the past 24 hours.
Many popular altcoins, including Ethereum (ETH), Ripple (XRP), and Solana (SOL), have declined by 5%-8% over the past day, in line with the broader market’s bearish conditions.
Four lesser-known tokens, however, experienced much more substantial losses, and the main culprit is Binance.
What Happened?
The world’s largest crypto exchange conducted yet another review of the digital assets listed on its platform to assess whether they meet industry requirements, including team commitment, level of development activity, trading volume, adequate liquidity, network stability, and more.
Following the analysis, it decided to terminate all services with Contentos (COS), Dar Open Network (D), Highstreet (HIGH), and MOBOX (MBOX). The delisting effort is scheduled for June 19, but the announcement has already caused a price collapse for the affected coins. All of them have plummeted by more than 25% daily, with COS the biggest loser, down around 31%.
COS Price, Source: CoinGecko
Such dramatic price swings shouldn’t be surprising, as losing support from a heavyweight like Binance typically results in thinner liquidity, reduced availability, and reputational damage.
A few weeks ago, the exchange said goodbye to Automata (ATA), Harvest Finance (FARM), Enzyme (MLN), Phoenix (PHB), and Syscoin (SYS), sparking similar price reactions.
Binance also removed the trading pairs AXL/BTC, CRV/BTC, EGLD/BTC, OPN/BNB, POL/ETH, QTUM/USDC, and SKY/BTC. However, the move didn’t trigger a massive price drop, as the termination of all trading services for those assets might have.
Additional Announcements
The company disclosed that it will support the NEAR Protocol (NEAR) network upgrade and hard fork. The development is scheduled for June 10 and will include a temporary suspension of token deposits and withdrawals on that blockchain.
Binance promised to handle all technical requirements involved for users, assuring that operations will be restored once the upgraded network is “deemed to be stable.” It also said that token trading will not be affected.
This is a standard procedure carried out multiple times in the past, and so far there haven’t been any reports of major complications. Towards the end of May, Binance briefly halted deposits and withdrawals on the Ethereum network to perform wallet maintenance. Prior to that, it implemented such measures to support improvements across other ecosystems, including Cardano and BNB Chain.
Charles Hoskinson raised the possibility of splitting Cardano after the collapse of one of its best-known ecosystem tools exposed a deeper fight over money, governance, and who has the power to keep builders alive on the network.
This week, the Cardano founder floated what he called a “nuclear option,” saying a new Cardano could be launched through proof of burn if the existing ecosystem cannot change how it funds and commercializes projects.
The statement came after TapTools, one of Cardano’s most widely used analytics and infrastructure platforms, said it would begin winding down operations over the next two weeks following leadership departures, mounting costs, and the loss of key technical capacity.
Hoskinson responded with a long, emotional address that turned a project closure into a broader indictment of Cardano’s governance and commercial strategy.
Hoskinson said TapTools’ closure was unlikely to be an isolated failure, saying:
This year is going to be very hard, especially the second half of the year for Cardano. We are probably going to see more dApps in DeFi die and a consolidation happen
The warning landed as Cardano’s DeFi economy remained small by broader crypto standards and under renewed strain.
DeFiLlama data showed about $115 million in total value locked on Cardano, with the network’s DeFi TVL down more than 5% over 24 hours. Cardano’s 24-hour DEX volume stood near $6.3 million, while its stablecoin market was roughly $55 million.
Those figures point to the commercial problem behind Hoskinson’s remarks. Cardano still has a large brand and a committed community, but the financial activity available to sustain infrastructure providers, exchanges, lending apps, and analytics platforms remains limited.
For teams that rely on subscriptions, API revenue, token activity, treasury funding, or outside investment, a thin market can quickly become an operating crisis.
Indeed, TapTools had framed its closure as the result of that pressure rather than a loss of belief in Cardano.
The platform said it had served more than 1 million users, supported hundreds of projects through its API, published hundreds of articles, and generated hundreds of millions of social impressions for Cardano builders.
However, the team said the departure of co-founders, including its chief technology officer and chief operating officer, had created a gap it could not quickly repair. A backend developer had stepped into the CTO role, but that replacement also decided to leave.
The company said it had tried to lower infrastructure costs, improve efficiency, and develop new products. Still, it concluded that it could not responsibly commit to the future without a credible acquisition path or fresh resources.
For Hoskinson, the announcement confirmed a problem he said had been visible for months. He said TapTools had been part of his daily routine and called its closure a loss for the broader ecosystem.
He also pointed to JPEG Store as another sign that older Cardano projects were struggling to survive the current cycle. He added:
I would suspect others are coming very soon. There’s going to be a wave of failures in the ecosystem.
Hoskinson’s central argument was that Cardano’s public market still treats him as the person responsible for the network’s direction, even though the formal powers needed to change that direction now sit elsewhere.
He said he does not control Cardano’s treasury, does not hold governance keys, cannot initiate a hard fork, cannot change protocol parameters, and does not own the Cardano trademark.
He said the resources created to grow and govern the ecosystem were assigned to separate entities rather than to him personally.
The comments cut into one of Cardano’s most sensitive political tensions. The network has spent years moving toward community governance, with delegated representatives, treasury rules, and other bodies taking on greater responsibility for funding and protocol decisions.
That structure limits founder control by design. It also means there is no single executive authority able to rescue struggling businesses, redirect treasury funds, or impose a commercial strategy when market conditions worsen.
Hoskinson said he had proposed multiple ways to prepare for that pressure, including a sovereign wealth fund, stablecoin reserves, an ecosystem index, and acquisitions of struggling infrastructure projects.
He argued those efforts were either rejected, delayed, or criticized by voters and community members who opposed spending treasury funds or feared centralization.
He noted:
There is a deranged psychopathy that has infected Cardano. You can see it at the bottom of each of my tweets. There are people whose only purpose now is to attack me. Every video I make, every tweet, every output, it is a growing chorus.
His frustration was aimed at that contradiction. When he tries to acquire or commercialize projects, he said critics accuse him of consolidating power. When he does not intervene, those same critics blame him for allowing builders to fail.
He stated:
You do not want commercialization, but then you punish everybody when commercialization does not occur. You say Cardano is not a ghost chain, but the things needed to prevent that, you do not care about.
The speech landed at a difficult moment for Cardano as the blockchain network’s ADA token fell below $0.20 for the first time in more than five years.
This extends a yearlong decline that has erased much of the token’s value and deepened pressure on builders whose businesses depend on user activity, treasury funding, or investor confidence.
Meanwhile, the decline has also sharpened the debate over whether Cardano’s governance system can fund growth quickly enough to keep pace with rival blockchain ecosystems.
According to Hoskinson:
Every person who has tried to use the treasury for commercialization gets attacked. Every program has to be pushed through with enormous effort to reach two-thirds voting, and most people do not have the political power, will or grit to get through that process.
For context, Cardano’s flagship 2026 Summit in Singapore was canceled after a treasury funding proposal failed to meet the two-thirds approval threshold required under the network’s governance rules.
Hoskinson argued that Cardano’s technology has continued to advance, citing expected work such as Leios. But he said technology alone would not be enough if the ecosystem could not fund businesses, support builders, and create incentives for commercial use.
His remarks were unusually blunt. He accused parts of the community of creating a hostile environment for builders and said some critics appeared more interested in proving Cardano had failed than helping the network recover.
According to him:
We as a community have to have a schism. We can no longer admit people whose only purpose is to burn the entire ecosystem down. It is the builders versus the non-builders, the doers versus the pessimists and cynics.
He said teams seeking treasury money or commercial support are often attacked before and after funding votes, making the system unattractive for serious operators.
A break raises the stakes
Hoskinson did not announce a formal exit from Cardano. His later post saying he was taking a break appeared to reflect exhaustion with the public fight rather than a resignation from the ecosystem.
Still, the timing amplified the message. A founder who remains Cardano’s most recognizable public advocate had just told the community that more projects may collapse, that he lacks the authority to stop it, and that the network must choose leadership, strategy, and funding mechanisms or risk managing decline.
Meanwhile, he pointed out that his “nuclear option” could be a way to separate builders from hostile critics and reset tokenomics and institutional funding.
He stated:
There are options. We could launch a new Cardano and have a proof of burn. That would be the most extreme option because those people would not migrate. They would be left behind in the environment they created, with no market, no volume and no commercialization. That is the nuclear option.
That suggestion reflected how far the conflict has moved from routine governance debate. Hoskinson’s complaint is no longer simply that voters rejected a proposal or that ADA’s price has fallen.
He argues that Cardano lacks an executive function capable of turning treasury resources, technical progress, and community support into a coordinated growth plan.
The consequences are now visible through business closures. TapTools said it remained open to acquisition or sustainable funding, but its shutdown notice gave Cardano a concrete example of what can happen when useful infrastructure cannot cover costs or retain key staff.
Considering this, Hoskinson told delegators to examine whether their DReps are helping the ecosystem grow or blocking the decisions needed to support builders.
He urged the community to take a week, study the failures, and decide whether it wants constitutional changes, treasury changes, executive changes, or even a more radical protocol path.
The $5 Billion Shadow: Inside the Zcash Orchard Exploit
Crypto Coin Show — Deep Dive
June 5, 2026
Breaking Investigation
The $5 Billion Shadow: Inside the Zcash Orchard Exploit
A four-year-old flaw, an AI-powered audit, an unverifiable crime scene — and the privacy coin that may never fully recover its credibility.
PUBLISHEDJune 5, 2026
CATEGORYSecurity / Privacy Coins
READ TIME~10 minutes
SOURCECrypto Coin Show Research
−50%
ZEC price crash in 24 hrs
$5B
Market cap wiped out
4 yrs
Flaw lived undetected
5 days
Discovery to full patch
The Day the Privacy Coin’s Promise Cracked
On the morning of June 5, 2026, Zcash founder Zooko Wilcox-O’Hearn published a disclosure that sent ZEC into freefall. A critical vulnerability had been living inside Zcash’s Orchard shielded pool since May 2022 — for nearly four years — surviving multiple rounds of scrutiny by some of the world’s most accomplished cryptographers. It took an AI model released the day before to finally find it.
The discovery, made by independent security researcher Taylor Hornby using Anthropic’s freshly-launched Claude Opus 4.8, exposed a flaw that could theoretically have allowed anyone with the knowledge to mint unlimited, undetectable counterfeit ZEC inside the Orchard pool. The token lost more than half its value within hours. Over $5 billion in market capitalization was gone by nightfall.
What followed was a crash course in one of crypto’s most uncomfortable truths: privacy and auditability are, at their core, in tension — and sometimes, that tension has a price.
“Zcash enables a unique class of bugs where if they’re exploited, no one would know. This unique class still exists. The fact that they fixed this specific bug is immaterial.”
— Udi Wertheimer, crypto commentator, via X
What Is the Orchard Pool?
To understand the exploit, you need to understand what Zcash’s Orchard pool actually is. Zcash launched in 2016 with an ambitious goal: give users Bitcoin-grade scarcity with true financial privacy. It does this through shielded pools — special transaction layers where balances and transaction data are cryptographically hidden from public view.
Orchard is the most recent and sophisticated of those pools, introduced with Network Upgrade 5 (NU5) in May 2022. It runs on the Halo2 proving system — a type of zero-knowledge proof (zk-SNARK) that was, at the time, considered a landmark achievement. Crucially, it eliminated the “trusted setup” that had long haunted Zcash’s earlier pools (Sprout and Sapling), where a group of participants had to collectively generate cryptographic parameters and destroy the toxic waste. If anyone kept that waste, they could have silently inflated the supply. Orchard removed that concern entirely.
By June 2026, the Orchard pool held over 4.5 million ZEC and had grown to become what the Zcash Foundation called “the centerpiece of Zcash’s privacy architecture.” It was the jewel of the network — and it had a crack running through it since day one.
Technical Explainer
What Is a Soundness Bug in a ZK Circuit?
Zcash transactions in the Orchard pool are verified using zero-knowledge proofs. Think of a ZK circuit as a mathematical rulebook: before a transaction is accepted, it must pass a series of checks that confirm the transaction is valid — without revealing any private details about who sent what to whom.
Soundness is the critical guarantee that the system only accepts genuinely valid transactions. If soundness is broken, an attacker can craft a proof that looks valid to the network but represents a fraudulent transaction — like forging a perfect fake passport that passes every border scanner.
The Orchard bug was exactly this: an under-constrained element in the Orchard Action circuit inside the halo2_gadgets crate. Specifically, the flaw sat in the elliptic curve multiplication verification process. An attacker could inject incorrect mathematical inputs that would still pass the verification check — allowing the creation of fraudulent proofs that the network would accept as genuine.
The result: unlimited counterfeit ZEC, invisible inside the shielded pool, with no on-chain trace.
How AI Found What Humans Missed
Shielded Labs, the independent nonprofit that funds Zcash’s development, had been thinking proactively about security heading into 2026. After a separate critical vulnerability in the older Sprout pool was patched in March 2026, the organization decided to go deeper. In April 2026, they hired Taylor Hornby — a respected independent security engineer — to conduct an ongoing, focused review of the protocol.
The timing of what happened next is almost poetic. On May 28, 2026, Anthropic released Claude Opus 4.8. On May 29 — the very next day — Hornby integrated the new model into a custom AI auditing agent framework and pointed it at the Orchard circuit.
By the end of that day, he had found the vulnerability. He didn’t just identify it theoretically — he built a complete working exploit and verified in a local test environment that it successfully generated unlimited counterfeit ZEC. The four-year-old hidden flaw had been exposed in less than 24 hours by an AI that hadn’t existed 48 hours earlier.
// Simplified conceptual representation of the soundness flaw
// Orchard Action circuit — halo2_gadgets crate
// The flaw: elliptic curve multiplication verification
// was under-constrained, allowing invalid inputs to pass.

fn verify_ec_mul(point: Point, scalar: Scalar) -> bool {
    // VULNERABLE: insufficient constraint on scalar range
    // Attacker could supply crafted scalar bypassing checks
    let result = ec_mul_unconstrained(point, scalar);
    verify_commitment(result) // returns true for forged proof
}

// What a valid implementation requires:
// 1. Constrain scalar to valid field range
// 2. Reject non-canonical encodings
// 3. Enforce range proofs on all private inputs
Hornby disclosed the vulnerability privately to Zooko Wilcox on May 29. The Zcash Open Development Lab (ZODL) immediately convened an emergency response team. The race was on to patch the network before the vulnerability became public knowledge — and before any malicious actor could exploit it.
The Five-Day Emergency
The response was coordinated and rapid. The Zcash Foundation deployed an emergency soft fork via Zebra 4.5.3, which effectively disabled the Orchard pool to stop any potential exploitation while the permanent fix was prepared. This caused brief but notable instability — block explorer delays of up to four hours and temporary confusion among users who couldn’t understand why Orchard transactions weren’t processing.
On June 1-2, the full fix landed: Zebra 5.0.0 activated the NU6.2 network upgrade, which re-enabled Orchard with a corrected circuit. The turnstile mechanism — Zcash’s built-in accounting system that tracks balance invariants across all value pools — confirmed that the total ZEC supply cap remained intact throughout the entire incident. No value had left the supply bounds.
The successful activation of NU6.2 on June 3 marked only the second security-driven protocol upgrade in Zcash’s history since its 2016 launch — a testament to how seriously the team took the threat.
Then, on June 5, Zooko published the full disclosure publicly. And the market had its say.
“The Holy Trinity is dead. While I think it’s extremely unlikely that any minting occurred, it cannot be formally cryptographically proved impossible. The privacy-from-AI, privacy-from-government narrative demands perfection.”
— Arthur Hayes, BitMEX founder, announcing full ZEC exit via X
The Unanswerable Question
The patch worked. The supply cap held. The team moved fast. By every technical measure, the response to this crisis was competent — arguably exemplary. And yet ZEC lost half its value.
The reason is a single, devastating sentence from Shielded Labs’ official disclosure:
“Due to the privacy properties of Orchard and the nature of the bug, there is no definitive way to determine, using only cryptography, whether such exploitation occurred.”
This is the paradox at the heart of privacy coins. The very feature that makes Zcash valuable — the fact that transactions inside the Orchard pool are completely shielded — is the same feature that makes it impossible to audit whether the exploit was ever used. With Bitcoin, any inflation event would be immediately visible on-chain. With Zcash’s Orchard pool, an attacker could theoretically have minted counterfeit coins in complete silence.
Shielded Labs argues exploitation was unlikely for three reasons: the vulnerability required deep knowledge of the Orchard circuit that even most security professionals didn’t have; multiple prior audits by top cryptographers never found it; and any attacker who had found it and chosen not to drain the pool during a historic bull run — when ZEC was above $600 — would have behaved very unusually.
Grayscale’s chief legal officer Craig Salm agreed: “To believe the vulnerability was actually exploited, someone would have had to examine the codebase more thoroughly than all core developers combined, and then resisted the urge to drain the entire pool during a historical bull run. Seems unlikely to me.”
Not everyone was convinced. Arthur Hayes publicly dumped his entire ZEC position, citing exactly the impossibility of proof. When you’re selling a narrative about protecting assets from surveillance and government overreach, “probably fine” isn’t a good enough answer.
The Road Back: Shielded Labs’ Proposal
Shielded Labs didn’t just patch the bug and go quiet. The organization announced it is actively exploring a proposed Network Upgrade designed to address the fundamental auditability problem — not just this specific flaw.
The proposal centers on a new, isolated shielded pool. Users would migrate their Orchard assets through a cryptographic “turnstile” mechanism that would mathematically prove, on-chain, that no counterfeit supply inflation occurred. The proposal would essentially force every coin in the old Orchard pool to prove its legitimacy before entering the new pool — creating a verifiable clean slate.
The team also committed to formal verification of the Orchard circuit going forward (using mathematical proof tools to guarantee no constraint violations exist) and bringing in additional external security experts. The March 2026 Sprout pool patch followed by this Orchard incident has created what BitMEX Research called “a pattern of latent vulnerabilities in ZK-proof circuits” — a pattern the team clearly wants to break.
Shielded Labs promised a detailed upgrade proposal in the week following the disclosure. Any supply-proof mechanism must still clear Zcash’s governance process, which involves community signaling and miner/validator adoption. Given the market’s reaction, the pressure to deliver is immense.
What This Means for Privacy Coins
The incident has reignited a fundamental debate about ZK-proof based privacy systems. Critics argue this isn’t just a Zcash bug — it’s a structural risk unique to privacy-preserving blockchains. The more complex and private the cryptography, the harder it is to verify, and the more devastating a soundness bug becomes.
Monero, Zcash’s main privacy-coin competitor, uses a different approach — ring signatures and stealth addresses rather than ZK proofs — and its simpler architecture was widely cited during the ZEC crash as a source of comparative comfort. Capital rotation into XMR was speculated during the worst of the sell-off.
The incident also marks a watershed moment for AI-assisted security research. Opus 4.8 found in hours what years of human expert review had missed. That’s an extraordinary capability — but it cuts both ways. The question the market is now asking isn’t just “was this bug exploited?” It’s: “If AI can now find ZK vulnerabilities this efficiently, what else is still in there — and who finds it next?”
For holders and investors, the immediate technical risk has been resolved. The supply cap is intact. The patch is live. But the confidence question — whether Zcash’s privacy-first architecture is compatible with the level of auditability that institutional investors now demand — remains wide open.
That’s not a question a hard fork can answer.
Complete Timeline of the Crisis
May 2022
Orchard pool activates with NU5 upgrade. Built on Halo2 — the first Zcash pool with no trusted setup. The soundness bug enters the codebase silently.
2022–2026
Multiple independent audits by top cryptography firms review the Orchard circuit. None detect the under-constrained elliptic curve element.
March 2026
Separate Sprout pool bug patched via zcashd v6.12.0. ZEC jumps 10%. Shielded Labs decides to commission a deeper protocol security review.
April 2026
Taylor Hornby hired by Shielded Labs to conduct ongoing protocol-level security research, specifically tasked with finding deep vulnerabilities before attackers do.
May 28, 2026
Anthropic releases Claude Opus 4.8. Hornby immediately begins integrating it into a custom AI auditing agent framework for ZK-circuit analysis.
May 29, 2026
Vulnerability discovered. Hornby’s AI-assisted audit identifies the soundness flaw in the Orchard Action circuit. He builds a complete working exploit, generating unlimited counterfeit ZEC in local testing. Privately disclosed to Zooko Wilcox same day.
May 30–31, 2026
ZODL emergency response. Zcash Open Development Lab coordinates a rapid remediation team. Zebra 4.5.3 deployed as emergency soft fork, temporarily disabling Orchard transactions. Brief network instability; block explorer delays up to 4 hours.
June 1–3, 2026
NU6.2 hard fork activates via Zebra 5.0.0. Orchard re-enabled with corrected circuit. Zcash Foundation confirms total ZEC supply cap confirmed intact throughout incident. Second-ever security-driven protocol upgrade in Zcash history.
June 5, 2026
Full public disclosure. Zooko Wilcox posts detailed account on X. Shielded Labs publishes technical report. Market reacts immediately — ZEC falls from ~$635 to a low of ~$309. Arthur Hayes announces full exit. Over $5 billion in market cap erased within 24 hours.
Coming — TBA
Shielded Labs Network Upgrade proposal expected. New isolated shielded pool with cryptographic turnstile to allow supply integrity verification. Formal circuit verification and expanded security audits planned. Governance process begins.
How to Spot a Fragile Token Launch Before You Buy In — Blockchain Interviews
Blockchain Interviews · Investor Guide
How to spot a fragile token launch before you buy in
By Ashton Addison · CryptoCoinShow · Based on our interview with Scott Byron, Managing Director at Forgd
Most retail traders learn about liquidity the hard way — watching a token crater in the first hour and wondering what they missed. The signals were there. They just didn’t know what to look for.
Token launches fail at a startling rate, and the common narrative blames the project, the market timing, or bad luck. But after working with over 500 token launches and tracking data across 35+ market-making firms, the team at Forgd has a different conclusion: most launch failures are structural, and most of them are visible in advance — if you know where to look.
Scott Byron, Managing Director at Forgd, joined Ashton Addison on Blockchain Interviews to walk through exactly this. What follows is a practical breakdown of the warning signs retail traders can use before committing capital to a new token launch.
Why launch day is already too late to diagnose the problem
The decisions that determine whether a launch succeeds are made months before the token ever hits an exchange. Market maker selection, vesting schedule structure, exchange listing strategy, liquidity depth — all of it gets locked in during the lead-up period. By the time a token goes live, the foundation is either solid or it isn’t.
“Once you see fragile liquidity on day one, recovery is almost impossible. The narrative breaks, the community loses confidence, and the market maker has little incentive to defend a price that’s already under pressure.”
Scott Byron, Managing Director, Forgd
This is why retail traders who wait for launch day to evaluate a project are often evaluating the aftermath of decisions that were already made. The better question is: what does the pre-launch setup tell you?
The red flags worth watching before you buy
1. Thin or missing order book depth
One of the clearest early signals is the order book itself. A well-supported launch will show meaningful bid depth within 1–2% of the current price on both sides. When you see a wide spread, steep drop-off just below the current price, or almost no visible bids, that’s a sign the market maker either isn’t active or is providing minimal support.
This isn’t just a cosmetic issue. Thin order books mean small sell orders can move price dramatically — which triggers stop-losses, creates panic, and accelerates the kind of cascade that turns a soft open into a collapse. Forgd’s data across hundreds of launches shows this pattern repeating constantly.
2. Only on a DEX, or only on a CEX
Exchange listing strategy is something most retail traders overlook entirely, but it’s a meaningful signal. A legitimate, well-funded launch should have presence on both centralized exchanges (CEXes) and decentralized exchanges (DEXes) — they serve different audiences and require different liquidity approaches.
A project that launches exclusively on a DEX may be doing so because it couldn’t secure a CEX listing, which raises questions about vetting and credibility. A project that launches only on a CEX may be avoiding the on-chain transparency that DEX trading provides. The strongest launches cover both, and they do it intentionally — CEXes bring volume and distribution, DEXes attract the protocol-native audience most likely to become long-term holders.
Geography matters too. A project skipping Asian exchange listings is deliberately cutting off a major portion of the buyer base. That either reflects poor planning or a very narrow target market — neither is a great sign.
For founders navigating this themselves, Forgd’s Exchange and Listing Research tool makes this data publicly accessible for the first time. It provides visibility on listing fees, security deposits, historical listing performance, and due diligence questionnaire requirements across top-tier CEXes including Binance, OKX, Bybit, Coinbase, and KuCoin — information that was previously only available through backchannels and relationships. For a retail trader, seeing that a project chose exchanges well-suited to their profile and FDV is itself a green flag. It suggests the team did the homework.
3. A vesting schedule that puts pressure on price immediately
Vesting schedules and token unlock timelines are public information on most launches, but few retail traders actually model out what they mean for circulating supply in the first 30, 60, and 90 days. This is worth doing.
Aggressive early unlocks — especially for team, advisor, or early investor allocations — create natural selling pressure right when the project needs price stability most. When those unlocks hit at the same time a market maker’s initial commitment period ends, the combination can be toxic. Byron describes this as one of the most common structural failures Forgd encounters: teams that didn’t think through the timing interaction between their vesting cliffs and their liquidity support schedule.
This is another area where Forgd has built a free tool that benefits both founders and informed investors. The Tokenomics Research tool lets you model token distributions, emission schedules, and demand drivers, then run price discovery simulations to stress-test how a given supply structure holds up at launch. For a retail trader, it’s worth cross-referencing any project’s published tokenomics against what well-structured launches actually look like — the difference is usually visible immediately.
Quick-check: 5 things to verify before a token launch
Order book depth within 1–2% of price on both sides at open — is there meaningful bid support, or does it fall off a cliff?
Is the token listed on both a CEX and a DEX? Single-venue launches warrant closer scrutiny. Use Forgd’s Exchange Research tool to check if the chosen exchanges match the project’s FDV and profile.
Check the vesting schedule — when do team, advisor, and early investor unlocks hit relative to launch? Use Forgd’s Tokenomics Research tool to benchmark the supply structure against well-performing launches.
Is there a named, verifiable market maker? Projects that can’t or won’t disclose this are hiding something.
What does post-launch trading volume look like after hour 1? Sustained volume is a good sign. A spike followed by a cliff is not.
The market maker question most investors never ask
One of the most underappreciated signals in a token launch is whether the project can tell you who their market maker is — and whether that firm has a verifiable track record.
The market making industry for crypto tokens has historically operated with almost no transparency. There are 30+ firms active in this space, operating under two primary engagement structures: a loan model, where the market maker borrows tokens and uses them to provide liquidity in exchange for an option at a fixed price, and a retainer model, where the project pays a monthly fee for ongoing liquidity services. Each structure creates different incentives, and understanding which one a project is using tells you a lot about whether the market maker’s interests are aligned with long-term price stability.
Forgd built its market maker leaderboard specifically because this data didn’t exist anywhere. Founders were choosing market makers based on reputation and relationships rather than actual performance data — and retail traders had no way to evaluate quality at all. The leaderboard, available at forgd.com, tracks performance across firms and gives both founders and informed investors a benchmark.
What good liquidity actually looks like
It’s worth being specific about what you’re looking for as a positive signal, not just what to avoid. A well-supported launch tends to show consistent spreads through the first few hours of trading, not dramatic swings. Volume stays relatively stable rather than spiking on open and then disappearing. The price may move, but it moves in both directions — evidence that the order book is active and that there’s genuine two-sided interest.
Projects that have done the work tend to want to show it. If a team is transparent about their market maker, has published their vesting schedule, and is listed on multiple quality exchanges, those aren’t just checkboxes — they’re signals that someone planned this out. That doesn’t guarantee success, but it eliminates a category of failure that takes down a surprising number of launches that otherwise had strong fundamentals.
“The projects that succeed in 2026 are the ones that treat the capital markets side of their launch with the same rigor they apply to the product. Most still don’t.”
Scott Byron, Managing Director, Forgd
The shift Forgd is trying to accelerate is a move from reputation-based decision making to data-based decision making — on both sides of the table. Founders picking market makers with better information. Retail traders evaluating launches with a clearer framework. The more that happens, the fewer entirely preventable launch failures there are.
For retail traders, the practical takeaway is simple: the information you need to make a better call is almost always available before you buy. You just have to know what you’re looking at.
Full Interview
🎙 Blockchain Interviews
Scott Byron, Managing Director at Forgd
Scott joined Ashton Addison to go deep on why token launches fail, how market making works under the hood, and what retail traders and founders can do differently. Click any timestamp to jump to that moment.
00:00Introduction: Scott Byron, Managing Director at Forgd
01:22What Forgd is and the problem it was built to solve
03:33Why market maker data has been a black box and what Forgd actually tracks
06:42The two market maker engagement structures every investor should understand
10:16Why 2025 was the most brutal year for altcoin launches in recent memory
14:05Why failed launches almost never recover and what triggers the collapse
17:18Vesting schedules, cliffs, and what they mean for your buy timing
21:35How to spot fragile liquidity in the first minutes after launch
27:20CEX vs DEX: why choosing one over the other is the wrong move
34:24What it actually takes to succeed in the 2026 market
38:09How to access Forgd’s market maker leaderboard at forgd.com
Ripple’s global payments narrative may be gaining fresh momentum as one of its key partners, Thunes, unveils a new development that could further strengthen cross-border settlement infrastructure. As the demand for faster, cheaper, and more efficient international payments continues to rise, strategic partnerships like Thunes play a crucial role in expanding real-world utility across the XRP ecosystem.
Thunes Expands Its Role In The Global Payments Ecosystem
A recent announcement from Thunes could significantly strengthen XRP’s position in the global payments landscape. Analyst XFinanceBull on X has revealed that the company has officially launched real-time payment capabilities in the United States through a direct connection with a Tier 1 financial institution, enabling access to ACH, Same-Day ACH, and all real-time payment rails.
The development comes as Thunes continues to strengthen its international footprint. Thunes holds 50 Money Transmitter Licenses, allowing it to operate across every US state and territory, mirroring Ripple’s regulatory reach. Both companies now independently have institutional-grade access to US clearing systems.
Thunes network already spans 140 countries, supports 90 currencies, and connects to more than 12 billion mobile wallets, stablecoin wallets, and bank account endpoints. Following its expanded partnership with Ripple in September 2025, Thunes integrated blockchain and digital asset technology into its direct global network, leveraging Ripple payments to enhance its SmartX Treasury System.
Meanwhile, Thunes has plugged real-time US settlement into the same network that uses the Ripple blockchain payments infrastructure and XRP as a bridge asset. Over 140 countries can now send money to the US through rails connected to Ripple technology.
Ripple payments have near-global coverage with over 90 payout markets processing more than $70 billion in volume. This integration gives XRP a direct pathway into Tier 1 US banking through a partner that holds licenses in every state.
Institutional Interest Fuels XRP Ledger’s Next Phase Of Growth
The XRP Ledger real-world asset (RWA) ecosystem officially surpassed $3 billion in tokenized value in April. According to an analyst known as BankXRP on X, the incredible insights shared by Luke Judges, Partner Director at RippleX, at Istanbul Blockchain Week, break down exactly where the momentum is heading for real-world asset tokenization. Furthermore, the $3 billion milestone is driven by a highly diversified mix of assets, underscoring Ledger’s expanding institutional utility across multiple segments of finance.
Looking ahead, the next big wave of growth is expected to center around cash and cash-equivalent assets. Money market funds and US Treasury bills, alongside tokenized equities, are being viewed as prime targets for infrastructure disruption. The broader vision is moving toward a globally distributed financial system where regulated assets can trade seamlessly across asset classes through a unified order book.
Bitcoin (BTC) dropped below $62,000 on June 4, with the move coinciding with the first meaningful pullback in the flagship cryptocurrency’s dominance in nearly eight months, according to analyst CrediBULL Crypto.
This has prompted several observers to revisit the possibility of an altcoin-led market phase, as the assets have shown unusual resilience during BTC’s decline, a pattern that in the past appeared near major turning points in crypto market cycles.
What the Charts Are Showing
According to CrediBULL, the largest altcoin rally of the 2017 cycle started only after Bitcoin had already fallen 50% from its peak, stabilized, and then set off on a recovery run. That’s when the altcoin market cap tripled off the lows and pushed to new all-time highs.
They believe a similar setup may be developing now with BTC trading more than 50% below the all-time high it set in October 2025, and many altcoins having avoided the type of collapse seen in past bear markets.
“Many are noticing the relative strength in alts at these levels as BTC melts but many alts hold relatively ‘steady,’ sending BTC dominance down in the first significant pullback on BTC dom that we have had in nearly 8 months,” he wrote.
In a follow-up exchange, the analyst suggested there could be a series of “mini altseasons” leading up to a larger one that would arrive after a Bitcoin blow-off top that hasn’t happened yet.
There was a similar assessment of the market earlier this week from another analyst, Sykodelic, who described it as “an exhausted market in which alts are no longer responding to weakness.” They also noted that the OTHERS.D chart had closed above its 200-day moving average, a level that helped spark outsized moves in smaller tokens in the past.
However, Daan Crypto Trades offered a more cautious read, saying that the total altcoin market cap excluding stablecoins has been range-bound for more than 2 years, and the recent strength in the category that everyone has been talking about has mostly been carried by a handful of tokens.
“For this to properly bounce, you’d need more life out of the likes of ETH and other majors,” he stated.
Indeed, ETH just touched a 14-month low near $1,700, with others in the top 10 losing between 8% and 4% in the last 24 hours. Across seven days, only Hyperliquid’s HYPE token held up, gaining over 18% in that period while every other cryptocurrency with an 11-figure market cap and above faltered badly.
What of Bitcoin?
At the time of writing, BTC itself was down nearly 7% in one day and over 13% in the past week. It was trading at around 500 bucks below $63,000, having earlier fallen to a four-month low of about $61,000.
The move wiped out more than 270,000 leveraged traders in 24 hours, with more than $1.6 billion in total liquidations, a majority of which were long positions. And the situation is just as bad around spot Bitcoin ETFs, which have already seen $1.4 billion in outflows in the first three days of June, per data from SoSoValue.