The United States is worried that China has its hands on advanced chip-making machines, sent to them by ASML.
Howard Lutnick, the US Commerce Secretary, reportedly sat down with ASML executives several times to share his fear that an extreme ultraviolet (EUV) lithography machine had somehow landed in Chinese hands. Such a move would break US export rules, which forbid sending ASML’s EUV machines to restricted places like China.
The fact that Lutnick raised this shows Washington has not let its guard down on sensitive tech sales to China, even as President Donald Trump has recently loosened some chip export limits there.
Bloomberg broke the story first, noting that the White House gave reporters no evidence to back up Lutnick’s private remarks.
ASML pushed back on Friday, stating it had “never shipped an EUV machine to China, nor have we shipped to China any component, module, or equipment specially designed to be used in an EUV machine.”
The Dutch government told Reuters it strictly applies its licensing rules to chip-making “equipment, components and technology that explicitly fall under these rules.”
EUV weighs 180 metric tonnes and is as huge as a school bus. TSMC uses this machine for the production of chips used by US top companies like Nvidia. This is why China stays a step back in reaching the level of US chipmakers. However, it was also reported last year that China is attempting to make its own EUV.
That report by Reuters said that it was former ASML engineer working on the prototype for China, country’s own Manhattan Project as reported by Cryptopolitan previously.
U.S has kept a close watch on ASML
The U.S. is also wary of ASML’s maintenance agreements there and has raised questions about its sale of deep ultraviolet (DUV) systems to Chinese buyers, a business that makes up as much as a fifth of the firm’s total revenue.
In April, US lawmakers proposed a bill that would push American allies to match Washington’s stricter export controls, naming ASML directly in the draft legislation.
ASML responded by saying it understood the national security reasoning behind rules in both the US and the Netherlands and remained fully committed to following them.
On the other hand, Trump has eased up on some tech export limits toward China. Nvidia received approval in January to sell its H200 AI chips there, and last month, ten Chinese companies were cleared as buyers. Still, Beijing has been encouraging its tech industry to choose domestically made chips instead.
A seperate worry is brewing across the Atlantic
A speculative essay titled Europe 2031, written by a group of Brussels-based researchers, pictures a future where the US and China leave Europe behind because it failed to invest in datacentres, robotics, and homegrown AI.
The piece appeared just one day before the Trump administration reportedly moved to block “foreign nationals” from accessing an AI model called Fable, built by Anthropic.
The essay spread quickly during a week of G7 meetings, fueling talk about the need for Europe to build its own tech independence. Its writers say they feel “vindicated,” partly because one of their predictions, that the US would limit global access to advanced AI systems, briefly came true.
The essay is part of a wider trend of speculative AI scenarios that have drawn attention from officials, including a 2025 piece called AI 2027 that was reportedly read by US Vice President JD Vance.
U.S faces growing data center criticism
Back home, US opposition to data centers has been growing quickly, moving from local complaints into broader fights over land use and resources. Monterey Park, California, became the first US city to permanently ban large data centers this month after residents voted strongly in favor.
New York lawmakers passed a one-year halt on new large-scale data center projects. As of June, fourteen states have weighed similar restrictions, according to the Rockefeller Institute of Government, as officials in Washington increasingly view advanced AI systems as strategic national assets.
Robert Kiyosaki says he is watching gold, silver, Bitcoin (BTC), and Ethereum (ETH) for a technical reversal before buying, arguing that the macro backdrop, not falling prices, decides whether hard assets are worth holding.
Precious metals extended a steep retreat this week, and a fresh dispute over the Strait of Hormuz tested a days-old US-Iran ceasefire. BTC and ETH edged higher over 24 hours.
Bitcoin and Ethereum Prices After Reported Strait Closure. Source: Coingecko
Kiyosaki Watches Gold and Silver Context, Not Price
Kiyosaki built his case around the environment rather than the chart. The Rich Dad Poor Dad author said a falling market alone never tells him whether to buy or sell.
He pointed to whether political and banking leaders are fixing the economy or making it worse, and has called dips buying opportunities before.
“I have learned to understand the ‘context’ or the environment the asset is in….not the price… So I am watching prices of gold, silver, Bitcoin, and Ethereum on technical charts and will buy when prices reverse their decline,” Kiyosaki wrote in a post.
The metals he is eyeing set records before the pullback. Gold hit an all-time high near $5,595 an ounce in late January and silver topped $100 for the first time.
Both records capped a run nearly doubling gold and quadrupling silver in a year.
This week’s ceasefire then drained the safe-haven premium the February war and Hormuz threats had rebuilt.
Kiyosaki keeps backing silver and Bitcoin and claims the charts point to a rebound, with no price target or timeline.
Hormuz Dispute Keeps the Safe-Haven Bid Alive
The backdrop Kiyosaki described stayed unsettled. Iran’s Revolutionary Guard declared the Strait of Hormuz closed over alleged ceasefire violations and warned vessels away.
Vice President JD Vance countered that no evidence backed the claim. Vance said the waterway stayed open, and CENTCOM reported 55 ships moving more than 17 million barrels of oil through Hormuz on Saturday.
That is close to the 20 million a day, about a fifth of global oil demand, the EIA says the strait normally carries.
Bitcoin traded above $64,000, up about 1.4%, while ETH held near $1,740, with both gains following developments at the Strait of Hormuz.
Even so, BTC sits roughly 49% below its October record near $126,000 and ETH about 65% under its August peak, with BTC down about 17% and ETH 18% over the past month.
Earlier Hormuz tensions dragged Bitcoin lower, and a US strike on Iran under the truce sent Bitcoin, gold, and oil moving within hours.
With US-Iran talks set for Switzerland on Sunday, the next signal is whether the ceasefire holds. For Kiyosaki, the charts rather than the headlines will decide his next move.
Bitcoin’s blockchain is showing its strongest activity since late 2024, creating a rare split between rising network use and a weakening market price.
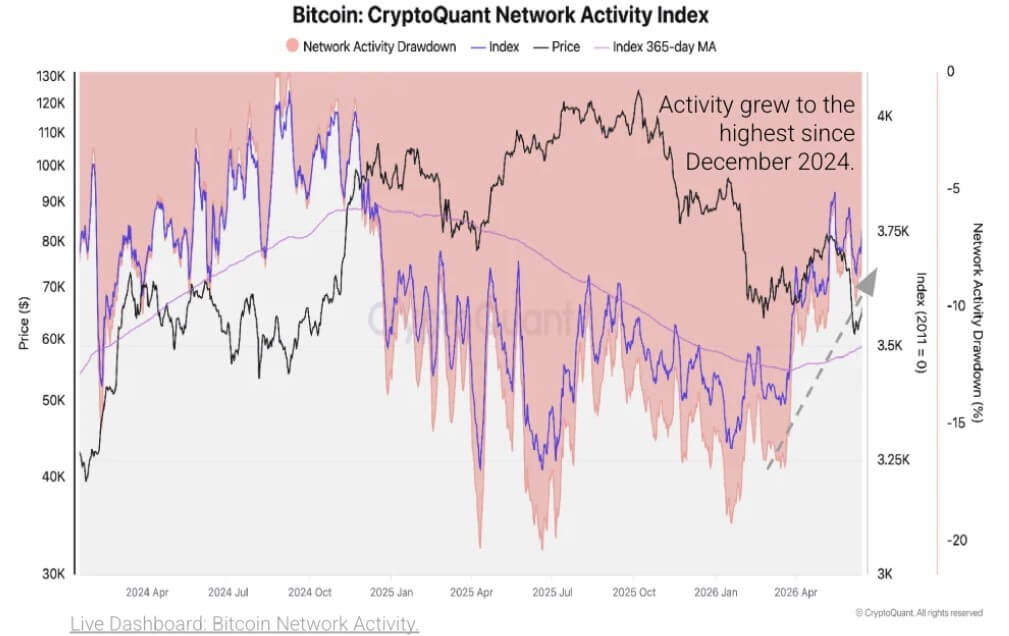
CryptoQuant said in a note shared with CryptoSlate that its Bitcoin Network Activity Index has moved above its long-term trend for the first time since mid-2024.
The index has climbed steadily since January and recently reached its highest level since late 2024, leaving it only about 7% below the record reached in September 2024.
Bitcoin Network Activity (Source: CryptoQuant)
The shift began in late March and has held for several weeks, suggesting that the rebound in activity is more than a one-day spike.
Meanwhile, the rise in network activity comes as the Bitcoin price remains under significant selling pressure.
The largest cryptocurrency has fallen about 30% this year to below $65,000, according to CryptoSlate data, extending a slide of more than 50% from its late-2025 record near $126,000 as months of selling pressure and weaker risk appetite weigh on the market.
Small transfers drive the rebound
The network rebound is being driven mainly by transaction counts rather than large-value settlement.
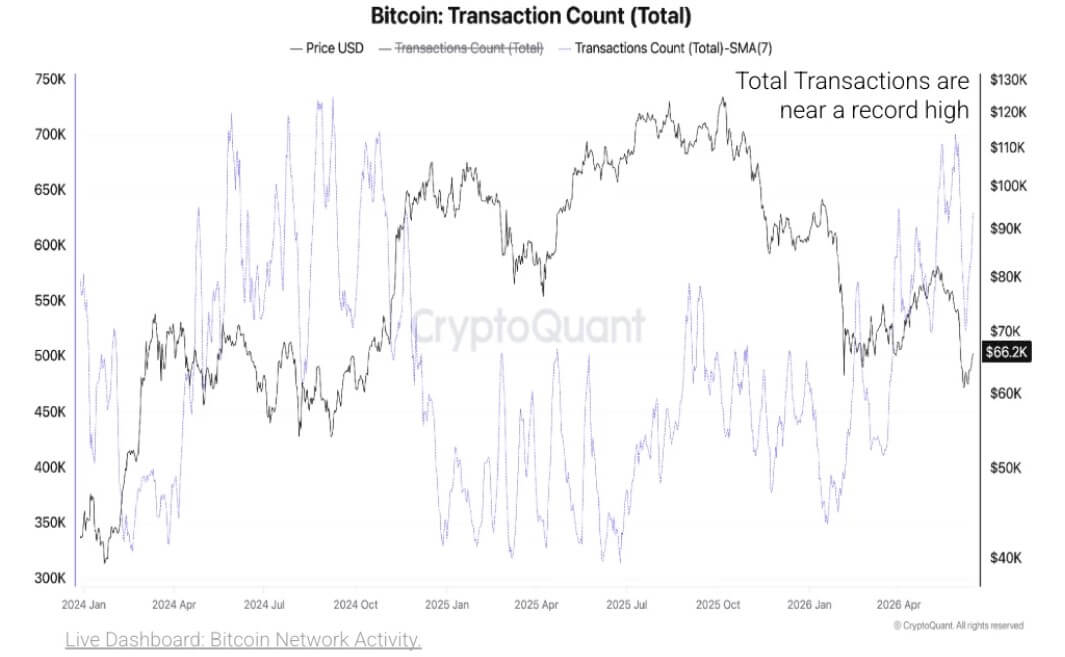
CryptoQuant data shows total daily Bitcoin transactions rising above 800,000 at points in 2026, near the strongest readings of the 2023-2025 cycle and more than double the lows seen in 2025. Average transactions per block have also climbed, showing sustained block use from a transaction-count perspective.
The composition of that activity is the more important part of the story.
Transactions worth less than 0.01 BTC now account for about 80% of daily Bitcoin transaction counts, CryptoQuant said. That is up from roughly 44% in 2023.
Bitcoin Total Transactions (Source: CryptoQuant)
The smallest cohorts, including transactions below 0.001 BTC and below 0.01 BTC, have surged this year and are approaching the previous peak reached in 2024.
That means Bitcoin’s network is busier, but much of the growth is coming from very small transfers. In market terms, the blockchain is processing more messages, but not necessarily moving proportionally more economic value.
The pattern resembles prior bursts of protocol-driven activity on Bitcoin, when token experiments, inscriptions, and data services increased transaction counts without matching the value profile of traditional BTC transfers.
OP_RETURN use points to data-heavy demand
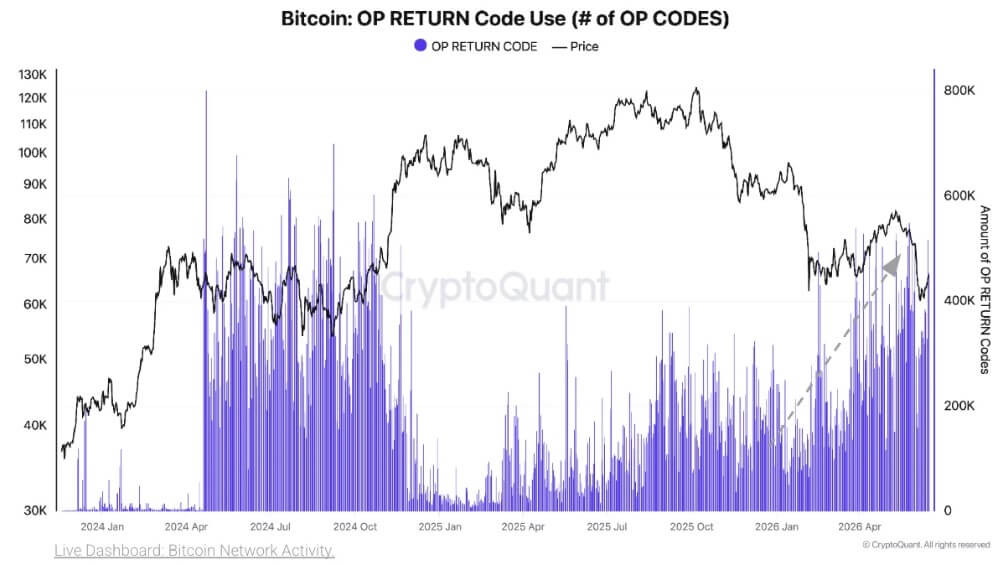
The rise in small transfers has coincided with a sharp increase in OP_RETURN usage.
OP_RETURN is used to attach data to Bitcoin transactions without creating spendable outputs. That has made it a common tool for data-layer activity on Bitcoin, including token-related transfers, timestamping, and inscription-adjacent use cases.
CryptoQuant said OP_RETURN outputs have climbed to near-record levels this year, with the increase linked to activity from Runes, Ordinals, BRC-20-style markets, and other data-writing services.
Bitcoin OP_RETURN Code Use (Source: CryptoQuant)
These systems can generate large numbers of low-value transactions because the economic payload is often the data attached to the transaction rather than the amount of BTC being transferred.
That helps explain why the network activity index is rising while the price remains weak. The new activity reflects demand for Bitcoin block space, but it is not the same thing as a broad recovery in investor appetite for BTC.
It also complicates the long-running debate over Bitcoin’s use case. Supporters may view the surge as evidence that Bitcoin is becoming a more active settlement layer for new types of on-chain activity.
However, critics may see it as congestion from transactions that do little to support Bitcoin’s monetary role.
For now, the data supports both readings to some degree. Bitcoin is being used more. But the use is concentrated in small transactions that differ from the financial transfers many investors associate with durable network demand.
Mempool congestion returns, but fees stay low
The jump in micro-transactions has started to affect the mempool, where unconfirmed Bitcoin transactions wait before being added to blocks.
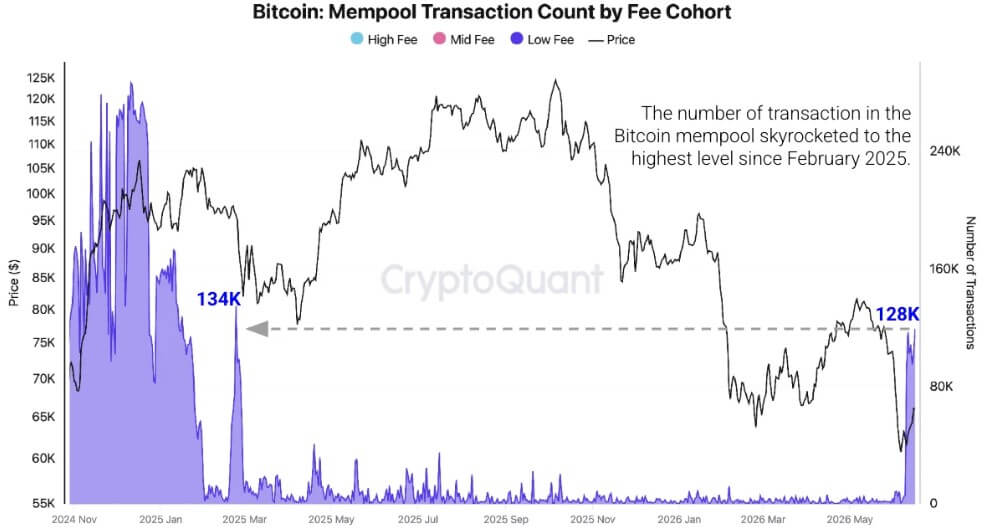
CryptoQuant said the Bitcoin mempool transaction count has risen to about 128,000, the highest since late February 2025. The congestion is concentrated in low-fee transactions, consistent with the increase in OP_RETURN and micro-transaction activity.
The current backlog remains well below the extreme peaks seen in September 2023 and November 2024. Still, the increase shows that non-financial or low-value activity is taking up a larger share of Bitcoin transaction flow.
That could become more important if the trend continues. Higher competition for block space can push up fees, especially for users who need time-sensitive settlement.
In past cycles, congestion from inscriptions and token-related activity created brief periods of elevated fees and renewed debate over whether Bitcoin’s block space should be used primarily for monetary transfers or broader data applications.
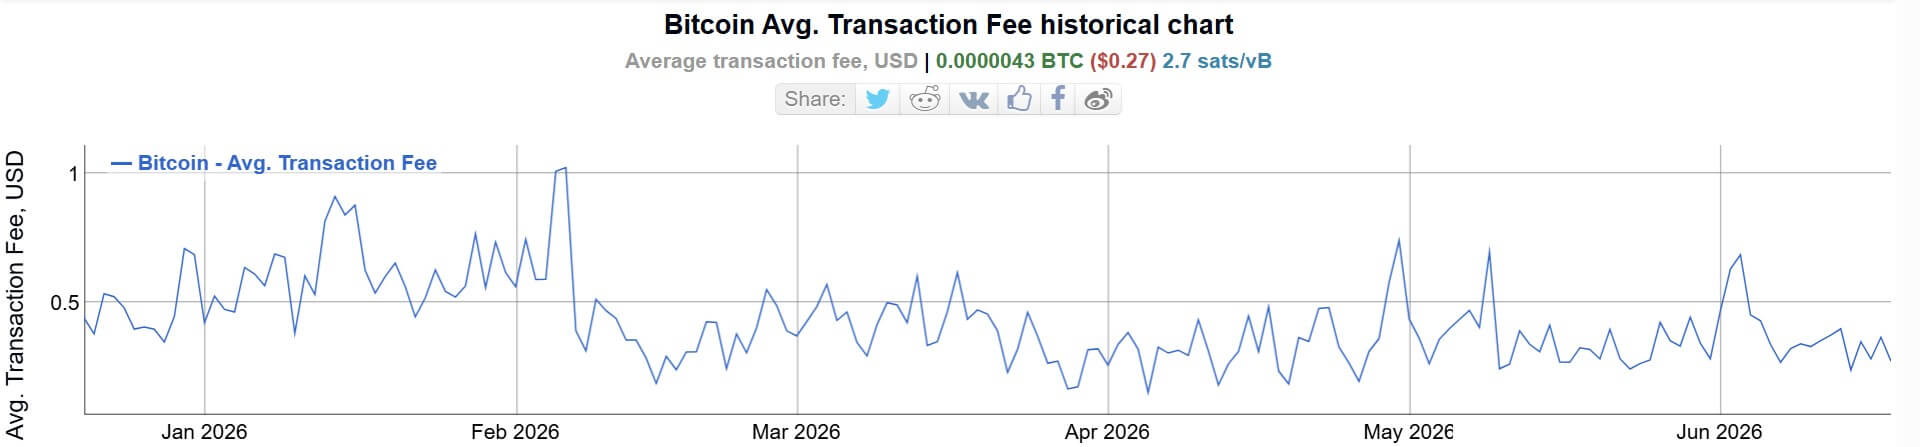
So far, the latest activity burst has not produced a comparable fee boom.
YCharts data, based on Blockchain.com figures, showed daily Bitcoin transaction fees at 3.458 BTC on June 18, down 50.25% from a year earlier.
Bitcoin Average Network Fees (Source: BitInfoCharts)
That gap is central to the current story. Transaction counts are rising, but the fee market has not followed with the same force.
Miner revenue remains the weak link
The muted fee response matters because Bitcoin miners have relied more heavily on transaction fees since the April 2024 halving cut the block subsidy to 3.125 BTC.
At roughly 144 blocks a day, the subsidy remains the main source of miner revenue. Fees contribute only a small share in BTC terms when network costs are low, limiting the direct financial benefit miners receive from higher transaction counts.
That makes the current activity surge less straightforward than prior periods when congestion produced large fee spikes. More transactions can signal stronger demand for block space, but if those transactions are low-value and low-fee, the impact on miner economics remains limited.
The result is a mixed signal for the Bitcoin market.
On one hand, the blockchain is seeing its strongest activity in nearly two years, driven by real demand for small transactions and data-linked use cases.
On the other hand, Bitcoin’s price remains under pressure, sellers still dominate the short-term market structure, and the fee market has not shown that users are willing to pay significantly more for settlement.
That leaves Bitcoin with a busy network but an unresolved market question: whether this new wave of activity can become durable economic demand, or whether it remains another burst of low-value traffic that fills blocks without changing the broader investment picture.
Three altcoins are trading within striking distance of their record highs as the weekend begins. Rain (RAIN), Hyperliquid (HYPE), and ADI each sit close enough that one strong push could deliver a fresh all-time high (ATH).
Each token tells a slightly different story. RAIN is retesting its peak after a shallow dip, while HYPE and ADI recover from deeper corrections. The setups vary in strength, and the technical levels below explain why.
Rain (RAIN) Sits Less Than 3% From Its Record
Rain Protocol (RAIN) is the closest of the three to a breakout. The token trades near $0.0144, about 2.4% below its all-time high of $0.0148 set on May 27.
The recent correction was shallow. Price held the 0.786 reversed Fibonacci level and bottomed near $0.0125 before turning higher. RAI is now pressing directly into prior resistance.
A clean break opens the 1.272 Fibonacci extension near $0.0173 as the first target. The 1.618 extension near $0.020 marks the second. On the downside, the 0.618 reversed Fib level near $0.012 should act as support.
Fundamentals add weight to the setup. Rain recently entered the top three prediction markets by value locked, helped by fresh liquidity ahead of the 2026 FIFA World Cup. That demand could fuel the final move toward records.
Hyperliquid (HYPE) Holds Above $63 in Price Discovery
Hyperliquid (HYPE) remains in price discovery despite a pullback. The token trades near $66.70, roughly 13% under its record high of $76.70 printed on June 16.
So far, the dip has held above the 0.236 Fib retracement near $63.66. A standard continuation correction would target the 0.382 level near $55.40, which lines up closely with the previous all-time high around $59.40. That confluence forms strong support.
A deeper flush could reach the golden pocket near $42, where an ascending trendline also sits. Buyers would likely defend that zone.
Momentum has cooled slightly, with volume easing and the RSI slipping back toward neutral. Even so, the broader trend stays bullish, and continued institutional demand for spot Hyperliquid products keeps the path toward $77 open.
ADI Shows the Strongest Momentum of the Three
ADI looks the most explosive of the group. The token trades near $3.96, about 13% below its all-time high of $4.55 from April 3, yet its recovery stands out.
Price corrected into the 0.618 golden pocket near $3.65 and held firmly. Since then, volume has expanded steadily, a sign that buyers are stepping back in with conviction.
One hurdle remains. The 0.382 retracement near $4.00 is acting as resistance, and ADI needs a daily close above it to clear the way back to records. The RSI has turned higher without reaching overbought territory, leaving room to run.
The token also carries real catalysts. ADI Chain recently launched its mainnet as an institutional network for stablecoins, and its Predictstreet platform was named an official prediction market partner of the 2026 FIFA World Cup.
The Aster DEX unveiled a huge change to its tokenomics on June 17, allocating 99% of fees generated through its platform to an ASTER token buyback, with one-to-one burns from its reserves for each token purchase.
The #48-ranked cryptocurrency witnessed a massive rebound shortly after the announcement but has since given back most of those gains.
DEX Pushes Token Buybacks to 99% of Fees
In a post on X, the YZ Labs-supported perp exchange said its upgraded tokenomics model went live at 12:00 PM UTC on June 17. Under the new framework, 99% of daily platform fees will be used to automatically buy back ASTER through time-weighted average price purchases executed throughout the day and settled on-chain.
Every token bought back will trigger an equal burn from Aster’s reserve, with the team allocation burned first, resulting in what they called a 198% buyback: 99% repurchased and 99% burned from reserve.
However, the coins that’ll be bought back won’t disappear. They’ll go directly to stakers after being added to the protocol’s Loyalty Reward pool, which already distributes 300,000 ASTER in every epoch.
And the burn target is quite significant. Recall that the DEX launched with a total supply of 8 billion tokens, and it intends to burn that down to 3 billion, meaning more than 60% of that supply has been earmarked for destruction.
CoinGecko states that the present circulating supply is at about 2.68 billion, while the total supply is 7.82 billion, so there’s still a long way to go before the burn target is reached.
Where ASTER Stands Now
News of the new tokenomics mechanism had an immediate effect in the market. It saw ASTER’s value jump 23%, going from around $0.64 to $0.79 per CoinGecko. But it has since given back a fair bit of that gain and was trading near $0.65 at the time of writing, almost 73% below its September 2025 all-time high of $2.41.
Back in December 2025, the exchange announced a similar repurchase program, but at the time, the plan was to allocate 80% of daily fees to hoover up the token.
That was split between automatic daily buys, which took 40% of the fees, while another 20% to 40% was to be held in a discretionary strategic reserve, allowing the platform to conduct targeted purchases based on market conditions.
That announcement also coincided with a brief price uptick, with ASTER spiking 30% to $1.30, buoyed by news that ex-Binance CEO Changpeng Zhao was holding more than $2.5 million worth of the cryptocurrency.
The new plan has removed the strategic reserve approach entirely and pushed allocation much higher, with nearly all platform fee revenue going into automatic buybacks.
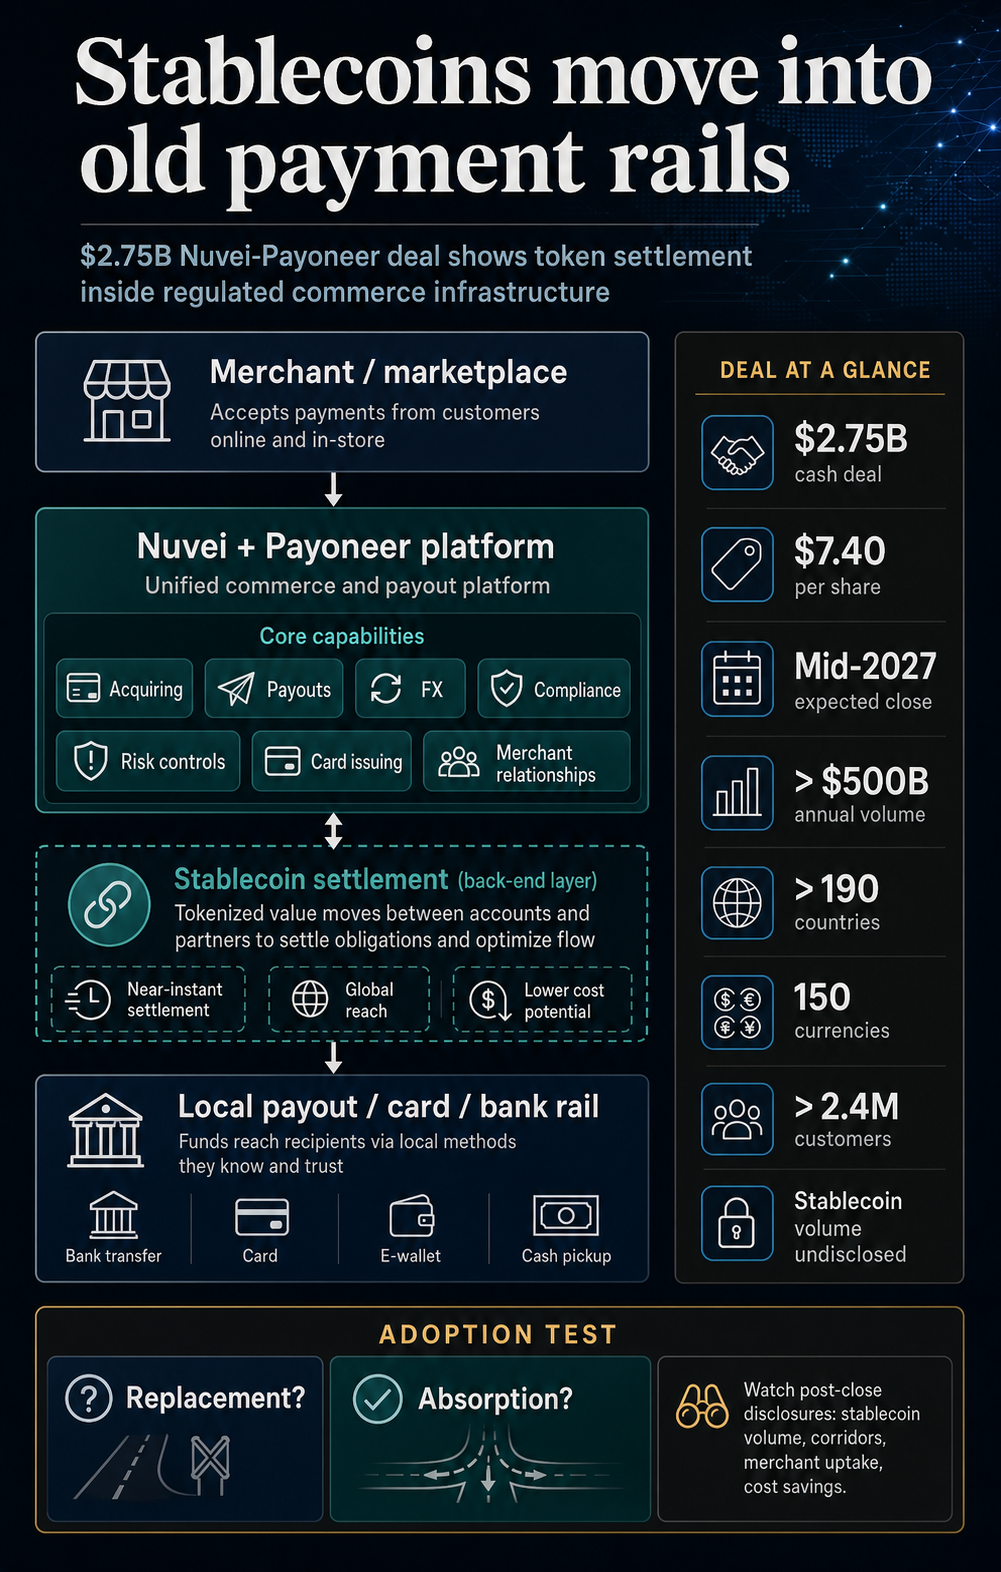
Nuvei agreed to buy Payoneer for $2.75 billion in cash in a deal centered on money movement through merchant acquiring, payouts, FX, cards, risk controls, and licenses.
The companies also placed stablecoins inside that payment stack. That gives the deal its crypto significance: mainstream stablecoin use may run through processors that already own merchant relationships, local approvals, fraud controls, FX tools, and payout networks.
Nuvei announced June 15 that it would acquire all outstanding Payoneer shares for $7.40 per share in cash. The companies said the transaction values Payoneer at approximately $2.75 billion.
The deal is expected to close in mid-2027, subject to Payoneer shareholder approval, regulatory approvals, and other customary conditions.
At closing, Nuvei said the combined company is expected to generate approximately $3 billion in annual revenue and process more than $500 billion in annual payment volume for more than 2.4 million customers.
It also said the combined business would give companies a single partner to accept, hold, and move money, including stablecoin transactions, across more than 190 countries and territories.
The companies left stablecoin-specific volume undisclosed, which keeps the claim modest. For now, the transaction points to stablecoins becoming one capability inside regulated commerce infrastructure, while any volume forecast depends on future reporting.
Stablecoins sit inside the payment stack
The crypto signal in the Nuvei-Payoneer deal comes from distribution. Payoneer remains a cross-border payments and financial platform for businesses, marketplaces, contractors, and sellers that need to move money across countries and currencies.
That network is relevant for stablecoins because token settlement still has to meet the real-world requirements of business payments.
A dollar token can settle value quickly on-chain, but a merchant or platform still needs acceptance, risk screening, currency conversion, local payout rules, reconciliation, and usable accounts.
Those functions determine whether payment speed becomes a product companies can actually adopt.
Payoneer said its network adds cross-border payouts, multi-currency accounts, a banking network, and same-day or real-time settlement in more than 150 markets.
The company also pointed to regulatory assets, including licensing for online payment services in mainland China and in-principle authorization as a cross-border payment aggregator in India under the Reserve Bank of India’s framework.
Nuvei brings the merchant acceptance side. The company already describes its platform around global acquiring, alternative payment methods, issuing, currency management, fraud and risk controls, bank transfers, real-time payments, and crypto and digital assets.
Nuvei’s platform reach includes 150 currencies, while the combined company is expected to operate across more than 190 countries and territories.
Put together, the deal shows stablecoin functionality moving toward back-end payment routing.
A merchant may care less about whether settlement moves through a token, a bank transfer, a card network, or a local payout provider than about cost, settlement speed, compliance, and whether funds arrive where the business needs them.
Confirmed element
Operational meaning
Constraint
$2.75 billion all-cash deal
Gives the analysis a concrete payments infrastructure peg
Closing remains pending
More than $500 billion expected annual payment volume
Shows the scale of payment-network distribution stablecoin functionality could plug into
Stablecoin-specific volume remains undisclosed
190+ countries and territories
Makes local payout, FX, and compliance coverage central to the analysis
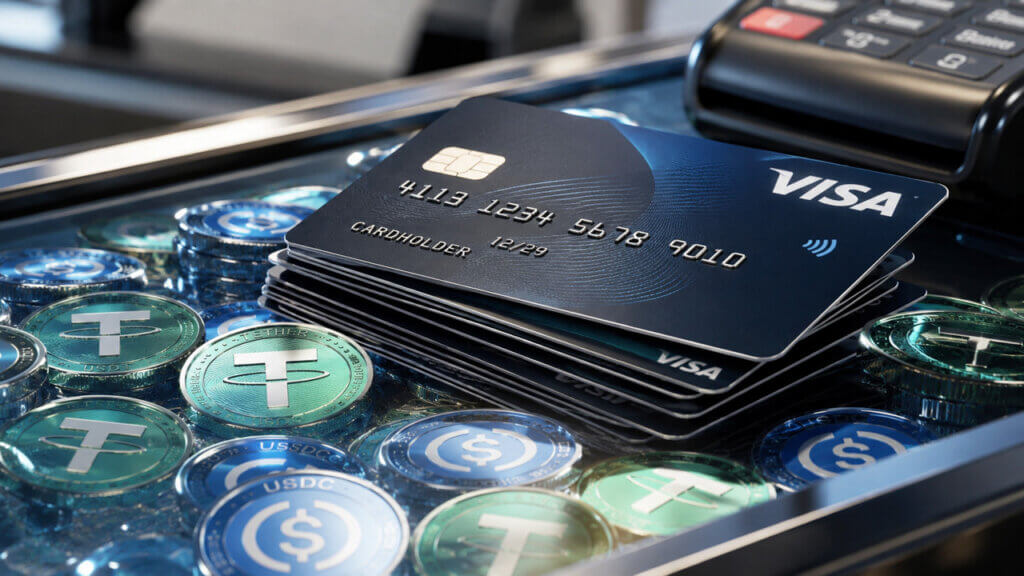
The Payoneer acquisition also extends work Nuvei had already started. Visa announced in 2023 that it was expanding USDC settlement capabilities with merchant acquirers Worldpay and Nuvei.
The program used Solana as well as Ethereum for settlement between partners. Those pilots remained limited, but they showed Nuvei operating where card settlement, merchant acquiring, and stablecoins overlap.
The company described a model in which businesses could use stablecoins for faster cross-border B2B payments and settlements while relying on existing card and payment infrastructure.
That history frames the Payoneer deal as distribution expansion. Payoneer gives Nuvei a wider base of cross-border customers, regulated markets, and payout relationships.
Stablecoin settlement can become more useful if it reaches that base through familiar payment products.
Compliance and distribution decide who owns the customer
The strongest version of the stablecoin thesis is that blockchain settlement can reduce delays, lower costs, and make cross-border payments easier.
The Nuvei-Payoneer deal leaves that thesis intact because it assumes stablecoins can be useful. It also shows how much non-token infrastructure still surrounds that usefulness.
A Federal Reserve staff analysis published in March said payment stablecoins can help address some cross-border payment frictions.
It also noted that FX liquidity, foreign-currency inventories, compliance checks, fiat conversion, and intermediaries may remain relevant in stablecoin-based cross-border models.
That maps closely onto what Nuvei is buying. Payoneer adds more than a payout interface.
Payoneer’s 2025 annual report describes a business that operates across payment services, money transmission, stored value, FX, compliance, bank and payment-service-provider relationships, and regulatory regimes.
Its India authorization is still in-principle, but the strategic asset is permissioned distribution across markets where rules, banking access, and trust shape payment adoption.
A stablecoin may move dollars across blockchains at any hour, but a corporate payment still has to enter and exit local financial systems.
Someone must handle identity checks, sanctions screening, tax documentation, local account access, chargebacks or disputes where applicable, and currency conversion.
If those functions sit around the token, processors that already own them can turn stablecoins into another settlement option while retaining the customer relationship.
Other payment networks are moving in the same direction. Mastercard said in March that it agreed to acquire BVNK, framing the deal around connecting on-chain payments and fiat rails.
That acquisition remains subject to regulatory review and other closing conditions, but the strategic language is similar. Stablecoins, tokenized deposits, and tokenized assets become usable when they plug into trusted payment networks.
CryptoSlate has tracked the same pattern in card payments.
A May analysis found that stablecoin-linked cards were routing most transactions through Visa, turning crypto balances into spending power through the same network stablecoins were expected to bypass.
Another CryptoSlate analysis argued that the control points for stablecoin payments are increasingly orchestration, compliance, reserves, FX management, and interoperability.
In that model, the token brand in front of the user plays a smaller role than the infrastructure behind it.
Nuvei’s Payoneer deal fits that map as market context while leaving execution to future disclosures.
If stablecoin payments scale through processors, acquirers, card networks, and cross-border payout providers, adoption can still be real while looking less like a clean exit from legacy finance.
Stablecoins can become a settlement and liquidity feature inside companies that already manage merchant access, local payout rules, and compliance.
The distinction changes who captures value in crypto payments.
If tokenized dollars become a back-end feature, the winners may be firms that control distribution and risk instead of issuers with the largest brands.
Merchants may choose the processor that gives them the best reach, cost, settlement speed, and local payout certainty, while the token itself becomes one part of the routing decision.
The adoption test comes after closing
The Nuvei-Payoneer deal leaves open whether stablecoins will eventually replace legacy payment rails.
It shows that large payment firms are preparing for a hybrid market in which stablecoins are packaged inside regulated money-movement platforms.
The next signals are concrete. The first is whether the transaction closes on the expected mid-2027 timeline after shareholder and regulatory review.
The second is whether Nuvei discloses stablecoin-specific payment volume, settlement corridors, merchant uptake, or cost savings after integration.
The third is whether businesses treat stablecoin settlement as a visible payment method or as hidden plumbing behind ordinary merchant and payout workflows.
The record points to absorption before replacement. Stablecoins are being packaged by mainstream payments companies.
If Nuvei can use Payoneer’s regulated distribution to make token settlement useful across merchants, platforms, and cross-border payouts, stablecoins may win payments by disappearing into the rails they were expected to bypass.
Charles Hoskinson said that a disputed stash of 1,096 BTC from Cardano’s early crowdfunding days was used to pay for an audit in 2016/2017.
The Cardano founder made the revelation during a recent livestream AMA, in which he talked about governance, Discord, and community management.
Hoskinson Clarifies Questions in AMA
Cardano’s crowdsale, which ran from October 2015 to January 2017, raised around 108,844 BTC, with 1,096 of this allocated to an Isle of Man Foundation entity that did some early legal and operational work for the project.
The organization has since been dissolved, but Thomas Braziel, founder of 117 Partners, recently questioned the value of the transaction and demanded a full account of where the BTC went and why they received it.
Hoskinson said during the weekend AMA that the funds date back to a March 2026 email from Michael Parsons, the project’s Chairman at the time, in which he asked to be compensated for auditing the crowdsale. He also clarified the value of the BTC, claiming that the bill was much smaller than what critics imply.
“The closing price of Bitcoin March, 13 2016, was $414. That’s about $400,000 for three auditors,” said Hoskinson.
According to him, the money was used to pay three independent reviewers, namely Michael Parsons, John McGuire, and Bruce Milligan.
Meanwhile, Hoskinson argued that the repeated calls for transparency are being made to start controversy as opposed to actually resolving anything, saying that any response leads to another round of accusations and ends up draining resources that could be used to grow the ecosystem.
Braziel Still Has Doubts
However, Braziel wasn’t satisfied with his response, arguing that the session created more questions than it resolved. He asked on social media how IOHK came to control roughly 95% of the BTC raised and got billions of ADA, while the Foundation received only a fraction of the total.
“If that’s the explanation, then the next step is simple: publish the invoices, agreements, and approvals, and payment records.”
The investor also believes the figure is inaccurate, saying that if an audit did happen, it likely took place later, when the OG cryptocurrency was already worth much more than it was during the early fundraising years. In his view, “the numbers just don’t seem to add up.”
The development comes as Cardano is in the midst of a raging debate about its treasury, governance, and engagement, with the co-founder revealing that the project is working on a plan to move its ADA community to Discord.
At the same time, the Cardano Foundation’s budget has come under public scrutiny, with only a third of the proposals approved under the new process. Organizers have also canceled their planned 2026 Singapore Summit after a $7.8 million ADA treasury request linked to the event was rejected.
Nearly all of the top 100 cryptocurrencies have recorded substantial gains over the last 24 hours, boosted by news of the peace deal between the United States and Iran.
Hyperliquid (HYPE) stands out among the top performers, with its price spiking by 12%. Some analysts believe it may jump even more in the following days, while others cautioned that the bears may soon regain control.
Going Higher?
In early June (when the broader crypto market was bleeding heavily), HYPE exploded to an all-time high of around $75. However, the historic peak was short-lived, and the price headed south to around $53 in the following days, influenced by bearish factors such as Arthur Hayes’s decision to dump all his positions in the asset.
Currently, though, the asset trades at around $68, representing a 28% increase from the local bottom. Moreover, its market capitalization has surged past $15 billion, and thus HYPE re-entered crypto’s elite top 10 club after surpassing the OG meme coin Dogecoin (DOGE).
According to some analysts, the recent pump to almost $70 simply marks the early stages of a much larger upward move. X user Cozy the Caller thinks that HYPE “just goes straight to $100 from here.”
KNIGHT and Owl Prints were also optimistic. The former projecteda rise above $110 in the coming months, while the latter argued that reclaiming $64.60 (which, for the moment, seems to be the case) “opens up a clean run toward previous cycle peaks.”
The Bearish Outlook
Last week, many market observers spotted the formation of a head-and-shoulders pattern on HYPE’s chart, which has historically been a precursor to a pullback.
Several hours ago, Ali Martinez opined that the recent price action has seemingly shaped the right shoulder of that structure, labeling $65 as the key resistance level. He also warned that losing $54 could trigger a major correction down to $40.
HYPE’s current Relative Strength Index (RSI) raises the possibility of a sudden price drop. The technical analysis tool runs from 0 to 100, and ratios above 70 signal that the asset is overbought and due for a potential pullback. As of this writing, it stands at 93, showing that the valuation has surged in an unhealthy manner.
HYPE RSI, Source: RSI Hunter
The next bearish element worth mentioning is HYPE’s exchange netflow. Over the past three days, investors have moved some of their holdings from self-custody to centralized platforms, with inflows outpacing inflows. This increases immediate selling pressure.
Geneva, Switzerland, June 15, 2026 — TRON DAO, the community-governed DAO dedicated to accelerating the decentralization of the internet through blockchain technology and decentralized applications (dApps), participated in ETHConf, held June 8–10 in New York, organized by ETHGlobal. TRON DAO also extended its presence throughout the week with a dedicated TRON Academy Happy Hour alongside the ETHGlobal New York 2026 hackathon, held between June 12–14. Supporting developer education and student-led blockchain innovation through TRON Academy, whose university network now spans across leading institutions like Princeton University, Imperial College London, Yale University, Columbia University, Harvard University, MIT, Cornell University, the University of California, Berkeley, University of Oxford, University of Cambridge, Dartmouth College and more.
At ETHConf, one of Ethereum’s premier ecosystem conferences, the TRON DAO team connected with builders, founders, and technologists shaping the next wave of decentralized applications, policy regulations, and real-world blockchain adoption.
Alongside ETHGlobal New York, TRON Academy powered by niTROn co-hosted a Happy Hour with Princeton Blockchain Club at Anytime Billiards NYC, supported by a coalition of leading student blockchain organizations: Blockchain Chicago, Blockchain at Columbia, Blockchain at Emory, Blockchain & Fintech at Fordham, NYU Blockchain Lab, and Penn Blockchain. The session drew more than 70 participants from across the student and developer communities.
The happy hour also featured a panel, “Campus to Mainnet: How Student Builders Will Shape the Future of Blockchain,” moderated by TRON DAO’s ecosystem development team, with student panelists representing Blockchain Chicago, Blockchain & Fintech at Fordham, Penn Blockchain, and NYU Blockchain Lab. The discussion explored how stablecoins and digital dollars are unlocking real-world use cases across payments, cross-border settlement, and how campus clubs are moving from learning to launching real projects. Panelists also weighed the skills and career paths shaping the next wave of Web3, including the emerging role of AI agents and onchain payments.
By meeting students and developers where they build, TRON DAO continues to widen access to the people, resources, and hands-on exposure that turn early curiosity into lasting contribution across the decentralized economy. For more information about TRON’s initiatives and upcoming events, please visit TRON DAO’s official website.
About TRON DAO
TRON DAO is a community-governed DAO dedicated to accelerating the decentralization of the internet via blockchain technology and dApps.
Founded in September 2017, the TRON blockchain has experienced significant growth since its MainNet launch in May 2018. Until recently, TRON hosted the largest circulating supply of USD Tether (USDT) stablecoin, which currently exceeds $89 billion. As of June 2026, the TRON blockchain has recorded over 387 million in total user accounts, more than 14 billion in total transactions, and over $25 billion in total value locked (TVL), based on TRONSCAN. Recognized as the global settlement layer for stablecoin transactions and everyday purchases with proven success, TRON is “Moving Trillions, Empowering Billions.”
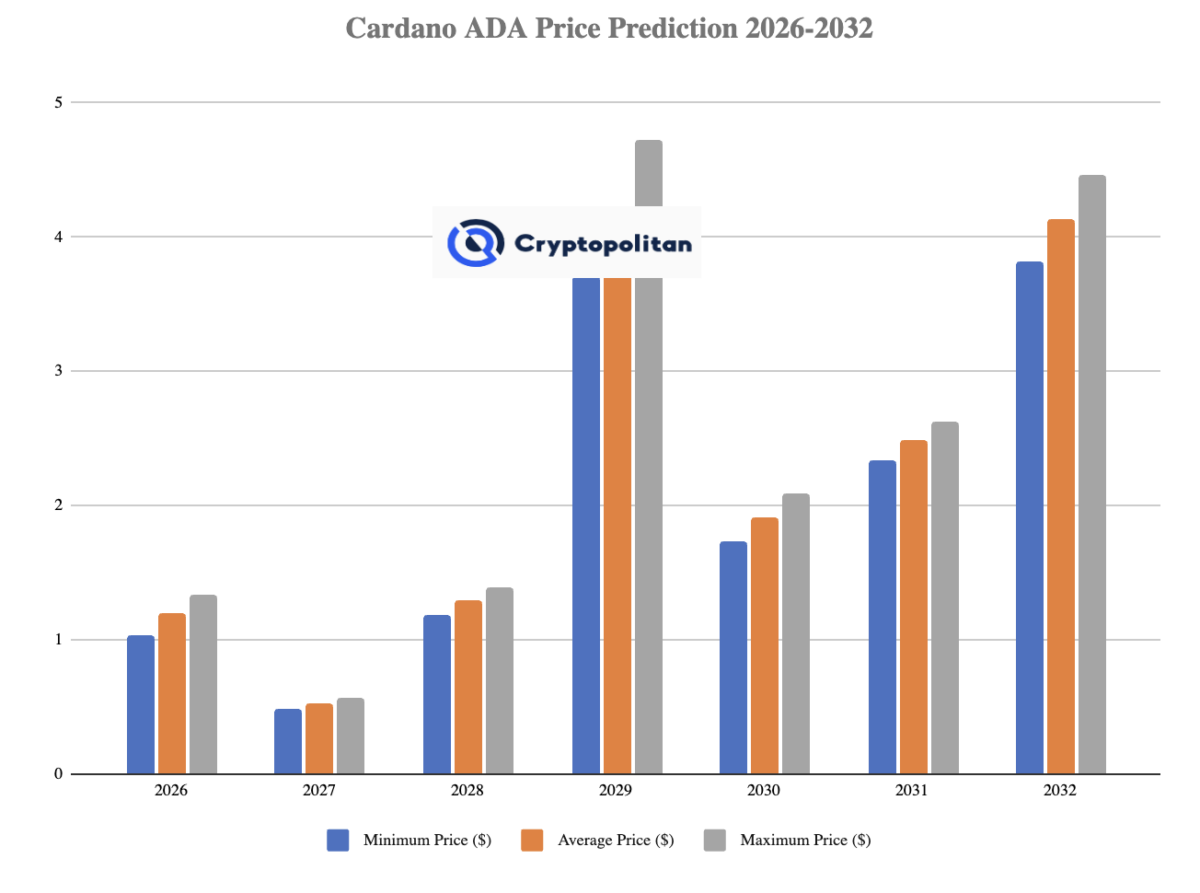
Cardano’s price is expected to surpass $1.33 in 2026.
By 2029, ADAUSD could reach $4.72.
By 2032, Cardano might reach a maximum price of $4.46.
Cardano is a third-generation blockchain platform launched in 2017 by Ethereum co-founder Charles Hoskinson. Designed for decentralized applications and smart contracts, it uses Ouroboros—a unique, energy-efficient Proof-of-Stake consensus mechanism.
Cardano’s two-layer architecture separates transactions from smart contracts, enhancing scalability and flexibility. Its native cryptocurrency, ADA, is used for transaction fees, staking, and governance, allowing holders to influence the platform’s future. Emphasizing a research-driven, peer-reviewed development approach, Cardano aims to address challenges in blockchain, such as scalability and sustainability, making it a strong alternative to platforms like Ethereum.
Perhaps you’re wondering: with its innovative technology, can Cardano’s ADA reach new all-time highs soon?
Let’s uncover what the future holds for Cardano.
Overview
Cryptocurrency
Cardano
Token
ADA
Price
$0.1671
Market Cap
$6.08B
Trading Volume (24-hour)
$289.31B
Circulating Supply
44.99B ADA
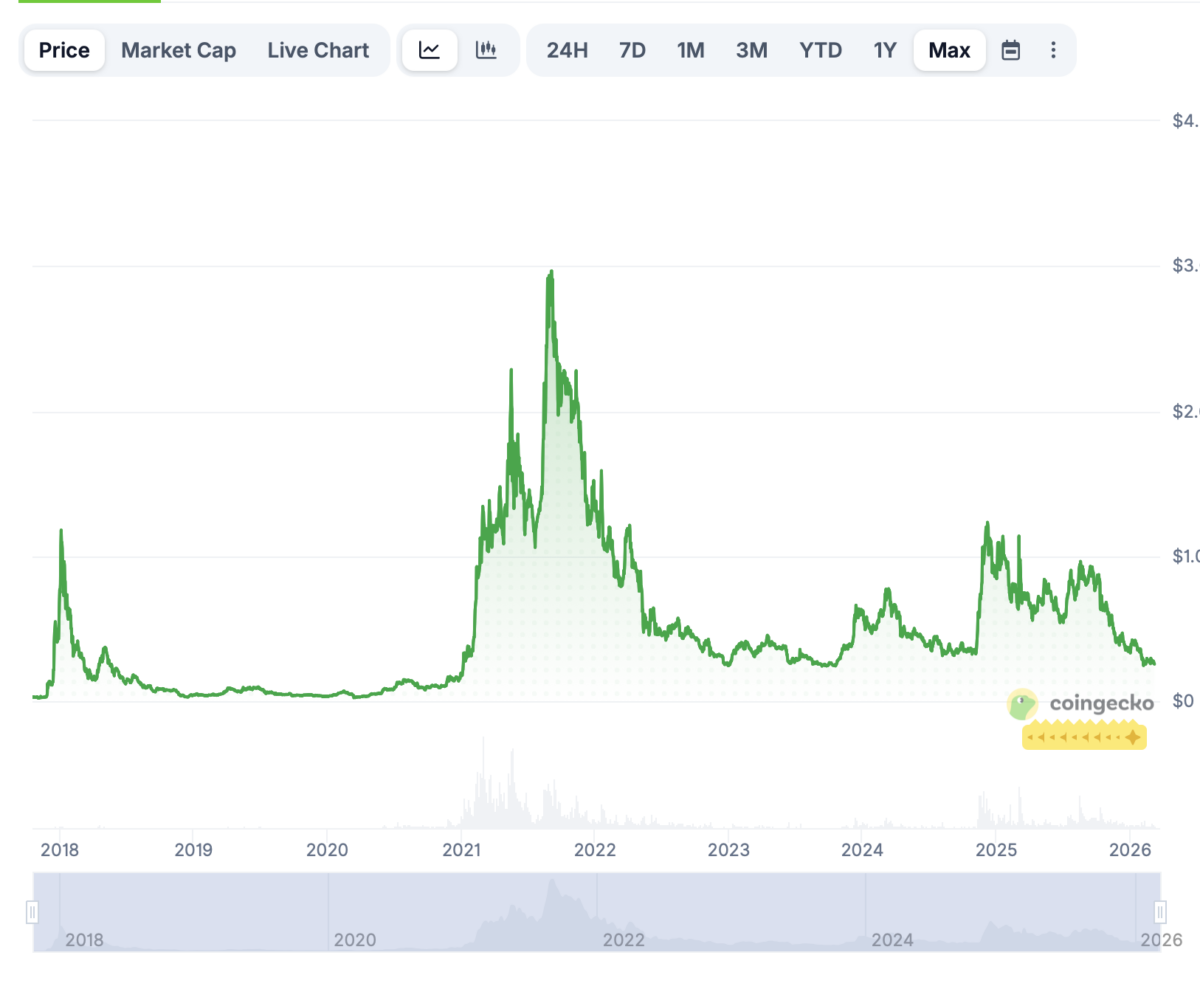
All-time High
$3.10 on Sept 02, 2021
All-time Low
$0.01735 on Oct 01, 2017
24-hour High
$0.1737
24-hour Low
$0.1659
Cardano price prediction: Technical analysis
Metric
Value
Volatility (30-day Variation)
16.86% (Very High)
50-day SMA
$ 0.2337
14-Day RSI
30.44 (Neutral)
Market Sentiment
Bearish
Fear & Greed Index
18 (Extreme Fear)
Green Days
9/30 (30%)
200-day SMA
$ 0.2977
Cardano (ADA) price analysis
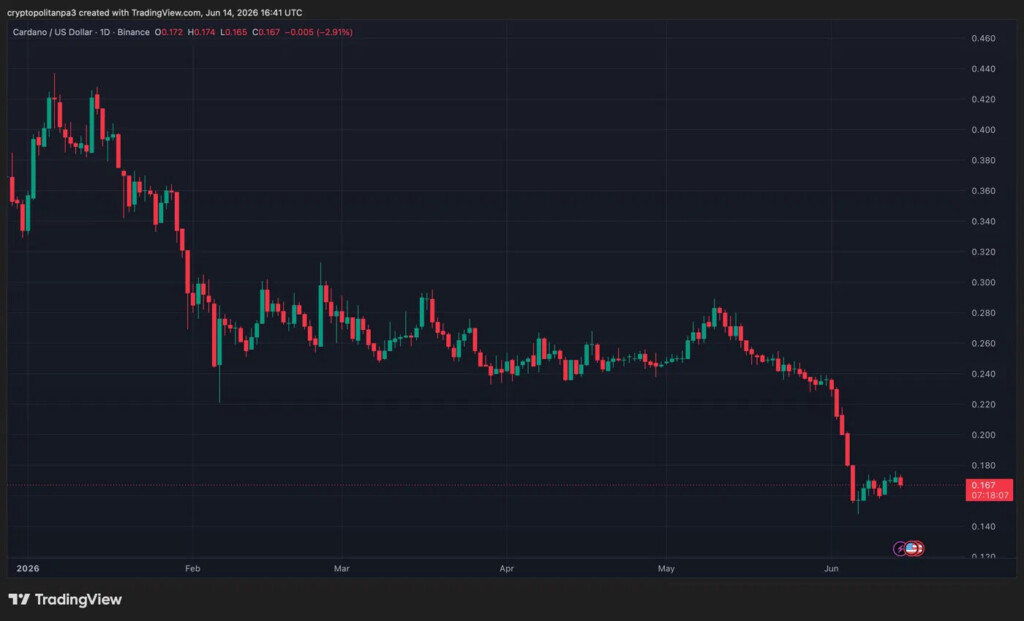
Cardano is down 2.91% at $0.167, hitting fresh 2026 lows with sellers firmly in control across all timeframes.
Price briefly touched $0.145 before a weak bounce, now consolidating between $0.165 and $0.175 with little buying conviction.
Bulls need a reclaim of $0.180 to signal relief; failure risks a drop toward $0.140.
Cardano price analysis 1-day chart: Cardano slides to $0.167 as bears push ADA to fresh 2026 lows
Cardano is trading at $0.167, down 2.91% on the day, hitting fresh 2026 lows after a devastating June sell-off from the $0.240 range. The 1D structure is deeply bearish, with price breaking below the $0.175 horizontal support — a level that had previously acted as a floor — signaling accelerated selling pressure.
The overall trend shows a prolonged downtrend from January’s $0.440 peak, with no meaningful recovery attempts. Today’s candle confirms sellers remain in complete control. Immediate support is thin, with $0.150 as the next major level to watch. A reclaim of $0.180 is needed before any bullish case can be considered.
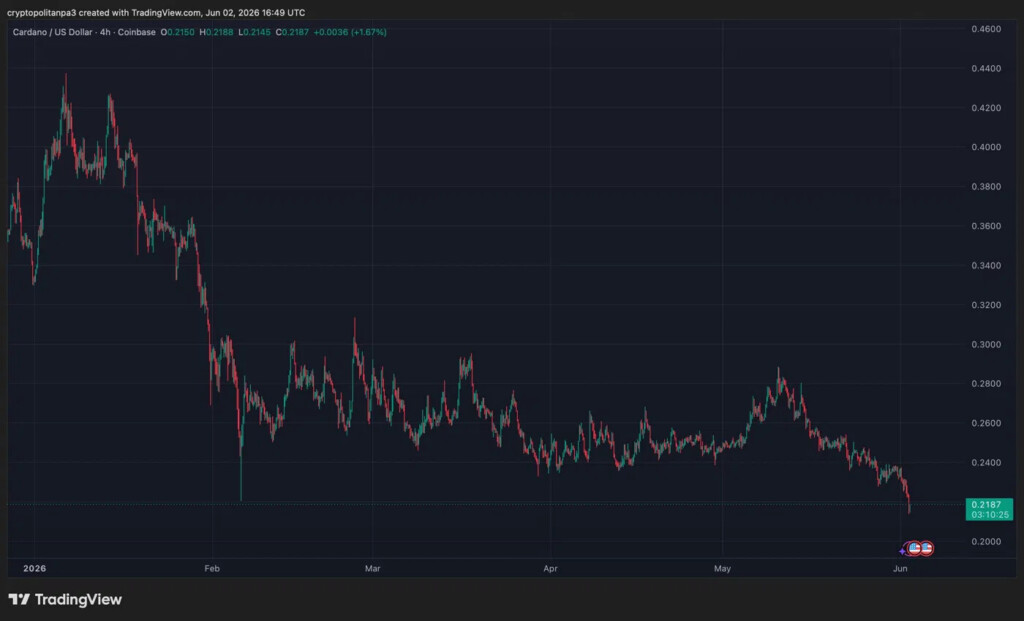
ADA price analysis 4-hour chart: Cardano consolidates at $0.167 as the 4-hour chart signals a fragile recovery attempt
ADA’s 4H chart shows price at $0.167, completely flat at 0.00%, consolidating after an aggressive June sell-off that briefly pushed price to $0.145 lows. The 4H structure reveals a steep descending channel throughout May and June, with no meaningful counter-rally until the recent bounce from all-time 2026 lows.
Price is now attempting to stabilize around the $0.165–$0.175 range, but the recovery lacks momentum. The $0.180 horizontal level remains a key resistance barrier from prior support. A 4H close above this level is needed to signal short-term relief. Below $0.155, selling pressure could intensify toward $0.140 — uncharted 2026 territory.
ADA technical indicators: Levels and action
Daily simple moving average (SMA)
Period
Value
Action
SMA 3
$0.2340
BUY
SMA 5
$0.2340
SELL
SMA 10
$0.2380
SELL
SMA 21
$0.2477
SELL
SMA 50
$0.2519
SELL
SMA 100
$ 0.2569
SELL
SMA 200
$0.3143
SELL
Daily exponential moving average (EMA)
Period
Value
Action
EMA 3
$0.2331
BUY
EMA 5
$0.2345
SELL
EMA 10
$
SELL
EMA 21
$ 0.2544
SELL
EMA 50
$ 0.2574
SELL
EMA 100
$ 0.2780
SELL
EMA 200
$ 0.3483
SELL
What to expect from the Cardano price analysis next?
Following the 1D and 4H breakdowns, the next step would be a 1-hour chart analysis, zooming in on the immediate price action and short-term momentum around the critical $0.165–$0.175 consolidation zone. After that, a key levels summary pulls together the most important support and resistance levels across all timeframes for quick reference. The analysis then moves into a price prediction section, weighing the deeply bearish technical structure against any potential fundamental catalysts that could trigger a recovery. Finally, a conclusion summarizes the overall market bias, helping readers assess whether ADA at $0.167 represents a capitulation buying opportunity or a warning of further downside.
Why is Cardano down today?
Cardano is down today due to a mix of poor price action and deep concerns about the ecosystem. On the charts, ADA has been in a relentless downtrend since January’s $0.440 peak, with sellers breaking every support level in sight. TapTools, a long-standing Cardano analytics platform, shut down after citing unsustainable operating conditions, while founder Charles Hoskinson warned of a potential “wave of failures” and criticized the community’s reluctance to deploy treasury funds to support projects. Adding to the pain, the community voted against funding Cardano’s own flagship 2026 Summit, forcing its cancellation — deepening the confidence crisis already reflected in today’s price.
Is Cardano a good investment?
Cardano (ADA) presents a mixed investment opportunity. It is a third-generation blockchain that aims to solve scalability issues and enhance security through its Proof-of-Stake mechanism. While some analysts predict significant price increases by 2030, others caution that it remains a high-risk investment given the volatility of the crypto market.
Investors should consider their risk tolerance and research before investing, as Cardano’s future performance is uncertain and contingent on market conditions and technological advancements.
Will Cardano recover?
Cardano’s recovery potential depends on market sentiment and adoption. Despite past challenges, its projected price increase in 2026, potentially reaching $1, has significantly bolstered confidence in the coin’s future.
Will Cardano reach $5?
Cardano hitting $5 seems quite achievable given past levels. With its ATH around $3.10, $5 would only need to beat that peak by about 60%. A solid bull run and significant adoption could drive the unit price to $5.
Will Cardano reach $10?
Cardano hitting $10 is a long shot. Its all-time high was around $3.10 back in 2021, so $10 would mean more than tripling that peak. At current prices, that’s an over 13x jump. While crypto can be unpredictable, that would need massive adoption and a bull run far beyond what we saw in 2021.
Will Cardano reach $50?
Cardano hitting $50 is extremely likely. With ADA’s current supply of around 35 billion tokens, a $50 price would require a market cap of approximately $1.75 trillion. Even in crypto’s craziest bull runs, that kind of valuation doesn’t happen for altcoins.
What is the Cardano forecast for 2040?
Predicting Cardano’s (ADA) price in 2040 is highly speculative as it depends on multiple factors, including adoption, regulatory developments, technological advancements, and macroeconomic conditions. However, if Cardano continues to develop its smart contracts, decentralized applications (dApps), and blockchain efficiency, it could see widespread adoption, driving its price higher.
Some optimistic projections suggest that ADA could reach double-digit prices, possibly ranging from $10 to $50 or more. However, in a bearish scenario, where regulatory hurdles and competition slow its progress, ADA could struggle to maintain high valuations.
What will be the future price of Cardano in 2050?
Predicting Cardano’s (ADA) price in 2050 is highly speculative, but if blockchain adoption continues to grow and Cardano successfully scales its smart contract ecosystem, its price could appreciate significantly. What that number will be remains to be seen.
Does Cardano have a good long-term future?
Cardano (ADA) has a positive long-term outlook, driven by its technological advancements and growing ecosystem. The platform’s unique features, such as its focus on scalability and partnerships with various institutions, position it well for future adoption. However, its success will depend on overcoming regulatory scrutiny and challenges related to developer engagement.
Recent news/opinion on Cardano
Cardano’s Plutus Cost Model Update Goes Live on Mainnet Ahead of Protocol Version 11 Hard Fork
Cardano’s Plutus Cost Model GA has launched on mainnet, enabling new Plutus V1, V2, and V3 primitives while requiring DRep and Constitutional Committee votes to activate additional features post-hard fork.
Plutus Cost Model update proposal now live on Mainnet!
Having progressed through SanchoNet, Preview and PreProd test networks during March, April and May respectively, the Plutus Cost Model GA is now live on Mainnet.
Cardano’s June 2026 forecast is $0.2193-$0.3169, averaging $0.2617, driven by steady network development, including smart contract enhancements and scaling upgrades. The growing use of Cardano-based DeFi, NFTs, and governance projects supports moderate bullish sentiment. However, cautious market conditions and slow institutional momentum may limit rapid price expansion, maintaining this controlled range.
Cardano Price Prediction
Potential Low
Potential Average
Potential High
Cardano price prediction June 2026
$0.2193
$0.2617
$0.3169
Cardano price prediction 2026
According to the Cardano price prediction, ADA might reach a maximum price of $1.33, with an average trading price of about $1.20 and a minimum price of $1.03
Cardano Price Prediction
Potential Low
Potential Average
Potential High
Cardano price prediction 2026
$1.03
$1.20
$1.33
Cardano price predictions 2027-2032
Year
Minimum Price
Average Price
Maximum Price
2027
$0.4838
$0.5282
$0.5725
2028
$1.19
$1.29
$1.39
2029
$3.71
$4.21
$4.72
2030
$1.73
$1.91
$2.09
2031
$2.33
$2.48
$2.63
2032
$3.81
$4.13
$4.46
Cardano price prediction 2027
Cardano’s price is forecast to reach a low of $0.4838 in 2027. According to analysts, the ADA price is expected to decline and could reach a maximum of $0.5725, with an average forecast of $0.5282.
Cardano price prediction 2028
The Cardano price is forecast to reach a minimum of $1.19 in 2028. According to the findings, the ADA price could reach a maximum of $1.39, with an average forecast price of $1.29. This is expected as network upgrades, DeFi expansion, and institutional integration strengthen ADA’s utility and demand, supporting steady long-term growth.
Cardano price prediction 2029
According to detailed market projections and historical trend analysis, Cardano (ADA) could trade at a minimum of $3.71 in 2029, reaching as high as $4.72, with an average price of $4.21.
Cardano price forecast 2030
Based on a comprehensive technical evaluation and market trends, Cardano (ADA) could bottom around $1.73 in 2030, with highs near $1.91 and an average of $2.09.
Cardano price prediction 2031
The price of 1 Cardano (ADA) is expected to increase slightly from previous years, reaching a minimum of $2.33 in 2031, with a potential peak of $2.63 and an average of $2.48.
Cardano price prediction 2032
According to the forecast and technical analysis, the ADA coin price prediction for 2032 is expected to range from a minimum of $3.81 to a maximum of $4.46, with an average of $4.13. This upward outlook is supported by Cardano’s full ecosystem maturity, large-scale enterprise integration, and increasing global adoption of decentralized applications built on its network, driving long-term demand and value appreciation.
Cardano price prediction 2026-2032
Cardano ADA price prediction: Analysts’ ADA price prediction
Firm Name
2026
2027
DigitalCoinPrice
$0.31
$0.31
Coincodex
$ 0.3915
$ 0.6216
Cryptopolitan’s Cardano price prediction
According to Cryptopolitan’s projections, ADA’s price could reach $0.35 in 2026. By 2027, Cardano’s price could trade at a maximum of $0.51.
ACH launched near $0.02 in 2020, surged to $0.1975 in August 2021, then slid below $0.10 by year’s end.
During 2022 and 2023, it fell to $0.0133, later rebounded toward $0.049, but stayed volatile
In 2024, it dropped to $0.0145, recovered above $0.02, and briefly reached $0.0397 in December.
Early 2025 saw swings between $0.016 and $0.040, before weakening again toward $0.020 by mid-year.
Late 2025 into early 2026 marked heavy losses to $0.0070–$0.0078, followed by stabilization near $0.0082.
In early January 2026, Cardano traded between $0.36 and $0.38 as buyers sought to stabilize the price after the December decline and defend support in the mid $0.30s.
By late January into February 7, the price slipped toward roughly $0.33 to $0.34, showing continued corrective pressure and consolidation near a key support zone.
Cardano traded around $0.40 on Jan 7, 2026, but steadily declined through the month, falling to roughly $0.29 by Feb 1 as selling pressure increased across the broader altcoin market.
The price briefly recovered afterward, rising from about $0.25 on Feb 5 to around $0.27 on Feb 7, showing a short-term rebound after the early February dip.
ADA began March around $0.29, attempting to stabilize after a sharp decline, with small consolidation candles forming near that level and a brief 5.8% surge on March 13 as broader crypto markets rallied — though the recovery lacked strong follow-through, with price still trading below all major moving averages throughout the month.
By late March, Hyperliquid’s HYPE token flipped ADA in market cap on March 18, adding bearish sentiment, and ADA dropped 4.8% on March 25 as part of a worldwide market sell-off — ultimately closing the period around $0.24 by April 3, representing a decline of roughly 17% over the month.
ADA entered April 1 around $0.24, having shed roughly 17% through March, driven by broad market selling and bearish sentiment, with the month’s forecast range sitting between $0.2251 and $0.3252.
By May 2, ADA was virtually flat at approximately $0.25, having spent the entire period consolidating in a narrow range with 50% green days and just 1.96% price volatility, reflecting a market stuck in indecision with no meaningful breakout in either direction.
ADA entered May 2 trading around $0.25, consolidating near multi-month lows after a prolonged downtrend from the January highs near $0.44, with bears firmly in control and the token struggling to hold above the critical $0.24-$0.25 support zone throughout the month.
By June 2, ADA had declined further to around $0.23, down 2.56% on the day, after the Cardano Foundation canceled its 2026 annual summit following a funding vote that failed, adding significant negative sentiment and pushing ADA toward its lowest levels since 2020.