Ripple Price Analysis: What Are XRP’s Next Targets After 8% Weekly Surge?
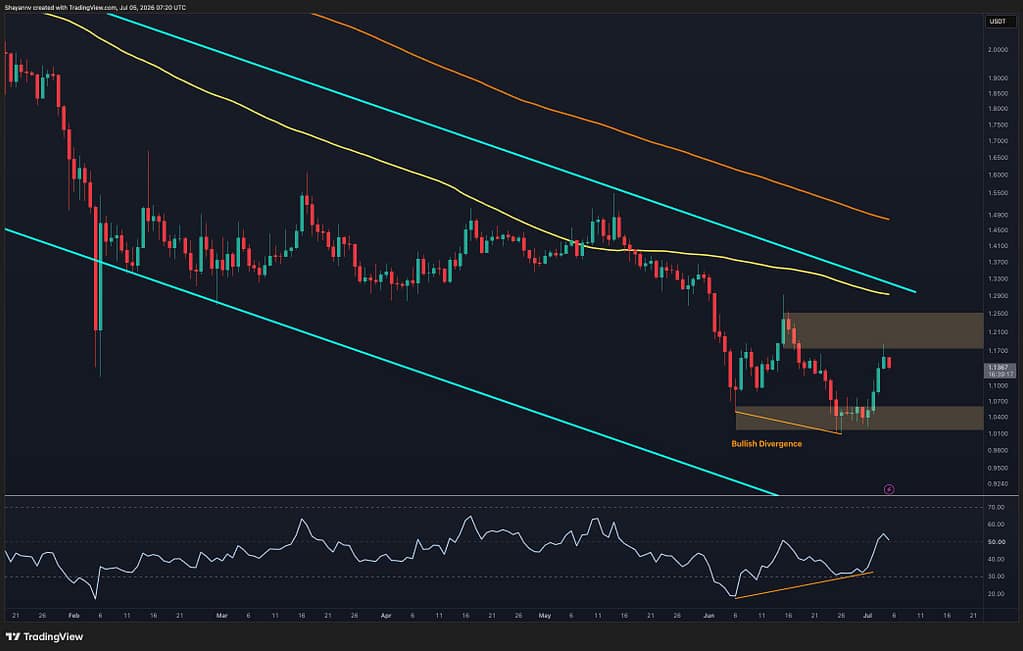
XRP has rallied 8% over the past week after a bullish RSI divergence near $1.02, $1.05 support, but institutional investors should watch whether the token can break above the $1.17, $1.24 resistance zone, a critical technical threshold that will determine if the recovery represents a structural reversal or merely a temporary relief bounce.
- XRP rebounded sharply from the $1.02, $1.06 support zone after RSI printed higher lows while price made lower lows, signaling weakening selling pressure
- The token now faces the $1.17, $1.24 resistance zone on the daily chart, a prior support level that must hold for a larger reversal structure to form
- On the 4-hour chart, XRP is testing a dynamic descending trendline that has capped lower highs since mid-June; a breakout above it would open the door to the $1.21, $1.29 supply zone
- 8% Weekly gain after recovery from recent support levels
- $1.17, $1.24 Next major resistance zone determining reversal validity
- Mid-June When descending trendline began capping lower highs
Ripple’s XRP token has recovered 8% over the past week, breaking out of a narrow consolidation range and reclaiming ground lost during a sharper decline that tested support near $1.02, $1.05.
The move validates a technical warning sign that emerged as the token fell: a bullish RSI divergence in which the relative strength index printed higher lows even as price moved to lower lows, indicating that selling pressure was exhausting.
The recovery has now pushed XRP toward a critical technical inflection point that will determine whether the bounce represents the start of a structural reversal or merely a short-term relief rally before further weakness.
For institutional investors assessing XRP’s medium-term direction, the stakes are clear. The token trades within a long-term descending channel and below both its major moving averages, a configuration that maintains a bearish bias despite the recent strength. However, the character of the price action has improved materially.
XRP’s ability to hold the $1.02, $1.06 support zone and then advance decisively suggests that the selling pressure that dominated through mid-June may be moderating. The next 5-10 trading days will likely prove decisive.
Bullish Divergence Plays Out as XRP Rebounds from $1.02, $1.05 Floor
The strength of XRP’s recovery gains credibility from the technical setup that preceded it. As the token declined toward its recent low around $1.02, $1.05, the RSI, a momentum indicator that ranges from 0 to 100, began to rise even though price continued to fall. This divergence suggested that the selling pressure driving lower prices was not increasing in intensity; instead, it was weakening.
When the selling eventually stopped and buyers re-entered the market, this dynamic proved prescient, and the recovery began.
The rebound has carried XRP back above the RSI midline at 50, a level that separates bullish momentum (above 50) from bearish momentum (below 50). This shift in the indicator’s trajectory reinforces the case that the near-term trend has tilted in favor of buyers.
On the daily timeframe, the token has reclaimed the lower support region around $1.02, $1.06 and is now advancing toward the first major resistance zone between $1.17 and $1.24.
This $1.17, $1.24 zone is critical because it previously functioned as support before a sharp breakdown, meaning that sellers learned to defend this level in past trading sessions.
Daily Chart Resistance Zone at $1.17, $1.24 Will Determine Reversal Credibility
The difference between a temporary bounce and a genuine structural reversal often hinges on whether an asset can reclaim and hold prior resistance. For XRP on the daily chart, that threshold is the $1.17, $1.24 resistance band.
A successful move above this zone would mark the first meaningful sign that buyers are gaining control and that a larger reversal structure, characterized by higher highs and higher lows, can begin to form.
As long as XRP remains below this zone and continues to trade under the descending channel’s upper boundary and the major moving averages, the underlying trend remains bearish. The token would need to break above all three of these obstacles in sequence to invalidate the longer-term downtrend.
The current recovery is therefore best viewed as a test of whether that process can begin, not as confirmation that it has already succeeded.
For portfolio managers with exposure to XRP, the daily close above $1.24 would be the first concrete signal warranting increased confidence in a recovery scenario. A failure to reach or sustain a move above this zone would likely trigger a pullback back toward the $1.02, $1.06 support, where buyers would need to re-establish their commitment.
4-Hour Trendline Breakout Could Signal Structural Shift After Weeks of Weakness
The 4-hour chart provides a sharper view of the immediate pivot point that XRP is now approaching. Over the past several weeks, buyers and sellers have established a clear pattern: a descending trendline that has capped each successive rally since mid-June.
This trendline has functioned as a ceiling, preventing the token from rallying too far before sellers re-engaged and pushed the price back down.
In the current recovery, XRP is now testing this trendline directly. A confirmed breakout above it would represent the first structural shift in this pattern, a move from a regime of lower highs and lower lows to one in which higher highs and higher lows can emerge.
Such a breakout would open the door for XRP to advance into the broader $1.21, $1.29 supply zone, where institutional sellers from earlier trading may look to exit positions or establish new shorts.
If the trendline holds as resistance, XRP would likely pullback toward the $1.02, $1.06 support zone to establish a new base for another attempt.
The 4-hour timeframe is particularly relevant for short-term traders and algorithmic desks that are likely to act decisively once XRP either breaks or fails to break the trendline. A clean breakout with volume confirmation could trigger rapid covering of short positions and accelerate the move toward $1.21, $1.29.
Conversely, a rejection at the trendline with falling volume could signal that the recovery has run its course and that sellers remain in control.
Momentum Favors Bulls in the Short Term, But Confirmation at Key Resistance Is Essential
The current technical setup presents a clear risk-reward framework for institutional investors. The RSI is rising, price has reclaimed key support, and XRP is testing multiple resistance levels that will either confirm or invalidate the reversal narrative. In the short term, the momentum indicators favor the bulls.
The token is not trading at an extreme overbought level, meaning there is room for further upside before a pullback becomes necessary on oscillator grounds alone.
However, the broader structure remains corrective. XRP continues to trade beneath its major moving averages and the descending channel resistance, which means the longer-term bias remains bearish unless these levels are reclaimed. The recovery can be seen as a necessary and expected part of a corrective process, but it is not yet proof that the downtrend has fundamentally reversed.
The next 5-10 trading days will likely settle the question: if XRP closes above $1.24 on the daily chart and maintains that level through at least one pullback, a structural reversal case becomes materially stronger; if it fails to break the 4-hour trendline or the $1.17, $1.24 zone and rolls over back toward $1.10, the recovery will be classified as a relief bounce within an ongoing downtrend, and the test of the $1.02, $1.06 support floor may be revisited.