Ethereum Price Analysis: Is $2K Still Possible After ETH Drops Below $1.9K?
Ethereum has broken below a key short-term ascending trendline, signaling weakening bullish conviction even as the asset holds near $1.88K. For institutional traders, the deterioration in order flow sentiment and absence of whale accumulation suggest the rally from June lows may be losing momentum before any sustained move toward $2,000 can materialize.
- ETH broke below an ascending trendline established from early-July lows and has failed to reclaim it, a bearish technical signal.
- Spot order flow data shows a sharp decline in large whale orders since early August, replacing conviction-driven accumulation with retail-sized trades.
- The $1.80K-$1.84K support zone is the critical near-term test; failure here could expose $1.71K-$1.75K and derail any $2,000 target.
- $1.88K Current ETH price versus $1.53K-$1.57K June lows and $2,000 resistance target
- $1.80K-$1.84K Primary support zone below current levels before major capitulation risk
- Early August Peak in whale order activity, followed by sharp reversal to retail-dominated trading
Ethereum is caught between competing technical signals, leaving institutional traders facing an uncomfortable question: can the asset reach $2,000, or is the current recovery merely a bear market bounce destined to fail at lower levels? After recovering from $1.53K-$1.57K lows in June, ETH rallied to near $1.9K through early August, briefly testing the psychological $2,000 barrier.
That recovery has now stalled. The asset is consolidating around $1.88K on heavy two-way flows and sharply reduced trading volume, with the critical technical development being the breakdown of an ascending trendline that had contained price action since early July.
What makes this move significant for institutional investors is not merely the trendline break itself, but the market’s failure to reclaim it and the simultaneous retreat of whale-sized order activity from spot markets. Together, these signals suggest that conviction-driven accumulation is waning precisely when institutional participants would typically be defending a bullish thesis.
Breakdown Below Ascending Trendline Signals End of Early-July Recovery Structure
The most immediate technical damage is the clean break below the ascending trendline that has guided ETH higher since the early-July lows. In technical analysis, a trendline breach is not a signal in isolation; what matters is whether price action immediately reclaims it or remains beneath it.
In this case, ETH has remained decisively below the former support, a pattern that typically precedes deeper retracements. The market’s inability to hold ground above the trendline suggests that buyers who accumulated during the early-to-mid-July period are either taking profits or sitting flat, unwilling to provide additional bid support.
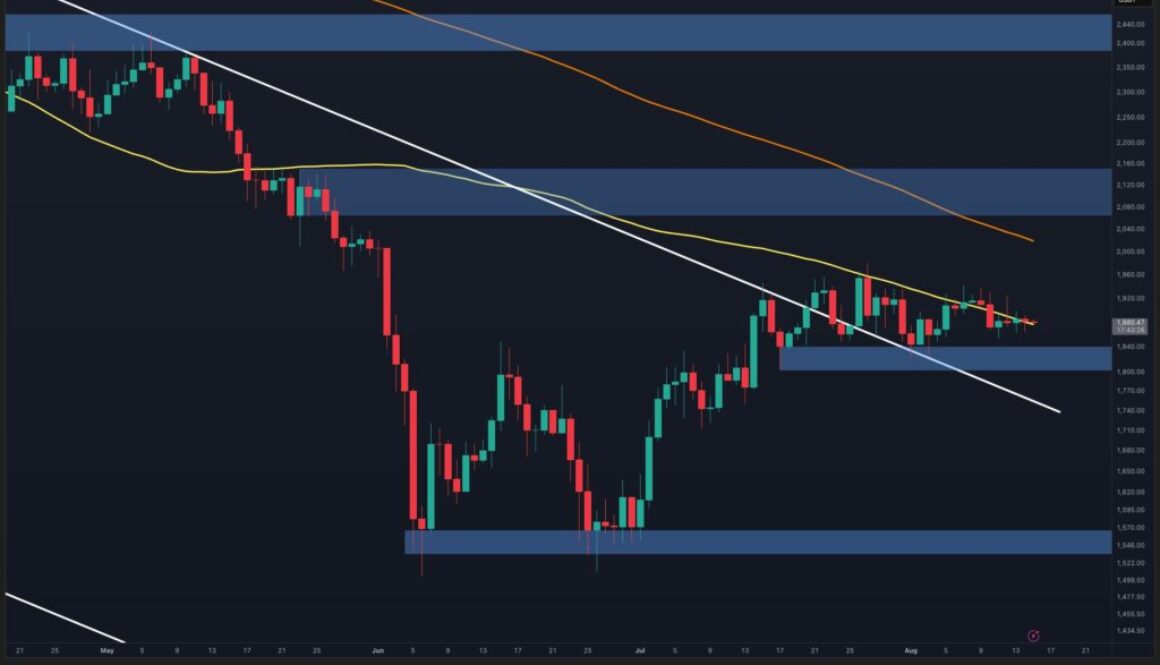
The $1.80K-$1.84K demand zone now becomes the critical near-term battlefield. This zone has already been tested multiple times and has held, but it lacks the structural conviction of the broken trendline. If selling pressure intensifies and this zone fails, the next major support sits at $1.71K-$1.75K, roughly 9 percent below current levels.
A breakdown to that level would represent a significant capitulation that could take weeks or months to repair, pushing any $2,000 target well into the future and raising questions about whether the June low was truly a market bottom. Conversely, if ETH can reclaim the broken trendline and push toward $1.95K-$1.98K, the bullish narrative would begin to stabilize.
Clearing that zone decisively would be necessary to restore genuine upside continuation potential.
Whale Accumulation Peaked in Early August, Now Replaced by Retail-Dominated Trading
The order flow data paints a more concerning picture than price action alone suggests. Throughout July and early August, large whale orders dominated the spot market, visible as green dots on the Spot Average Order Size metric. These larger orders typically reflect informed or institutional accumulation, the kind of activity that precedes sustained rallies.
That prevalence of whale activity coincided with ETH’s recovery from $1.6K toward the $1.9K region. However, the chart now shows a sharp reversal: green dots have become sparse, replaced by gray observations reflecting normal-sized retail trading activity.
This shift matters because it suggests that the institutional buyers who were accumulating at lower levels have largely completed their positioning or are now neutral to cautious. When whale orders vanish during a consolidation phase, it typically means informed capital is either taking profits or awaiting a clearer directional signal before stepping back in.
The absence of large bid support leaves the market more vulnerable to cascading retail stops and sell orders, the kind of liquidity vacuum that can trigger sharp moves lower on modest volume. For institutional traders planning entries, the absence of whale accumulation is a warning signal that the recovery may lack the foundation to push through overhead resistance toward $2,000.
Liquidity Drought and Lack of Momentum Threaten $2K Rally Before It Begins
The broader market structure reveals another institutional concern: the consolidation is occurring amid weak liquidity and subdued trading volumes. The daily chart shows ETH repeatedly touching the 100-day moving average near the $1.9K level but failing to establish a convincing breakout above it. A descending trendline nearby adds another technical barrier.
More importantly, the repeated failure to break above this zone despite multiple attempts suggests that overhead resistance is genuine and that neither buyers nor sellers possess the conviction to drive price action decisively in either direction.
This choppy, sideways price action is typical of markets caught between major technical structures, and it is particularly damaging to bullish narratives because it allows doubt to accumulate. Each failed attempt to push higher reduces confidence among traders and institutions who are waiting to add longs at higher levels.
The longer the consolidation persists without a clear breakout, the greater the risk that market participants simply move capital elsewhere in search of clearer technicals and better risk-reward setups. In that environment, reaching $2,000 requires not just a price move but a fundamental shift in market sentiment and a return of large order flow.
Until volume and liquidity return in sufficient quantity, the current choppy structure could persist indefinitely, wearing down conviction further.
The immediate focus for institutional traders is the $1.80K-$1.84K support zone over the next one to two weeks. A clean break below that level, accompanied by a spike in volume, would confirm that the early-July recovery structure has fully failed and would likely target $1.71K-$1.75K. Conversely, if this zone holds and ETH can reclaim the broken ascending trendline while whale order sizes begin to reappear in spot data, the case for a $2,000 move would strengthen materially. Until one of these outcomes materializes, the asset remains trapped in a conviction-sapping consolidation that offers limited asymmetric upside for longer-term institutional positioning.